


Article Figures & Tables
Figures
- Figure 1:
Weekly incidence of hospital admissions and presentations for ischemic stroke in Alberta, Canada before and during the first year of the COVID-19 pandemic. We defined the prepandemic period as Jan. 1, 2016 to Feb. 27, 2020, and the pandemic period as Feb. 28, 2020 to Mar. 31, 2021 (divided into 5 periods: Wave 1, lull period, Wave 2.1, Wave 2.2 and Wave 3). The x-axis is marked off in 1-year increments. Trendlines are from an interrupted time-series analysis, with knots specified at transitional time points from 1 study period to the next. The broken lines represent 95% confidence intervals.
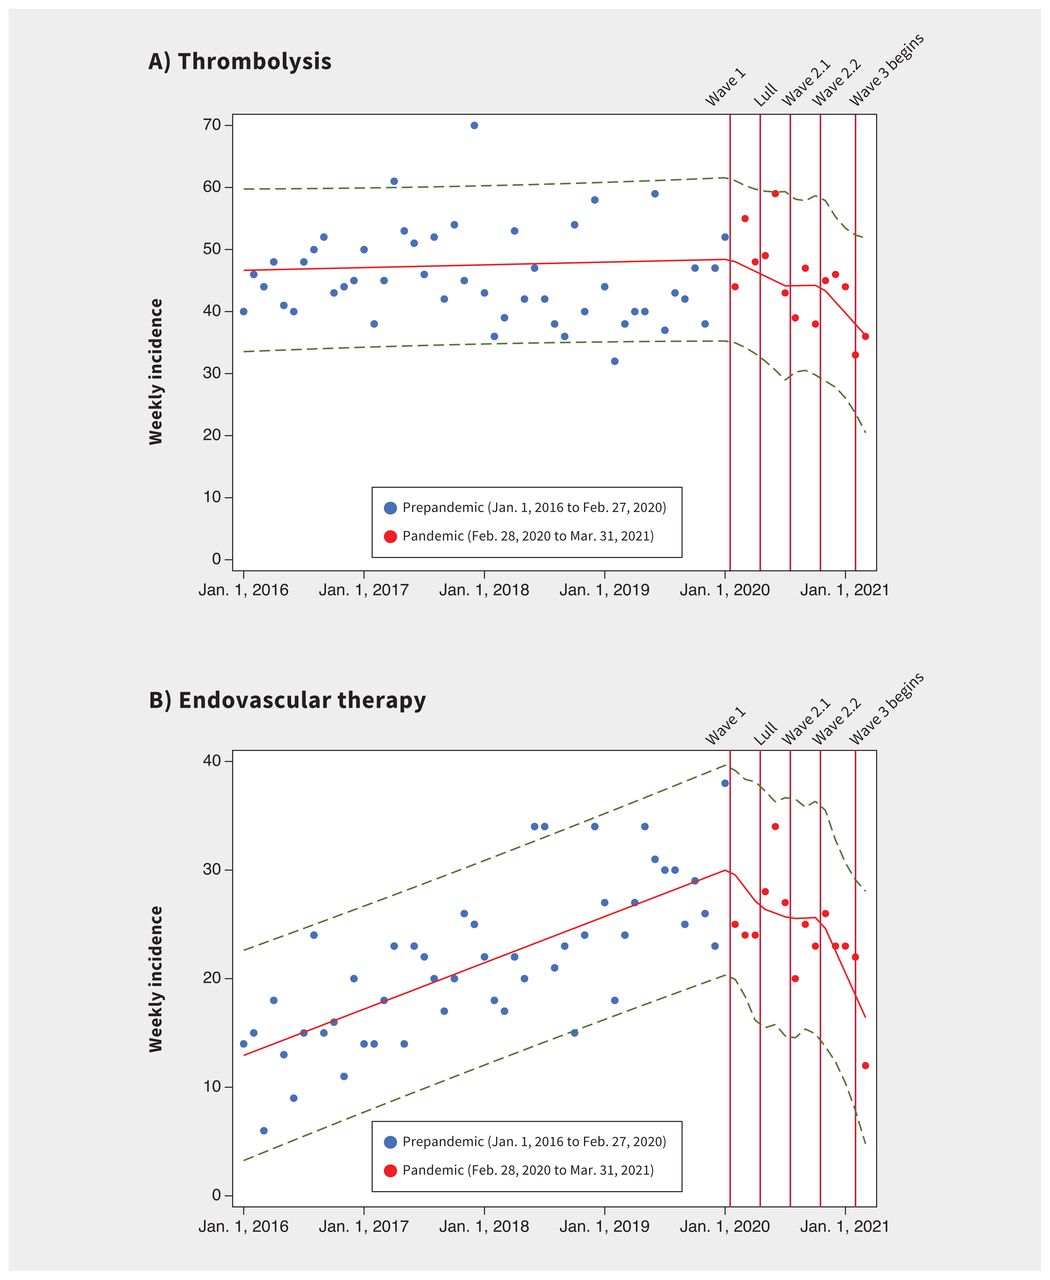
- Figure 2:
Monthly incidence of (A) thrombolysis and (B) endovascular therapy for ischemic stroke in Alberta, Canada before and during the first year of the COVID-19 pandemic. We defined the prepandemic period as Jan. 1, 2016 to Feb. 27, 2020, and the pandemic period as Feb. 28, 2020 to Mar. 31, 2021 (divided into 5 periods: Wave 1, lull period, Wave 2.1, Wave 2.2 and Wave 3). The x-axis is marked off in 1-year increments Trendlines are from an interrupted time-series analysis, with knots specified at transitional time points from 1 study period to the next. The broken lines represent 95% confidence intervals.

Tables
- Table 1:
Baseline characteristics of patients presenting with ischemic stroke before (Jan. 1, 2016 to Feb. 27, 2020) and during (Feb. 28, 2020 to Mar. 31, 2021) the first year of the COVID-19 pandemic in Alberta, Canada
Characteristic No. (%) of patients in prepandemic period*
n = 19 529No. (%) of patients in pandemic periods*,† Overall
n = 4900Wave 1
n = 851Lull
n = 921Wave 2.1
n = 1041Wave 2.2
n = 1616Wave 3
n = 471Age, yr, median (IQR) 72 (60–82) 71 (61–82) 72 (62–81) 71 (61–82) 71 (60–81) 72 (62–83) 70 (60–80) Unadjusted difference (95% CI) Ref. −0.1 (−0.6 to 0.4) 0.2 (−0.9 to 1.2) 0.4 (−0.6 to 1.4) −0.8 (−1.7 to 0.2) 0.7 (−0.02 to 1.5) −0.9 (−2.3 to 0.5) Sex, female 9100 (46.6) 2242 (45.8) 416 (48.9) 433 (47.0) 463 (44.5) 730 (45.2) 200 (42.5) Unadjusted OR (95% CI) Ref. 1.03 (0.97 to 1.10) 0.91 (0.80 to 1.05) 0.98 (0.86 to 1.12) 1.09 (0.96 to 1.23) 1.06 (0.96 to 1.17) 1.18 (0.98 to 1.42) Age-adjusted OR (95% CI) Ref. 1.04 (0.97 to 1.10) 0.91 (0.80 to 1.05) 0.99 (0.87 to 1.13) 1.08 (0.95 to 1.22) 1.07 (0.97 to 1.19) 1.17 (0.97 to 1.41) Admitted to hospital 15 344 (78.6) 3934 (80.3) 704 (82.7) 735 (79.8) 818 (78.6) 1313 (81.3) 364 (77.3) Minor stroke (not admitted) 4185 (21.4) 966 (19.7) 147 (17.3) 186 (20.2) 223 (21.4) 303 (18.8) 107 (22.7) Unadjusted OR (95% CI) Ref. 0.90 (0.83 to 0.97) 0.77 (0.64 to 0.92) 0.93 (0.79 to 1.09) 1.00 (0.86 to 1.16) 0.85 (0.74 to 0.96) 1.08 (0.87 to 1.34) Age- and sex-adjusted OR (95% CI) Ref. 0.90 (0.83 to 0.98) 0.76 (0.63 to 0.91) 0.94 (0.79 to 1.10) 0.99 (0.85 to 1.15) 0.86 (0.76 to 0.98) 1.07 (0.86 to 1.33) Continuing care needs Any continuing care 2645 (13.5) 663 (13.5) 116 (13.6) 119 (12.9) 143 (13.7) 241 (14.9) 44 (9.3) Unadjusted OR (95% CI) Ref. 1.00 (0.91 to 1.09) 1.01 (0.82 to 1.23) 0.95 (0.78 to 1.15) 1.02 (0.85 to 1.22) 1.12 (0.97 to 1.29) 0.66 (0.48 to 0.90) Age and sex-adjusted OR (95% CI) Ref. 1.02 (0.92 to 1.13) 1.02 (0.81 to 1.27) 0.89 (0.72 to 1.11) 1.13 (0.92 to 1.39) 1.11 (0.95 to 1.30) 0.71 (0.50 to 1.00) Nursing home care 485 (2.5) 91 (1.9) 11 (1.3) 20 (2.2) 19 (1.8) 33 (2.0) 8 (1.7) Unadjusted OR (95% CI) Ref. 0.74 (0.59 to 0.93) 0.51 (0.28 to 0.94) 0.87 (0.44 to 1.37) 0.73 (0.46 to 1.16) 0.82 (0.57 to 1.17) 0.68 (0.34 to 1.37) Age- and sex-adjusted OR (95% CI) Ref. 0.74 (0.59 to 0.94) 0.51 (0.28 to 0.93) 0.84 (0.53 to 1.33) 0.78 (0.49 to 1.25) 0.79 (0.55 to 1.14) 0.75 (0.37 to 1.52) Comorbidities Atrial fibrillation 2632 (13.5) 538 (11.0) 98 (11.5) 89 (9.7) 106 (10.2) 202 (12.5) 43 (9.1) Unadjusted OR (95% CI) Ref. 0.75 (0.68 to 0.83) 0.79 (0.63 to 0.98) 0.68 (0.55 to 0.86) 0.69 (0.56 to 0.85) 0.84 (0.72 to 0.99) 0.62 (0.45 to 0.86) Age-and sex-adjusted OR (95% CI) Ref. 0.75 (0.67 to 0.83) 0.78 (0.63 to 0.98) 0.67 (0.53 to 0.84) 0.72 (0.58 to 0.88) 0.82 (0.70 to 0.96) 0.66 (0.47 to 0.91) Coronary artery disease 275 (1.4) 93 (1.9) 15 (1.8) 11 (1.2) 14 (1.3) 37 (2.3) 16 (3.4) Unadjusted OR (95% CI) Ref. 1.31 (1.03 to 1.66) 1.21 (0.71 to 2.04) 0.86 (0.47 to 1.57) 0.92 (0.54 to 1.56) 1.54 (1.08 to 2.18) 2.44 (1.46 to 4.08) Age- and sex-adjusted OR (95% CI) Ref. 1.31 (1.03 to 1.66) 1.21 (0.72 to 2.05) 0.86 (0.47 to 1.57) 0.93 (0.54 to 1.59) 1.52 (1.08 to 2.16) 2.43 (1.45 to 4.08) Chronic kidney disease 404 (2.1) 91 (1.9) 11 (1.3) 14 (1.5) 18 (1.7) 41 (2.5) 7 (1.5) Unadjusted OR (95% CI) Ref. 0.86 (0.69 to 1.09) 0.59 (0.32 to 1.08) 0.74 (0.43 to 1.26) 0.80 (0.50 to 1.30) 1.15 (0.83 to 1.60) 0.70 (0.33 to 1.49) Age-and sex-adjusted OR (95% CI) Ref. 0.87 (0.69 to 1.09) 0.60 (0.33 to 1.09) 0.74 (0.43 to 1.26) 0.82 (0.51 to 1.33) 1.13 (0.82 to 1.57) 0.72 (0.34 to 1.53) Diabetes mellitus 4298 (22.0) 1157 (23.6) 193 (22.7) 213 (23.1) 249 (23.9) 398 (24.6) 104 (22.1) Unadjusted OR (95% CI) Ref. 1.05 (0.97 to 1.13) 0.98 (0.83 to 1.17) 1.09 (0.92 to 1.29) 1.07 (0.92 to 1.25) 1.07 (0.94 to 1.21) 0.98 (0.78 to 1.24) Age-and sex-adjusted OR (95% CI) Ref. 1.05 (0.97 to 1.13) 0.99 (0.84 to 1.18) 1.09 (0.92 to 1.29) 1.07 (0.92 to 1.25) 1.06 (0.94 to 1.20) 0.97 (0.77 to 1.22) Heart failure 634 (3.2) 155 (3.2) 21 (2.5) 29 (3.1) 32 (3.1) 55 (3.4) 18 (3.8) Unadjusted OR (95% CI) Ref. 0.94 (0.78 to 1.12) 0.72 (0.46 to 1.12) 0.98 (0.67 to 1.43) 0.91 (0.64 to 1.31) 0.98 (0.74 to 1.30) 1.17 (0.72 to 1.89) Age- and sex-adjusted OR (95% CI) Ref. 0.94 (0.79 to 1.13) 0.72 (0.46 to 1.12) 0.98 (0.67 to 1.44) 0.93 (0.65 to 1.34) 0.97 (0.73 to 1.29) 1.21 (0.75 to 1.95) Hypertension 9141 (46.8) 2286 (46.7) 389 (45.7) 400 (43.4) 478 (45.9) 809 (50.1) 210 (44.6) Unadjusted OR (95% CI) Ref. 0.91 (0.84 to 0.97) 0.85 (0.73 to 0.99) 0.85 (0.73 to 0.99) 0.88 (0.75 to 1.01) 1.00 (0.89 to 1.12) 0.85 (0.69 to 1.05) Age- and sex-adjusted OR (95% CI) Ref. 0.91 (0.84 to 0.98) 0.84 (0.72 to 0.99) 0.85 (0.73 to 0.99) 0.90 (0.78 to 1.04) 0.99 (0.88 to 1.11) 0.88 (0.71 to 1.10) Any comorbidity 11 027 (56.5) 2810 (57.3) 488 (57.3) 490 (53.2) 584 (56.1) 999 (61.8) 249 (52.8) Unadjusted OR (95% CI) Ref. 1.04 (0.97 to 1.10) 1.03 (0.90 to 1.19) 0.88 (0.77 to 1.00) 0.99 (0.87 to 1.12) 1.25 (1.12 to 1.39) 0.86 (0.72 to 1.04) Age- and sex-adjusted OR (95% CI) Ref. 1.03 (0.97 to 1.10) 1.04 (0.90 to 1.19) 0.88 (0.77 to 1.00) 0.99 (0.87 to 1.12) 1.25 (1.12 to 1.39) 0.86 (0.72 to 1.04) ≥ 2 comorbidities 5184 (26.5) 1244 (25.4) 199 (23.4) 228 (24.8) 261 (25.1) 441 (27.3) 115 (24.4) Unadjusted OR (95% CI) Ref. 0.94 (0.88 to 1.01) 0.84 (0.72 to 0.99) 0.91 (0.78 to 1.06) 0.93 (0.80 to 1.07) 1.04 (0.93 to 1.16) 0.89 (0.72 to 1.11) Age-and sex-adjusted OR (95% CI) Ref. 0.94 (0.87 to 1.01) 0.84 (0.71 to 0.99) 0.90 (0.77 to 1.05) 0.94 (0.81 to 1.09) 1.02 (0.91 to 1.14) 0.91 (0.73 to 1.13) Note: CI = confidence interval, IQR = interquartile range, OR = odds ratio, Ref. = reference.
↵* Unless indicated otherwise.
↵† Wave 1 = Feb. 28, 2020 to May 12, 2020, lull period = May 13, 2020 to July 20, 2020, Wave 2.1 = July 21, 2020 to Oct. 11, 2020, Wave 2.2 = Oct. 12, 2020 to Feb. 15, 2021, Wave 3 = Feb. 16, 2021 to Mar. 31, 2021.
- Table 2:
Change in the incidence of hospital admissions and presentations, and of acute therapies for ischemic stroke during the first year of the COVID-19 pandemic (Feb. 28, 2020 to Mar. 31, 2021), compared with before the pandemic (Jan. 1, 2016 to Feb. 27, 2020) in Alberta, Canada
Metric Prepandemic period‡ Pandemic periods* Wave 1 Lull Wave 2.1 Wave 2.2 Wave 3 Hospital admissions and presentations for ischemic stroke, median weekly incidence per 100 000 people 2.11 1.81 2.02 1.90 1.95 1.65 Weekly IRR (95% CI)† Ref. 0.54 (0.50 to 0.59) 0.52 (0.48 to 0.56) 0.50 (0.46 to 0.53) 0.47 (0.45 to 0.50) 0.45 (0.41 to 0.50) Monthly IRR† Ref. 0.51 (0.47 to 0.55) 0.48 (0.45 to 0.52) 0.46 (0.43 to 0.49) 0.43 (0.41 to 0.46) 0.42 (0.37 to 0.46) Quarterly IRR† Ref. 0.52 (0.48 to 0.56) 0.49 (0.46 to 0.53) 0.47 (0.44 to 0.51) 0.44 (0.42 to 0.47) 0.43 (0.39 to 0.48) Thrombolysis for ischemic stroke, median weekly incidence per 100 000 people 0.25 0.21 0.24 0.21 0.21 0.18 Weekly IRR† Ref. 0.50 (0.41 to 0.62) 0.47 (0.38 to 0.58) 0.47 (0.39 to 0.56) 0.41 (0.35 to 0.48) 0.44 (0.34 to 0.58) Monthly IRR† Ref. 0.50 (0.41 to 0.62) 0.47 (0.38 to 0.59) 0.47 (0.39 to 0.57) 0.41 (0.35 to 0.48) 0.44 (0.34 to 0.58) Quarterly IRR† Ref. 0.51 (0.42 to 0.63) 0.48 (0.39 to 0.60) 0.48 (0.40 to 0.58) 0.42 (0.36 to 0.49) 0.46 (0.35 to 0.60) Endovascular therapy for ischemic stroke, median weekly incidence per 100 000 people 0.12 0.12 0.13 0.10 0.12 0.07 Weekly IRR† Ref. 0.63 (0.47 to 0.84) 0.56 (0.43 to 0.74) 0.52 (0.40 to 0.68) 0.49 (0.40 to 0.60) 0.31 (0.19 to 0.51) Monthly IRR† Ref. 0.64 (0.47 to 0.85) 0.57 (0.43 to 0.75) 0.53 (0.40 to 0.69) 0.50 (0.40 to 0.61) 0.32 (0.20 to 0.51) Quarterly IRR† Ref. 0.65 (0.48 to 0.87) 0.58 (0.44 to 0.77) 0.54 (0.41 to 0.70) 0.50 (0.41 to 0.62) 0.33 (0.20 to 0.53) Note: CI = confidence interval, IRR = incidence rate ratio, Ref. = reference.
↵* Wave 1 = Feb. 28, 2020 to May 12, 2020, lull period = May 13, 2020 to July 20, 2020, Wave 2.1 = July 21, 2020 to Oct. 11, 2020, Wave 2.2 = Oct. 12, 2020 to Feb. 15, 2021, Wave 3 = Feb. 16, 2021 to Mar. 31, 2021.
↵† Adjusted for age, sex, preadmission continuing care needs and comorbidities.
↵‡ The median weekly incidence of hospital admissions and presentations, thrombolysis and endovascular therapy was 2.12, 0.26 and 0.15 per 100 000 people, respectively, in the last 3 months of the prepandemic period.
- Table 3:
Acute treatments and outcomes among patients presenting or admitted to hospital with ischemic stroke, and out-of-hospital stroke deaths before (Jan. 1, 2016 to Feb. 27, 2020) and during (Feb. 28, 2020 to Mar. 31, 2021) the first year of the COVID-19 pandemic in Alberta, Canada
Treatment or outcome Prepandemic period Pandemic periods* Wave 1 Lull Wave 2.1 Wave 2.2 Wave 3 Population 1: No. of patients presenting or admitted to hospital with ischemic stroke 19 529 851 921 1041 1616 471 No. (%) of patients who received thrombolysis 2277 (11.7) 119 (14.0) 122 (13.3) 116 (11.1) 173 (10.7) 54 (11.4) Unadjusted OR (95% CI) Ref. 1.23 (1.01 to 1.50) 1.16 (0.95 to 1.41) 0.95 (0.78 to 1.16) 0.91 (0.77 to 1.07) 0.98 (0.74 to 1.31) Adjusted OR† (95% CI) Ref. 1.09 (0.87 to 1.37) 1.03 (0.83 to 1.29) 1.12 (0.91 to 1.37) 1.03 (0.87 to 1.22) 1.15 (0.86 to 1.55) No. (%) of patients who received endovascular therapy 1081 (5.5) 58 (6.8) 75 (8.1) 58 (5.6) 105 (6.5) 17 (3.6) Unadjusted OR (95% CI) Ref. 1.25 (0.95 to 1.64) 1.51 (1.10 to 1.93) 1.01 (0.77 to 1.32) 1.19 (0.96 to 1.46) 0.64 (0.39 to 1.04) Adjusted OR† (95% CI) Ref. 1.18 (0.87 to 1.59) 1.28 (0.96 to 1.70) 1.15 (0.87 to 1.51) 1.33 (1.08 to 1.64) 0.71 (0.44 to 1.16) Hospital length-of-stay, d, median (IQR) 7 (3–19) 6 (3–15) 7 (3–16) 6 (3–16) 7 (3–16) 5 (2–10) Unadjusted difference (95% CI) Ref. −1.0 (−2.0 to 0.002) 0.0 (−0.9 to 0.9) −1.0 (−1.9 to −0.1) 0.0 (−0.7 to 0.7) −2.0 (−3.4 to −0.6) Adjusted difference† (95% CI) Ref. −0.7 (−1.6 to 0.1) −0.3 (−1.2 to 0.5) −0.2 (−0.9 to 0.6) −0.2 (−0.8 to 0.4) −2.0 (−3.1 to −0.9) No. (%) of patients who died in hospital, excluding patients with minor stroke who were not admitted to hospital 1637/15 344 (10.7) 74/704 (10.5) 78/735 (10.6) 68/818 (8.3) 197/1313 (15.0) 48/364 (13.2) Unadjusted OR (95% CI) Ref. 0.98 (0.77 to 1.26) 0.99 (0.78 to 1.26) 0.76 (0.59 to 0.98) 1.48 (1.26 to 1.73) 1.27 (0.93 to 1.73) Adjusted† OR (95% CI) Ref. 1.00 (0.77 to 1.30) 1.07 (0.83 to 1.37) 0.79 (0.61 to 1.02) 1.48 (1.25 to 1.74) 1.46 (1.07 to 2.00) Population 2: No. of people who died of stroke‡ 2515 125 111 111 237 181 No. (%) of people who died out of hospital 249 (9.9) 22 (17.6) 20 (18.0) 15 (13.5) 36 (15.2) 34 (18.8) Unadjusted difference (95% CI) Ref. 7.7 (1.6 to 15.8) 8.1 (1.6 to 16.9) 3.6 (−2.0 to 11.8) 5.3 (0.9 to 10.8) 8.9 (3.5 to 15.6) Note: CI = confidence interval, IQR = interquartile range, OR = odds ratio, Ref. = reference.
↵* Wave 1 = Feb. 28, 2020 to May 12, 2020, lull period = May 13, 2020 to July 20, 2020, Wave 2.1 = July 21, 2020 to Oct. 11, 2020, Wave 2.2 = Oct. 12, 2020 to Feb. 15, 2021, Wave 3 = Feb. 16, 2021 to Mar. 31, 2021.
↵† Adjusted ORs are from logistic regressions and adjusted differences are from quantile regressions. Both measures were adjusted for age, sex, continuing care needs before stroke and comorbidities.
↵‡ Odds ratios for out-of-hospital deaths could not be adjusted as we only had summary data on the out-of-hospital deaths from the vital statistics database. Some of the total stroke deaths include strokes not clearly specified as ischemic or hemorrhagic, as well as deaths among patients previously admitted to hospital for stroke who died months later, meaning that the denominator is expected to be considerably higher than the sum of the in-hospital ischemic stroke deaths and the reported out-of-hospital stroke deaths.
- Table 4:
Prehospital and in-hospital workflow and stroke severity of patients with ischemic stroke who received acute stroke therapies before (Jan. 1, 2016 to Feb. 27, 2020) and during (Feb. 28, 2020 to Mar. 31, 2021) the first year of the COVID-19 pandemic in Alberta, Canada
Characteristic Prepandemic period Pandemic periods* Wave 1 Lull Wave 2.1 Wave 2.2 Wave 3 No. of patients who received thrombolysis or endovascular therapy 2853 147 163 144 228 61 Prehospital response time Onset-to-door, min, median (IQR) 84 (52–152) 84 (53–161) 101 (59–170) 81 (48–185) 82 (56–172) 93 (56–157) Unadjusted difference (95% CI) Ref. −1.00 (−16.2 to 14.2) 16.0 (1.5 to 30.5) −4.0 (−19.2 to 11.2) −2.5 (−13.3 to 11.3) 8.0 (−15.0 to 31.0) Adjusted difference† (95% CI) Ref. −5.0 (−20.2 to 10.3) 24.3 (9.1 to 39.4) −5.9 (−19.7 to 7.9) 2.3 (−8.9 to 13.5) 5.1 (−15.7 to 25.9) In-hospital workflow times Door-to-CT, min, median (IQR) 18 (12–28) 18 (13–29) 19 (12–24) 17 (13–24) 16 (11–21) 17 (13–24) Unadjusted difference (95% CI) Ref. 0.0 (−2.5 to 2.5) 1.0 (−2.5 to 2.5) −1.0 (−3.5 to 1.5) −2.0 (−4.0 to −0.02) −1.0 (−4.7 to 2.7) Adjusted difference† (95% CI) Ref. −0.3 (−2.7 to 2.0) 0.1 (−2.3 to 2.4) −0.3 (−2.4 to 1.8) −1.8 (−3.5 to −0.05) −0.8 (−4.0 to 2.4) Door-to-needle (thrombolysis), min, median (IQR) 43 (30–66) 46 (32–70) 42 (34–61) 43 (30–65) 46 (33–64) 42 (32–60) Unadjusted difference (95% CI) Ref. 4.0 (−1.4 to 9.4) 0.5 (−5.3 to 5.3) 0.0 (−5.4 to 5.4) 3.0 (−1.5 to 7.5) 0.5 (−7.8 to 7.8) Adjusted difference† (95% CI) Ref. 4.9 (−1.1 to 10.9) 0.2 (−5.9 to 6.3) 1.5 (−3.9 to 7.0) 4.2 (−0.3 to 8.7) 1.4 (−6.4 to 9.2) CT-to-groin puncture (endovascular therapy), min, median (IQR) 53 (35–79) 78 (40–114) 63 (46–106) 58 (43–79) 66 (46–90) 43 (33–90) Unadjusted difference (95% CI) Ref. 26.0 (13.9 to 38.1) 11.0 (−0.1 to 22.1) 6.0 (−6.0 to 18.0) 14.0 (4.8 to 23.2) −9.0 (−30.8 to 12.8) Adjusted difference† (95% CI) Ref. 28.2 (15.5 to 41.0) 6.8 (−5.0 to 18.6) 5.7 (−6.9 to 18.3) 13.8 (4.1 to 23.4) −8.7 (−31.5 to 14.0) Door-to-groin puncture (endovascular therapy), min, median (IQR) 76 (53–110) 106 (63–141) 87 (65–135) 80 (59–102) 85 (58–113) 62 (50–115) Unadjusted difference (95% CI) Ref. 31.0 (15.1 to 46.9) 12.0 (−2.7 to 26.7) 4.0 (−11.9 to 19.9) 10.0 (−2.1 to 22.1) −14.0 (−42.8 to 14.8) Adjusted difference† (95% CI) Ref. 24.1 (7.6 to 40.70) 9.0 (−7.1 to 25.2) 7.0 (−8.1 to 22.0) 13.8 (2.2 to 25.3) −8.6 (−35.7 to 18.5) Groin puncture-to-reperfusion (endovascular therapy), min, median (IQR) 28 (18–44) 42 (24–61) 46 (31–61) 30 (20–52) 37.5 (24–60) 29 (21–46) Unadjusted difference (95% CI) Ref. 14.0 (6.0 to 22.0) 18.0 (10.6 to 25.4) 2.0 (−7.0 to 11.0) 10.0 (3.3 to 16.7) 1.0 (−13.0 to 15.0) Adjusted difference† (95% CI) Ref. 13.9 (6.2 to 21.7) 17.7 (9.7 to 25.8) 2.1 (−6.6 to 10.7) 8.1 (1.7 to 14.4) −2.7 (−16.0 to 10.6) Door-to-reperfusion (endovascular therapy), min, median (IQR) 111 (77–159) 159 (107–193) 137 (103–181) 111.5 (89–144) 126 (100–160) 91 (76–150) Unadjusted difference (95% CI) Ref. 48.0 (24.2 to 71.8) 26.0 (4.2 to 47.8) 0.5 (−25.8 to 27.8) 16.0 (−3.9 to 35.9) −20.0 (−61.5 to 21.5) Adjusted difference† (95% CI) Ref. 29.1 (3.5 to 54.7) 29.2 (4.6 to 53.7) −0.5 (−27.2 to 26.2) 14.1 (−5.7 to 33.8) −10.7 (−51.8 to 30.5) Stroke severity score‡ Pretreatment (all), points, median (IQR) 11 (6–18) 9 (6–16) 11.5 (6–17) 10 (5–17) 12 (7–19) 9 (5–17) Unadjusted difference (95% CI) Ref. −1.0 (−2.9 to 0.9) 0.5 (−0.8 to 2.8) 0.5 (−1.9 to 1.9) 2.0 (0.4 to 3.6) −1.0 (−3.9 to 1.9) Adjusted difference† (95% CI) Ref. −1.9 (−4.0 to 0.3) 0.1 (−2.0 to 2.2) −0.3 (−2.3 to 1.6) 0.8 (−0.8 to 2.4) −0.9 (−3.8 to 2.0) Thrombolysis recipients, points, median (IQR) 9 (5–16) 8 (6–14) 10 (5–15) 10 (5–16) 10 (6–18) 8 (5–17) Unadjusted difference (95% CI) Ref. −1.0 (−2.9 to 0.9) 1.0 (−0.9 to 2.9) 1.0 (−1.0 to 3.0) 1.0 (−0.6 to 2.6) −1.0 (−3.8 to 1.8) Adjusted difference† (95% CI) Ref. −0.3 (−2.4 to 1.8) 0.2 (−2.0 to 2.3) −0.3 (−2.2 to 1.6) 0.8 (−0.7 to 2.4) −1.2 (−3.9 to 1.6) Endovascular therapy recipients, points, median (IQR) 16 (11–20) 13 (9–18) 15 (8–18) 16.5 (10–20) 16 (11–21) 17 (11–21) Unadjusted difference (95% CI) Ref. −3.0 (−5.2 to −0.8) −1.0 (−3.0 to 1.0) 0.5 (−2.2 to 2.2) 0.0 (−1.7 to 1.7) 1.0 (−3.0 to 5.0) Adjusted difference† (95% CI) Ref. −4.2 (−6.9 to −1.6) −1.6 (−4.2 to 0.9) −0.9 (−3.4 to 1.5) −0.4 (−2.3 to 1.4) 0.2 (−4.2 to 4.6) 24 hr after treatment, points, median (IQR) 3 (1–9) 3 (0–7) 3 (1–13) 2.5 (1–6) 3 (1–10) 2 (1–6) Unadjusted difference (95% CI) Ref. 0.0 (−1.9 to 1.9) 0.0 (−1.7 to 1.7) −0.5 (−1.9 to 1.9) 0.0 (−1.5 to 1.5) −1.0 (−3.8 to 1.8) Adjusted difference† (95% CI) Ref. −0.9 (−2.6 to 0.7) −0.03 (−1.5 to 1.5) −1.2 (−2.6 to 0.3) 0.03 (−1.1 to 1.2) −1.1 (−3.2 to 1.0) Note: CI = confidence interval, CT = computed tomography, IQR = interquartile range, Ref. = reference.
↵* Wave 1 = Feb. 28, 2020 to May 12, 2020, lull period = May 13, 2020 to July 20, 2020, Wave 2.1 = July 21, 2020 to Oct. 11, 2020, Wave 2.2 = Oct. 12, 2020 to Feb. 15, 2021, Wave 3 = Feb. 16, 2021 to Mar. 31, 2021.
↵† The adjusted differences presented are a comparison of the given parameter for each pandemic period verus the prepandemic period using quantile regression, after adjusting for age, sex, comorbidities and continuing care needs. For example, this means that onset-to-door times were on average 24.3 minutes longer in the second pandemic period (“lull”) than in the prepandemic period.
↵‡ Stroke severity was measured using the National Institutes of Health Stroke Scale score, which provides an objective method of scoring baseline neurologic impairment from stroke as well as subsequent changes in the patient’s deficits. The range of possible scores is 0 to 42 points, with higher scores indicating more severe neurologic deficits.
In this issue

Article tools


Jump to section
Related Articles
Cited By...
More in this TOC Section
Similar Articles
Collections

