


Abstract
BACKGROUND: The Mini-Mental State Examination continues to be used frequently to screen for cognitive impairment in older adults, but it remains unclear how to interpret changes in its score over time to distinguish age-associated cognitive decline from an early degenerative process. We aimed to generate cognitive charts for use in clinical practice for longitudinal evaluation of age-associated cognitive decline.
METHODS: We used data from the Canadian Study of Health and Aging from 7569 participants aged 65 years or older who completed a Mini-Mental State Examination at baseline, and at 5 and 10 years later to develop a linear regression model for the Mini-Mental State Examination score as a function of age and education. Based on this model, we generated cognitive charts designed to optimize accuracy for distinguishing participants with dementia from healthy controls. We validated our model using a separate data set of 6501 participants from the National Alzheimer’s Coordinating Center’s Uniform Data Set.
RESULTS: For baseline measurement, the cognitive charts had a sensitivity of 80% (95% confidence interval [CI] 75% to 84%) and a specificity of 89% (95% CI 88% to 90%) for distinguishing healthy controls from participants with dementia. Similar sensitivities and specificities were observed for a decline over time greater than 1 percentile zone from the first measurement. Results in the validation sample were comparable, albeit with lower sensitivities. Negative predictive value was 99%.
INTERPRETATION: Our innovative model, which factors in age and education, showed validity and diagnostic accuracy for determining whether older patients show abnormal performance on serial Mini-Mental State Examination measurements. Similar to growth curves used in pediatrics, cognitive charts allow longitudinal cognitive evaluation and enable prompt initiation of investigation and treatment when appropriate.
Epidemiological evidence suggests that dementia poses a threat to public health worldwide.1 Advancing age is the leading factor driving this threat.2 To date, no curative treatment is available for Alzheimer disease, the most common cause of dementia. However, disease-modifying treatments are being tested in clinical trials, and modifiable risk factors can be addressed to delay onset before irreversible brain damage occurs.3,4
Preventive efforts encourage the aging population to seek help at the earliest cognitive change.5–7 Standard work-up for dementia includes laboratory tests and imaging to rule out reversible conditions, as well as cognitive screening using the Mini-Mental State Examination.8 When in doubt, the Mini-Mental State Examination is repeated at follow-up visits. Depending on performance and whether functional decline is present, physicians will either make a diagnosis or refer the patient to a specialized memory clinic. How physicians should determine whether follow-up results from the Mini-Mental State Examination are compatible with age-associated cognitive decline9–12 or represent mild cognitive impairment or dementia remains unclear. Cut-off scores are imperfect, notably for older adults with limited education or if the scores are not adjusted for age and education; within-subject comparisons are not allowed.13–16 Normative data for the Mini-Mental State Examination exist,11,16–20 but physicians seldom use them. Percentile tables do not allow longitudinal tracking of decline.
We aimed to generate ready-to-use cognitive charts for follow-up of age-associated cognitive decline, analogous to pediatric growth charts,21 based on key predictors of incipient decline in the Mini-Mental State Examination, to allow simple clinical follow-up of age-associated cognitive decline by first-line physicians using the Mini-Mental State Examination.
Methods
Derivation sample
This study used a training sample population from the Canadian Study of Health and Aging22 for model building. It is a well-described sample population of older adults aged > 65 years.22,23 In brief, participants were randomly selected from Medicare lists and enrolled at 18 centres in Canada. A nurse administered the Modified Mini-Mental State examination24 (francophone participants completed the French version). The Modified Mini-Mental State Examination was selected because of its coverage of relevant aspects of cognition, documentation and validity. It adds several questions to the Mini-Mental State Examination and uses a more sophisticated scoring system but permits computation of scores for the Mini-Mental State Examination. Second, a psychometrician administered several neuropsychologic tests to participants with a score of 50 or more on the Modified Mini-Mental State Examination. Third, a physician reviewed the information and examined the patient. A case conference determined diagnosis (i.e., no cognitive loss, cognitive impairment with no dementia, dementia, others). Follow-up sessions, intervals and measurements are summarized in Appendix 1 (available at www.cmaj.ca/lookup/suppl/doi:10.1503/cmaj.160792/-/DC1).
We excluded participants with cognitive impairment with no dementia, and those who had unreliable trajectories (i.e., who oscillated between normal and impaired cognition). As such, we included participants who remained healthy throughout the 10-year course (1991–2001), as well as those with a diagnosis of dementia. We used these participants to set discrimination criteria and estimate the performance of the model.
Statistical modelling
We began by building a model to predict scores for the Mini-Mental State Examination in healthy controls, taking into account age and education, using repeated-measures regression analyses. We then transformed this model into a simplified linear form for use in generating the cognitive charts. Our main purpose was not to provide a prediction model for the Mini-Mental State Examination but to linearize its relationship to age and education, the 2 predominant factors of relevance to change in this test over time. Details are reported in Appendix 2 (available at www.cmaj.ca/lookup/suppl/doi:10.1503/cmaj.160792/-/DC1).
We tested the value of the proposed model in corroborating the well-described concept of normal age-associated cognitive decline.9–12 As a first step in building the cognitive charts using the full Canadian Study of Health and Aging data set (healthy controls and participants with dementia), we searched for the optimal cognitive decline rate to discriminate the 2 groups using standard logistic regression methods, based on the rate that produced the most accurate combination of sensitivity and specificity, as defined by the Youden index. We then generated the cognitive charts as a set of curves defined by our model, using the above rate of decline to define the spacing between curves, each of which represents various quantiles of normal age-associated cognitive decline. We chose the quantiles so that the distance between any 2 curves would represent the amount of cognitive decline over time, taking into account age and education, that would maximize classification efficiency for discriminating between participants with dementia and healthy controls. We also identified the midlines between the main percentiles to facilitate visual follow-up of decline.
As described previously, a main objective of the cognitive charts is to provide early detection of anomalous longitudinal decline. Nonetheless, we felt it prudent to add a cut-off zone where participants with abnormal cognition at their first or any single measurement would be readily identified. This zone needed to be adjusted for age and education because we worked with the Mini-Mental State Examination. Therefore, we derived a cut-off zone using the percentile line or midline of the charts that maximized sensitivity and specificity as a whole.
Validation sample
We further validated the generalizability of our model and procedure using an external sample obtained from open access data in the National Alzheimer’s Coordinating Center’s Uniform Data Set.25 It was selected because of size and comparability (normal volunteers, standardized evaluation, consensus diagnosis, longitudinal data with annual follow-up) (Appendix 1). We estimated and compared the postulated model using repeated-measures regression, and used the cognitive charts to make predictions on the external data set.
Diagnostic accuracy
We compared sensitivities and specificities based on the cognitive charts to those based on the most widely recognized Mini-Mental State Examination cut point (< 24) using both study populations, as well as subgroups of age, education and baseline test score. Because our algorithm aimed at using multiple measures to monitor cognitive decline (as opposed to cut-offs), we compared its performance to that of the score of the last follow-up visit. Finally, we constructed a receiver operating characteristic (ROC) curve for the Mini-Mental State Examination with 95% bootstrap confidence bands and the diagnostic accuracy of the cognitive charts, and highlighted the diagnostic accuracy of the suggested Mini-Mental State Examination cut-off on the cognitive charts. We also followed Biggerstaff’s method26 to illustrate positive and negative likelihood ratios.
Ethics approval
The study was approved by the institutional review boards at all 18 participating Canadian Study of Health and Aging centres. Written informed consent was obtained from all participants or their legal representatives.
Results
For our training sample population (n = 9008 participants in the Canadian Study of Health and Aging), we excluded 1269 participants with a diagnosis of cognitive impairment with no dementia, and 170 participants with unreliable trajectories. We included 6411 participants as healthy controls and 1158 with dementia. The mean follow-up time was 4.91 (standard deviation [SD] 4.15) years overall (including participants with only 1 visit) and 7.60 (SD 2.50) years for the 65% of participants with more than 1 visit. Our external validation sample population included 6501 participants who were healthy at the start of the study and either remained healthy over the course of the study (n = 6000) or received a diagnosis of dementia (n = 501). The mean follow-up time was 3.88 (SD 2.87) years overall and 4.34 (SD 2.53) years in the 78% of participants with more than 1 visit. Characteristics of the training and validation sample populations are shown in Table 1.
Characteristics of the study populations
Table 2 presents the parameter estimates, confidence interval bounds and significance levels of the initial model for predicting Mini-Mental State Examination score as a function of age and education. We further simplified the model for practical use (Appendix 2 and Appendix 3, available at www.cmaj.ca/lookup/suppl/doi:10.1503/cmaj.160792/-/DC1). The cognitive quotient was defined as Mini-Mental State Examination score/age × 1000, where mean cognitive quotient = 786 – 5.77(age – 0.515 × education), and the right-hand side (i.e., [age – 0.515 × education]) was named standardized age, where standardized age = age – 0.515 × education. For ease of use, and with minimal loss of precision, we propose that clinicians use standardized age = age – 0.5 × education. Because the scale for standardized age uses age and education, we termed this scale “standardized years.” The estimated cognitive quotient model can then be formulated as cognitive quotient = 786 – 5.77 × standardized age. Appendix 4 (available at www.cmaj.ca/lookup/suppl/doi:10.1503/cmaj.160792/-/DC1) shows the distribution of the cognitive quotient versus that of the original scores from the Mini-Mental State Examination.
Estimates and confidence intervals for the initial prediction model for Mini-Mental State Examination scores
Our model suggested that cognitive quotient is a linear function of standardized age, and participants who remained normal lost about 5.77 cognitive quotient points per standardized year. We found that an annual decline of 8.59 points over the average follow-up of 7.78 standardized years gave a sensitivity of 0.74 and specificity of 0.81, which corresponds to the maximum Youden index of 0.55 (Appendix 5, available at www.cmaj.ca/lookup/suppl/doi:10.1503/cmaj.160792/-/DC1).
Figure 1 shows the cognitive charts on which any participant’s cognitive quotient may be plotted against their standardized age. Each solid parallel line represents a percentile ranging from the 10th to the 99th. We set the cut-off zone (the grey zone at the bottom of Figure 1) as the midline between the 22nd and 43rd percentiles, because it gave, in combination with the allotted width of a percentile zone, a Youden index of 0.62 with sensitivity of 0.80 and specificity of 0.82. Depending on the value of the education variable, this corresponds to a Mini-Mental State Examination score between 23 and 26 at age 65 years or between 19 and 23 at age 90 years. As a rule, if any measurement (e.g., baseline or follow-up) falls within the cut-off zone, the participant may have cognitive problems. Otherwise, if on repeated visits a participant shows a decline greater than the allotted width of 1 percentile zone from the initial measurement (e.g., started on the 85th and crossed the 65th), then the participant could potentially have cognitive problems. Based on the training sample population, the proposed classification algorithm (i.e., crossing 1 interval zone or falling into the cut-off zone) had a sensitivity of 80% (95% confidence interval [CI] 75% to 84%), a specificity of 89% (95% CI 88% to 90%) and a negative predictive value of 99% (95% CI 99% to 99%) using the baseline Mini-Mental State Examination measurement only (Table 3).

The cognitive charts. Each solid parallel line represents a percentile: 99th percentile (blue), 85th percentile (light brown), 65th percentile (turquoise), 43rd percentile (purple), 22nd percentile (green) and 10th percentile (red). These colours were chosen from colour palettes for colour-blindness. The grey zone at the bottom represents the cut-off zone. Points on the chart at baseline that fall within the cut-off zone (or any single point within that zone) or, subsequently, that represent a decline greater than the allotted width of 1 percentile zone from the initial measurements, indicate potential cognitive problems. Note: QuoCo = cognitive quotient, SA = standardized age.
Accuracy of the cognitive charts for identifying participants with dementia in the training sample population (Canadian Study of Health and Aging)22
Replication in the National Alzheimer’s Coordinating Center’s Uniform Data Set25 sample population yielded the following equation: cognitive quotient = 767 – 5.51 × standardized age. This equation was similar to one generated for the training sample population: (cognitive quotient = 786 – 5.77 × standardized age), verifying the postulated relation between the cognitive quotient and standardized age. Based on the validation sample, the classification algorithm showed slightly higher specificities, but substantially lower sensitivities, compared with those from the training sample (Table 4).
Accuracy of the cognitive charts for identifying participants with dementia in the validation sample population (National Alzheimer’s Coordinating Center’s Uniform Data Set25)*
Recognizing that a diagnosis of cognitive impairment with no dementia is not equivalent to mild cognitive impairment, we compared the general trend of cognitive quotient among the healthy controls, cognitive impairment with no dementia, and dementia groups using a mixed-effects repeated-measures model (Appendix 6, available at www.cmaj.ca/lookup/suppl/doi:10.1503/cmaj.160792/-/DC1). There was a significant group effect (p < 0.001) whereby the cognitive impairment with no dementia group differed from the healthy control and dementia groups at baseline. Furthermore, the dementia group declined significantly more than the healthy control group over time (−8.19 [95% CI −8.42 to −7.97] v. −5.69 [95% CI −5.79 to −5.59], p < 0.001), but the cognitive impairment with no dementia group did not (−5.77 [95% CI −5.97 to −5.58] v. −5.69 [95% CI −5.79 to −5.59], p 0.4).
Compared with a Mini-Mental State Examination cut point score less than 24, the cognitive charts showed greater sensitivity but lower specificity (Table 5 and Figure 2). As a result, compared with the Mini-Mental State Examination cut-off, the cognitive charts improved the classification of patients with dementia, while increasing misclassification of patients with normal cognition, yielding an overall net reclassification improvement of 12.36% in the validation cohort (Table 6). In the derivation cohort (which classified some patients as cognitively normal based on the mental status score alone without further clinical evaluation, thus artifactually inflating the accuracy of the Mini-Mental State Examination cut-off), the net reclassification improvement was −4.44%. The cognitive charts showed greater stability in sensitivity and specificity than the Mini-Mental State Examination cut-off across population age and education subgroups (Figure 3 and Appendix 7, available at www.cmaj.ca/lookup/suppl/doi:10.1503/cmaj.160792/-/DC1).
Comparison of the cognitive quotient method and the Mini-Mental State Examination cut-off method for identifying participants with dementia, by sample population*

Receiver operating characteristic curve for the MMSE and diagnostic accuracy of QuoCo. These plots are the estimated ROC curves for the MMSE in predicting cognitive status for participants in the databases of CSHA and NACC. The dashed curve is a 95% bootstrap CI for the ROC curve.27 In each plot, A represents diagnostic performance with 95% CI for the QuoCo and B shows the diagnostic performance of the MMSE cut-off (< 24). Lines C and D are the positive and negative likelihood ratios, respectively. The area defined by B–C–D illustrates where any test would be more suitable for confirming the absence of disease than the MMSE cut-off score (see Biggerstaff26), and is the region where the QuoCo lies. Altogether, the graphs show that the QuoCo algorithm is better than the MMSE cut-off for confirming absence of disease, a highly desirable characteristic for a screening test. However, the slightly better overall diagnostic accuracy of the MMSE cut points over the cognitive curves on the graphs is likely related to selection bias (i.e., the CSHA used a cut-off for participant selection). Note: CI = confidence interval, CSHA = Canadian Study of Health and Aging,22 MMSE = Mini-Mental State Examination, NACC = National Alzheimer’s Coordinating Center’s Uniform Data Set, QuoCo = cognitive quotient, ROC = receiver operating characteristic.
Net reclassification improvement of the cognitive quotient over the Mini-Mental State Examination cut-off score* of < 24, by sample population

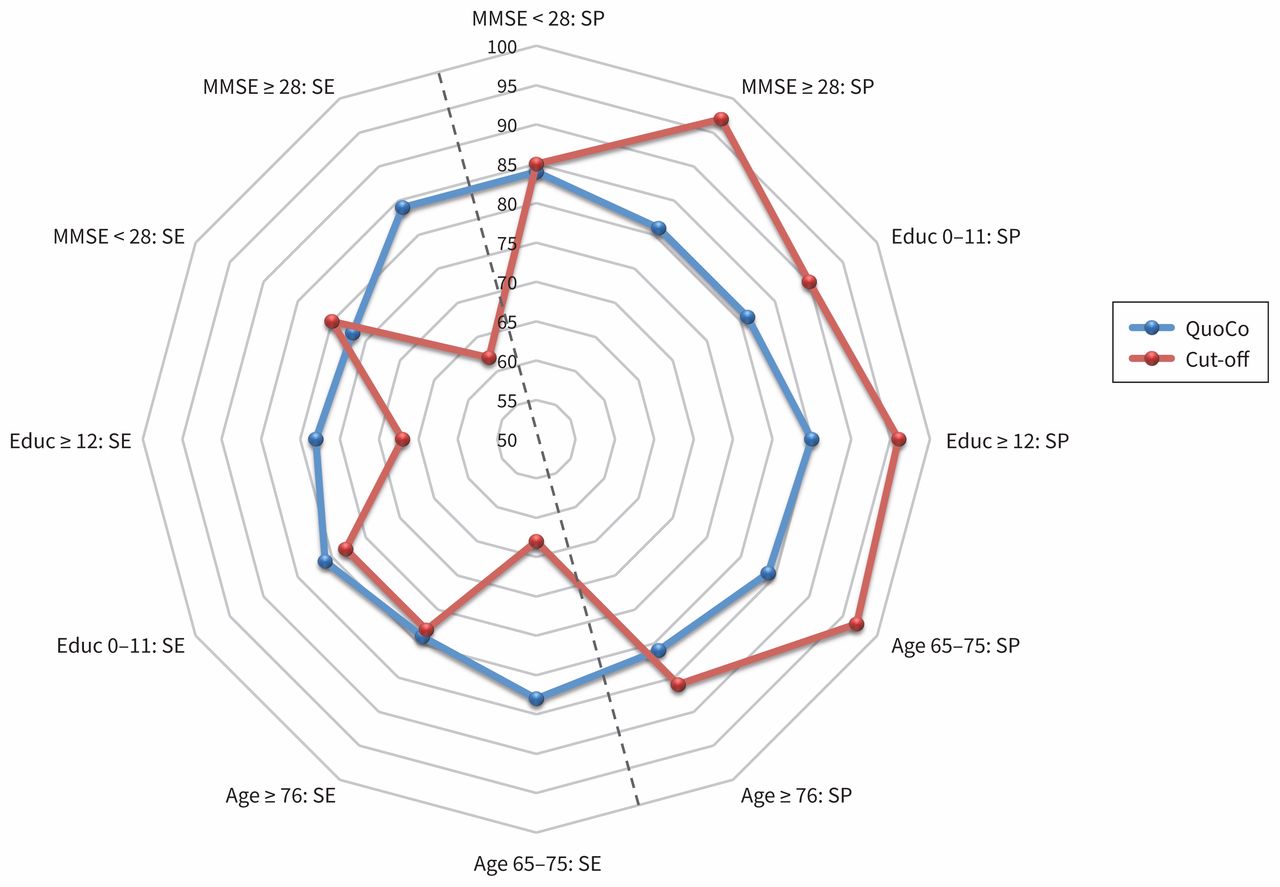
Variations in sensitivity and specificity, by population subgroups. Interpretation of MMSE classification (QuoCo v. Cut-off) was accomplished in 3 separate ways: proximity to the external frame, which shows better performance; SE/SP equilibrium, which is most centred as shown in the graph; and stability of performances in subgroups as shown by the regularity of the continuous line. This graph illustrates the stability of the QuoCo and its balanced SE/SP, whereas the cut-off SP remains superior. Note: Educ = years of education, MMSE = Mini-Mental State Examination, QuoCo = Cognitive quotient, SE = sensitivity, SP = specificity.
Clinical cases illustrating use of the cognitive charts are presented in Appendix 8 (available at www.cmaj.ca/lookup/suppl/doi:10.1503/cmaj.160792/-/DC1).
Interpretation
Dementing illnesses have reached pandemic levels.1,4,19 Early detection of cognitive impairment remains our best approach to disease management before irreversible brain damage occurs.2,3,28 Family physicians are in a key position to contribute to this approach; however, they are ill-equipped.29
We derived cognitive charts for early detection and clinical follow-up of age-associated cognitive decline based on the Mini-Mental State Examination using a large Canadian cohort of healthy controls who had follow-up over a 10-year period. Our classification algorithm yielded high sensitivity, high specificity and very high negative predictive value. It proved equal to a cut-off approach, while offering numerous critical advantages over and beyond cut-off scores: longitudinal tracking of performance along an outstanding data set; better assessment of high initial Mini-Mental State Examination scores; less vulnerability to ceiling and floor effects; visually combining age and education on the same graph; less statistical variation in sensitivity and specificity over time and population subgroups (age, gender, education); and a visual representation of the concept of cognitive reserve. Finally, external validation on a separate data set (National Alzheimer’s Coordinating Center’s Uniform Data Set25), a key validity test of a model-based approach, showed the cognitive charts to be highly valid, reliable and an improvement over the use of a simple Mini-Mental State Examination cut-off.
Rates of decline in healthy controls that we observed are similar to previous large studies using the Mini-Mental State Examination.9,10,12,30,31 Consistent with previous work, we found that higher levels of education are associated with better cognitive performance but not with more rapid rate of decline.32 Our data also showed that Mini-Mental State Examination scores were not significantly affected by gender.33
Previous studies have generated percentile charts of normal Mini-Mental State Examination scores in various age groups.11,17 However, education was not included in these percentile charts, and not all of the included participants were confirmed to be free of dementia. In some studies, education level was only classified as high or low.34 All of these studies illustrated test distribution in normal scores. A recent Cochrane meta-analysis35 evaluated the diagnostic accuracy of 18 different Mini-Mental State Examination cut points for dementia in people aged 65 years and older in community and primary care settings who had not undergone prior testing for dementia. The summary diagnostic accuracy of a cut point of 24 was a sensitivity of 85% and a specificity of 90%. However, at this and other cut points, wide variability in estimates of sensitivity and specificity was observed among individual studies, illustrating the limitations of a fixed cut-point approach and the influence of different population characteristics on diagnostic performance. Using cut points adjusted for education increased sensitivity and lowered specificity in the meta-analysis, similar to our cognitive charts; however, our work integrated Mini-Mental State Examination, age and education in the same model. We developed charts that show expected normal cognitive trajectories compared with patients with dementia in an attempt to better discriminate the 2 populations over time. The accuracy of the cognitive charts is superior to percentile tables,11,16,17,34–36 which categorize patients into specific predetermined boxes, whereas ample data suggest that intervals in normative tables are not constant, being driven differently by age and education at different spectra of the continuum.35 Our representative cases also clearly showed that a fixed cut-off does not accurately represent the longitudinal trajectory of an individual’s cognitive performance.
Limitations
This study has several limitations. First, the Mini-Mental State Examination is not a perfect screening measure, and several researchers have discussed its limitations, particularly in comparison with more recent instruments.37,38 Nonetheless, it has gained international acceptance for use in research involving cognition and dementia.11,15,18,31,33,39–43 Moreover, using a test developed in 1975 is quite useful for tracking cognition over time, because most patients have completed one previously. Although data are based on Mini-Mental State Examination scores that were extracted from testing using the Modified Mini-Mental State Examination administered as part of the Canadian Study of Health and Aging,22 formal psychometric comparison conducted between the Mini-Mental State Examination and the Modified Mini-Mental State Examination suggested that the 2 tests produce comparable effects.18 The Mini-Mental State Examination extracted from the Modified Mini-Mental State Examination is equivalent to the original Mini-Mental State Examination, and the items of the Psychological Assessment Resources44 Mini-Mental State Examination45 are identical to the original Mini-Mental State Examination used in the Canadian Study of Health and Aging. Normative data based on 18 056 community-dwelling adults as part of the National Institute of the Mental Health – Epidemiologic Catchment Area Program46 are comparable to those from the Canadian Study of Health and Aging.22 The data were collected 2 decades ago, but external validation on the National Alzheimer’s Coordinating Center’s Uniform Data Set, which started in 2005, yielded similar findings. Data collected from community-dwelling cognitively healthy Canadians may not be generalizable to countries outside North America, and further validation of cognitive charts should be performed before application is promoted outside of North America. Removal of the cognitive impairment with no dementia group may have enlarged differences between the healthy control and dementia groups. However, the definition of cognitive impairment with no dementia from the Canadian Study of Health and Aging is not equal to mild cognitive impairment. Moreover, cognitive charts are based on individuals with normal levels of cognition.
The standard used in the Canadian Study of Health and Aging to establish the diagnosis of dementia was consensus of multidisciplinary clinicians based on a detailed clinical evaluation, which included the Mini-Mental State Examination itself. Similarly, the clinical diagnosis of dementia in the National Alzheimer’s Coordinating Center’s Uniform Data Set incorporated knowledge of the patient’s Mini-Mental State Examination. Therefore, observed sensitivities and specificities may be exaggerated because of incorporation and verification biases. Both data sets were highly comparable, but participants in the National Alzheimer’s Coordinating Center’s Uniform Data Set25 were slightly younger, more educated and cognitively healthier at the start of the study than those in the training sample population. Incidence of delirium appeared lower. Other differences in sensitivity, specificity and positive predictive value between the data sets may affect generalizability, and further research will be needed to carefully assess the implications of these findings. Despite these limitations, we believe the data used here is of high quality. Indeed, data from the Canadian Study of Health and Aging22 have been used widely in research and have served to answer research questions on the incidence, prevalence, cause and development of Alzheimer disease and related dementias in Canada for over 20 years.23
Conclusion
Similar to the “growth charts” that are used in pediatrics, cognitive charts allow physicians to position any patient based on age, education and Mini-Mental State Examination scores, and simply track the longitudinal profile of cognitive decline over time. This implies an ability to prompt earlier intervention for an older adult who “fell off” the curve. A decline on the cognitive charts should prompt further detailed investigation5,6 according to the 4th Canadian Consensus Conference on the Diagnosis and Treatment of Dementia,47 whereas absence of decline reliably identifies those patients who do not need further cognitive work-up.9–12 Cognitive charts are predicted to have an impact on practice. Analyses are underway in our laboratory to derive a similar model using the Montreal Cognitive Assessment.48 Further information and tutorials on the use of our cognitive charts are available through a mobile app, which can be downloaded from www.quoco.org.
Acknowledgements
The authors would like to acknowledge the amazing work of all the participants in the Canadian Study of Health and Aging22 as well as the National Alzheimer’s Coordinating Center’s (NACC) Uniform Data Set study.25 The NACC database is funded by National Institute on Aging (NIA)/National Institutes of Health Grant U01 AG016976. Data from NACC are contributed by the NIA funded Alzheimer’s Disease Centers (ADCs): P30 AG019610 (Prinicipal Investigator [PI] Eric Reiman, MD), P30 AG013846 (PI Neil Kowall, MD), P50 AG008702 (PI Scott Small, MD), P50 AG025688 (PI Allan Levey, MD, PhD), P50 AG047266 (PI Todd Golde, MD, PhD), P30 AG010133 (PI Andrew Saykin, PsyD), P50 AG005146 (PI Marilyn Albert, PhD), P50 AG005134 (PI Bradley Hyman, MD, PhD), P50 AG016574 (PI Ronald Petersen, MD, PhD), P50 AG005138 (PI Mary Sano, PhD), P30 AG008051 (PI Steven Ferris, PhD), P30 AG013854 (PI M. Marsel Mesulam, MD), P30 AG008017 (PI Jeffrey Kaye, MD), P30 AG010161 (PI David Bennett, MD), P50 AG047366 (PI Victor Henderson, MD, MS), P30 AG010129 (PI Charles DeCarli, MD), P50 AG016573 (PI Frank LaFerla, PhD), P50 AG016570 (PI Marie-Francoise Chesselet, MD, PhD), P50 AG005131 (PI Douglas Galasko, MD), P50 AG023501 (PI Bruce Miller, MD), P30 AG035982 (PI Russell Swerdlow, MD), P30 AG028383 (PI Linda Van Eldik, PhD), P30 AG010124 (PI John Trojanowski, MD, PhD), P50 AG005133 (PI Oscar Lopez, MD), P50 AG005142 (PI Helena Chui, MD), P30 AG012300 (PI Roger Rosenberg, MD), P50 AG005136 (PI Thomas Montine, MD, PhD), P50 AG033514 (PI Sanjay Asthana, MD, FRCP), P50 AG005681 (PI John Morris, MD), and P50 AG047270 (PI Stephen Strittmatter, MD, PhD). The authors also thank Dr. Carol Brayne for her useful comments on earlier versions of this paper. Finally, thanks to Audrey Paradis, Research Coordinator, for her great help with the figures and tables.
Footnotes
Competing interests: Patrick Bernier reports patent 62/403,984 pending. No other competing interests were declared.
This article has been peer reviewed.
Contributors: Patrick Bernier and Christian Gourdeau contributed equally. All of the authors contributed to study concept and design. Christian Gourdeau and Pierre-Hugues Carmichael performed the statistical analysis. Patrick Bernier supervised the study. Patrick Bernier and Christian Gourdeau contributed to cognitive quotient, standardized age, and cognitive charts concept and design. Patrick Bernier, Christian Gourdeau, Pierre-Hugues Carmichael, René Verreault, Edeltraut Kröger and Robert Laforce Jr. analyzed and interpreted the data. Patrick Bernier, Christian Gourdeau, Pierre-Hugues Carmichael, Edeltraut Kröger and Robert Laforce Jr. drafted the manuscript. All of the authors critically revised the manuscript for important intellectual content, gave final approval of the version to be published and agreed to be accountable for all aspects of the work.
- Accepted July 1, 2017.
References
In this issue

Article tools


Jump to section
Related Articles
Cited By...
- No citing articles found.
More in this TOC Section
Similar Articles

