
Main menu

  • Home
  • Content
    • Current issue
    • Past issues
    • Early releases
    • Collections
    • Sections
    • Blog
    • Infographics & illustrations
    • Podcasts
    • COVID-19 articles
    • Obituary notices
  • Authors & Reviewers
    • Overview for authors
    • Submission guidelines
    • Submit a manuscript
    • Forms
    • Editorial process
    • Editorial policies
    • Peer review process
    • Publication fees
    • Reprint requests
    • Open access
    • Patient engagement
  • Physicians & Subscribers
    • Benefits for Canadian physicians
    • CPD Credits for CMA Members
    • Subscribe to CMAJ Print
    • Subscription prices
    • Obituary notices
  • Alerts
    • Email alerts
    • RSS
  • JAMC
    • À propos
    • Numéro en cours
    • Archives
    • Sections
    • Abonnement
    • Alertes
    • Trousse média 2023
    • Avis de décès
  • CMAJ JOURNALS
    • CMAJ Open
    • CJS
    • JAMC
    • JPN

User menu

Search

  • Advanced search
CMAJ
  • CMAJ JOURNALS
    • CMAJ Open
    • CJS
    • JAMC
    • JPN
CMAJ

Advanced Search

  • Home
  • Content
    • Current issue
    • Past issues
    • Early releases
    • Collections
    • Sections
    • Blog
    • Infographics & illustrations
    • Podcasts
    • COVID-19 articles
    • Obituary notices
  • Authors & Reviewers
    • Overview for authors
    • Submission guidelines
    • Submit a manuscript
    • Forms
    • Editorial process
    • Editorial policies
    • Peer review process
    • Publication fees
    • Reprint requests
    • Open access
    • Patient engagement
  • Physicians & Subscribers
    • Benefits for Canadian physicians
    • CPD Credits for CMA Members
    • Subscribe to CMAJ Print
    • Subscription prices
    • Obituary notices
  • Alerts
    • Email alerts
    • RSS
  • JAMC
    • À propos
    • Numéro en cours
    • Archives
    • Sections
    • Abonnement
    • Alertes
    • Trousse média 2023
    • Avis de décès
  • Visit CMAJ on Facebook
  • Follow CMAJ on Twitter
  • Follow CMAJ on Pinterest
  • Follow CMAJ on Youtube
  • Follow CMAJ on Instagram
Research
Open Access

Geographic concentration of SARS-CoV-2 cases by social determinants of health in metropolitan areas in Canada: a cross-sectional study

Yiqing Xia, Huiting Ma, Gary Moloney, Héctor A Velásquez García, Monica Sirski, Naveed Z Janjua, David Vickers, Tyler Williamson, Alan Katz, Kristy Yiu, Rafal Kustra, David L Buckeridge, Marc Brisson, Stefan D Baral, Sharmistha Mishra and Mathieu Maheu-Giroux
CMAJ February 14, 2022 194 (6) E195-E204; DOI: https://doi.org/10.1503/cmaj.211249
Yiqing Xia
Department of Epidemiology and Biostatistics (Xia, Buckeridge, Maheu-Giroux), School of Population and Global Health, McGill University, Montréal, Que.; MAP Centre for Urban Health Solutions (Xia, Ma, Moloney, Yiu, Mishra), St. Michael’s Hospital, Unity Health Toronto, Toronto, Ont.; School of Population and Public Health (Velásquez García, Janjua), University of British Columbia; British Columbia Centre for Disease Control (Velásquez García, Janjua), Vancouver, BC; Departments of Community Health Sciences and Family Medicine (Sirski, Katz), Rady Faculty of Health Sciences, University of Manitoba, Winnipeg, Man.; Department of Community Health Sciences (Vickers, Williamson) and Centre for Health Informatics (Williamson), University of Calgary, Calgary, Alta.; Dalla Lana School of Public Health (Kustra), University of Toronto, Toronto, Ont.; Département de médecine sociale et préventive (Brisson), Faculté de médecine, Université Laval, Québec, Que.; Department of Epidemiology (Baral), Johns Hopkins School of Public Health, Baltimore, Md.; Division of Infectious Diseases (Mishra), Department of Medicine, University of Toronto, Toronto, Ont.
  • Find this author on Google Scholar
  • Find this author on PubMed
  • Search for this author on this site
Huiting Ma
Department of Epidemiology and Biostatistics (Xia, Buckeridge, Maheu-Giroux), School of Population and Global Health, McGill University, Montréal, Que.; MAP Centre for Urban Health Solutions (Xia, Ma, Moloney, Yiu, Mishra), St. Michael’s Hospital, Unity Health Toronto, Toronto, Ont.; School of Population and Public Health (Velásquez García, Janjua), University of British Columbia; British Columbia Centre for Disease Control (Velásquez García, Janjua), Vancouver, BC; Departments of Community Health Sciences and Family Medicine (Sirski, Katz), Rady Faculty of Health Sciences, University of Manitoba, Winnipeg, Man.; Department of Community Health Sciences (Vickers, Williamson) and Centre for Health Informatics (Williamson), University of Calgary, Calgary, Alta.; Dalla Lana School of Public Health (Kustra), University of Toronto, Toronto, Ont.; Département de médecine sociale et préventive (Brisson), Faculté de médecine, Université Laval, Québec, Que.; Department of Epidemiology (Baral), Johns Hopkins School of Public Health, Baltimore, Md.; Division of Infectious Diseases (Mishra), Department of Medicine, University of Toronto, Toronto, Ont.
  • Find this author on Google Scholar
  • Find this author on PubMed
  • Search for this author on this site
Gary Moloney
Department of Epidemiology and Biostatistics (Xia, Buckeridge, Maheu-Giroux), School of Population and Global Health, McGill University, Montréal, Que.; MAP Centre for Urban Health Solutions (Xia, Ma, Moloney, Yiu, Mishra), St. Michael’s Hospital, Unity Health Toronto, Toronto, Ont.; School of Population and Public Health (Velásquez García, Janjua), University of British Columbia; British Columbia Centre for Disease Control (Velásquez García, Janjua), Vancouver, BC; Departments of Community Health Sciences and Family Medicine (Sirski, Katz), Rady Faculty of Health Sciences, University of Manitoba, Winnipeg, Man.; Department of Community Health Sciences (Vickers, Williamson) and Centre for Health Informatics (Williamson), University of Calgary, Calgary, Alta.; Dalla Lana School of Public Health (Kustra), University of Toronto, Toronto, Ont.; Département de médecine sociale et préventive (Brisson), Faculté de médecine, Université Laval, Québec, Que.; Department of Epidemiology (Baral), Johns Hopkins School of Public Health, Baltimore, Md.; Division of Infectious Diseases (Mishra), Department of Medicine, University of Toronto, Toronto, Ont.
  • Find this author on Google Scholar
  • Find this author on PubMed
  • Search for this author on this site
Héctor A Velásquez García
Department of Epidemiology and Biostatistics (Xia, Buckeridge, Maheu-Giroux), School of Population and Global Health, McGill University, Montréal, Que.; MAP Centre for Urban Health Solutions (Xia, Ma, Moloney, Yiu, Mishra), St. Michael’s Hospital, Unity Health Toronto, Toronto, Ont.; School of Population and Public Health (Velásquez García, Janjua), University of British Columbia; British Columbia Centre for Disease Control (Velásquez García, Janjua), Vancouver, BC; Departments of Community Health Sciences and Family Medicine (Sirski, Katz), Rady Faculty of Health Sciences, University of Manitoba, Winnipeg, Man.; Department of Community Health Sciences (Vickers, Williamson) and Centre for Health Informatics (Williamson), University of Calgary, Calgary, Alta.; Dalla Lana School of Public Health (Kustra), University of Toronto, Toronto, Ont.; Département de médecine sociale et préventive (Brisson), Faculté de médecine, Université Laval, Québec, Que.; Department of Epidemiology (Baral), Johns Hopkins School of Public Health, Baltimore, Md.; Division of Infectious Diseases (Mishra), Department of Medicine, University of Toronto, Toronto, Ont.
  • Find this author on Google Scholar
  • Find this author on PubMed
  • Search for this author on this site
Monica Sirski
Department of Epidemiology and Biostatistics (Xia, Buckeridge, Maheu-Giroux), School of Population and Global Health, McGill University, Montréal, Que.; MAP Centre for Urban Health Solutions (Xia, Ma, Moloney, Yiu, Mishra), St. Michael’s Hospital, Unity Health Toronto, Toronto, Ont.; School of Population and Public Health (Velásquez García, Janjua), University of British Columbia; British Columbia Centre for Disease Control (Velásquez García, Janjua), Vancouver, BC; Departments of Community Health Sciences and Family Medicine (Sirski, Katz), Rady Faculty of Health Sciences, University of Manitoba, Winnipeg, Man.; Department of Community Health Sciences (Vickers, Williamson) and Centre for Health Informatics (Williamson), University of Calgary, Calgary, Alta.; Dalla Lana School of Public Health (Kustra), University of Toronto, Toronto, Ont.; Département de médecine sociale et préventive (Brisson), Faculté de médecine, Université Laval, Québec, Que.; Department of Epidemiology (Baral), Johns Hopkins School of Public Health, Baltimore, Md.; Division of Infectious Diseases (Mishra), Department of Medicine, University of Toronto, Toronto, Ont.
  • Find this author on Google Scholar
  • Find this author on PubMed
  • Search for this author on this site
Naveed Z Janjua
Department of Epidemiology and Biostatistics (Xia, Buckeridge, Maheu-Giroux), School of Population and Global Health, McGill University, Montréal, Que.; MAP Centre for Urban Health Solutions (Xia, Ma, Moloney, Yiu, Mishra), St. Michael’s Hospital, Unity Health Toronto, Toronto, Ont.; School of Population and Public Health (Velásquez García, Janjua), University of British Columbia; British Columbia Centre for Disease Control (Velásquez García, Janjua), Vancouver, BC; Departments of Community Health Sciences and Family Medicine (Sirski, Katz), Rady Faculty of Health Sciences, University of Manitoba, Winnipeg, Man.; Department of Community Health Sciences (Vickers, Williamson) and Centre for Health Informatics (Williamson), University of Calgary, Calgary, Alta.; Dalla Lana School of Public Health (Kustra), University of Toronto, Toronto, Ont.; Département de médecine sociale et préventive (Brisson), Faculté de médecine, Université Laval, Québec, Que.; Department of Epidemiology (Baral), Johns Hopkins School of Public Health, Baltimore, Md.; Division of Infectious Diseases (Mishra), Department of Medicine, University of Toronto, Toronto, Ont.
  • Find this author on Google Scholar
  • Find this author on PubMed
  • Search for this author on this site
David Vickers
Department of Epidemiology and Biostatistics (Xia, Buckeridge, Maheu-Giroux), School of Population and Global Health, McGill University, Montréal, Que.; MAP Centre for Urban Health Solutions (Xia, Ma, Moloney, Yiu, Mishra), St. Michael’s Hospital, Unity Health Toronto, Toronto, Ont.; School of Population and Public Health (Velásquez García, Janjua), University of British Columbia; British Columbia Centre for Disease Control (Velásquez García, Janjua), Vancouver, BC; Departments of Community Health Sciences and Family Medicine (Sirski, Katz), Rady Faculty of Health Sciences, University of Manitoba, Winnipeg, Man.; Department of Community Health Sciences (Vickers, Williamson) and Centre for Health Informatics (Williamson), University of Calgary, Calgary, Alta.; Dalla Lana School of Public Health (Kustra), University of Toronto, Toronto, Ont.; Département de médecine sociale et préventive (Brisson), Faculté de médecine, Université Laval, Québec, Que.; Department of Epidemiology (Baral), Johns Hopkins School of Public Health, Baltimore, Md.; Division of Infectious Diseases (Mishra), Department of Medicine, University of Toronto, Toronto, Ont.
  • Find this author on Google Scholar
  • Find this author on PubMed
  • Search for this author on this site
Tyler Williamson
Department of Epidemiology and Biostatistics (Xia, Buckeridge, Maheu-Giroux), School of Population and Global Health, McGill University, Montréal, Que.; MAP Centre for Urban Health Solutions (Xia, Ma, Moloney, Yiu, Mishra), St. Michael’s Hospital, Unity Health Toronto, Toronto, Ont.; School of Population and Public Health (Velásquez García, Janjua), University of British Columbia; British Columbia Centre for Disease Control (Velásquez García, Janjua), Vancouver, BC; Departments of Community Health Sciences and Family Medicine (Sirski, Katz), Rady Faculty of Health Sciences, University of Manitoba, Winnipeg, Man.; Department of Community Health Sciences (Vickers, Williamson) and Centre for Health Informatics (Williamson), University of Calgary, Calgary, Alta.; Dalla Lana School of Public Health (Kustra), University of Toronto, Toronto, Ont.; Département de médecine sociale et préventive (Brisson), Faculté de médecine, Université Laval, Québec, Que.; Department of Epidemiology (Baral), Johns Hopkins School of Public Health, Baltimore, Md.; Division of Infectious Diseases (Mishra), Department of Medicine, University of Toronto, Toronto, Ont.
  • Find this author on Google Scholar
  • Find this author on PubMed
  • Search for this author on this site
Alan Katz
Department of Epidemiology and Biostatistics (Xia, Buckeridge, Maheu-Giroux), School of Population and Global Health, McGill University, Montréal, Que.; MAP Centre for Urban Health Solutions (Xia, Ma, Moloney, Yiu, Mishra), St. Michael’s Hospital, Unity Health Toronto, Toronto, Ont.; School of Population and Public Health (Velásquez García, Janjua), University of British Columbia; British Columbia Centre for Disease Control (Velásquez García, Janjua), Vancouver, BC; Departments of Community Health Sciences and Family Medicine (Sirski, Katz), Rady Faculty of Health Sciences, University of Manitoba, Winnipeg, Man.; Department of Community Health Sciences (Vickers, Williamson) and Centre for Health Informatics (Williamson), University of Calgary, Calgary, Alta.; Dalla Lana School of Public Health (Kustra), University of Toronto, Toronto, Ont.; Département de médecine sociale et préventive (Brisson), Faculté de médecine, Université Laval, Québec, Que.; Department of Epidemiology (Baral), Johns Hopkins School of Public Health, Baltimore, Md.; Division of Infectious Diseases (Mishra), Department of Medicine, University of Toronto, Toronto, Ont.
  • Find this author on Google Scholar
  • Find this author on PubMed
  • Search for this author on this site
Kristy Yiu
Department of Epidemiology and Biostatistics (Xia, Buckeridge, Maheu-Giroux), School of Population and Global Health, McGill University, Montréal, Que.; MAP Centre for Urban Health Solutions (Xia, Ma, Moloney, Yiu, Mishra), St. Michael’s Hospital, Unity Health Toronto, Toronto, Ont.; School of Population and Public Health (Velásquez García, Janjua), University of British Columbia; British Columbia Centre for Disease Control (Velásquez García, Janjua), Vancouver, BC; Departments of Community Health Sciences and Family Medicine (Sirski, Katz), Rady Faculty of Health Sciences, University of Manitoba, Winnipeg, Man.; Department of Community Health Sciences (Vickers, Williamson) and Centre for Health Informatics (Williamson), University of Calgary, Calgary, Alta.; Dalla Lana School of Public Health (Kustra), University of Toronto, Toronto, Ont.; Département de médecine sociale et préventive (Brisson), Faculté de médecine, Université Laval, Québec, Que.; Department of Epidemiology (Baral), Johns Hopkins School of Public Health, Baltimore, Md.; Division of Infectious Diseases (Mishra), Department of Medicine, University of Toronto, Toronto, Ont.
  • Find this author on Google Scholar
  • Find this author on PubMed
  • Search for this author on this site
Rafal Kustra
Department of Epidemiology and Biostatistics (Xia, Buckeridge, Maheu-Giroux), School of Population and Global Health, McGill University, Montréal, Que.; MAP Centre for Urban Health Solutions (Xia, Ma, Moloney, Yiu, Mishra), St. Michael’s Hospital, Unity Health Toronto, Toronto, Ont.; School of Population and Public Health (Velásquez García, Janjua), University of British Columbia; British Columbia Centre for Disease Control (Velásquez García, Janjua), Vancouver, BC; Departments of Community Health Sciences and Family Medicine (Sirski, Katz), Rady Faculty of Health Sciences, University of Manitoba, Winnipeg, Man.; Department of Community Health Sciences (Vickers, Williamson) and Centre for Health Informatics (Williamson), University of Calgary, Calgary, Alta.; Dalla Lana School of Public Health (Kustra), University of Toronto, Toronto, Ont.; Département de médecine sociale et préventive (Brisson), Faculté de médecine, Université Laval, Québec, Que.; Department of Epidemiology (Baral), Johns Hopkins School of Public Health, Baltimore, Md.; Division of Infectious Diseases (Mishra), Department of Medicine, University of Toronto, Toronto, Ont.
  • Find this author on Google Scholar
  • Find this author on PubMed
  • Search for this author on this site
David L Buckeridge
Department of Epidemiology and Biostatistics (Xia, Buckeridge, Maheu-Giroux), School of Population and Global Health, McGill University, Montréal, Que.; MAP Centre for Urban Health Solutions (Xia, Ma, Moloney, Yiu, Mishra), St. Michael’s Hospital, Unity Health Toronto, Toronto, Ont.; School of Population and Public Health (Velásquez García, Janjua), University of British Columbia; British Columbia Centre for Disease Control (Velásquez García, Janjua), Vancouver, BC; Departments of Community Health Sciences and Family Medicine (Sirski, Katz), Rady Faculty of Health Sciences, University of Manitoba, Winnipeg, Man.; Department of Community Health Sciences (Vickers, Williamson) and Centre for Health Informatics (Williamson), University of Calgary, Calgary, Alta.; Dalla Lana School of Public Health (Kustra), University of Toronto, Toronto, Ont.; Département de médecine sociale et préventive (Brisson), Faculté de médecine, Université Laval, Québec, Que.; Department of Epidemiology (Baral), Johns Hopkins School of Public Health, Baltimore, Md.; Division of Infectious Diseases (Mishra), Department of Medicine, University of Toronto, Toronto, Ont.
  • Find this author on Google Scholar
  • Find this author on PubMed
  • Search for this author on this site
Marc Brisson
Department of Epidemiology and Biostatistics (Xia, Buckeridge, Maheu-Giroux), School of Population and Global Health, McGill University, Montréal, Que.; MAP Centre for Urban Health Solutions (Xia, Ma, Moloney, Yiu, Mishra), St. Michael’s Hospital, Unity Health Toronto, Toronto, Ont.; School of Population and Public Health (Velásquez García, Janjua), University of British Columbia; British Columbia Centre for Disease Control (Velásquez García, Janjua), Vancouver, BC; Departments of Community Health Sciences and Family Medicine (Sirski, Katz), Rady Faculty of Health Sciences, University of Manitoba, Winnipeg, Man.; Department of Community Health Sciences (Vickers, Williamson) and Centre for Health Informatics (Williamson), University of Calgary, Calgary, Alta.; Dalla Lana School of Public Health (Kustra), University of Toronto, Toronto, Ont.; Département de médecine sociale et préventive (Brisson), Faculté de médecine, Université Laval, Québec, Que.; Department of Epidemiology (Baral), Johns Hopkins School of Public Health, Baltimore, Md.; Division of Infectious Diseases (Mishra), Department of Medicine, University of Toronto, Toronto, Ont.
  • Find this author on Google Scholar
  • Find this author on PubMed
  • Search for this author on this site
Stefan D Baral
Department of Epidemiology and Biostatistics (Xia, Buckeridge, Maheu-Giroux), School of Population and Global Health, McGill University, Montréal, Que.; MAP Centre for Urban Health Solutions (Xia, Ma, Moloney, Yiu, Mishra), St. Michael’s Hospital, Unity Health Toronto, Toronto, Ont.; School of Population and Public Health (Velásquez García, Janjua), University of British Columbia; British Columbia Centre for Disease Control (Velásquez García, Janjua), Vancouver, BC; Departments of Community Health Sciences and Family Medicine (Sirski, Katz), Rady Faculty of Health Sciences, University of Manitoba, Winnipeg, Man.; Department of Community Health Sciences (Vickers, Williamson) and Centre for Health Informatics (Williamson), University of Calgary, Calgary, Alta.; Dalla Lana School of Public Health (Kustra), University of Toronto, Toronto, Ont.; Département de médecine sociale et préventive (Brisson), Faculté de médecine, Université Laval, Québec, Que.; Department of Epidemiology (Baral), Johns Hopkins School of Public Health, Baltimore, Md.; Division of Infectious Diseases (Mishra), Department of Medicine, University of Toronto, Toronto, Ont.
  • Find this author on Google Scholar
  • Find this author on PubMed
  • Search for this author on this site
Sharmistha Mishra
Department of Epidemiology and Biostatistics (Xia, Buckeridge, Maheu-Giroux), School of Population and Global Health, McGill University, Montréal, Que.; MAP Centre for Urban Health Solutions (Xia, Ma, Moloney, Yiu, Mishra), St. Michael’s Hospital, Unity Health Toronto, Toronto, Ont.; School of Population and Public Health (Velásquez García, Janjua), University of British Columbia; British Columbia Centre for Disease Control (Velásquez García, Janjua), Vancouver, BC; Departments of Community Health Sciences and Family Medicine (Sirski, Katz), Rady Faculty of Health Sciences, University of Manitoba, Winnipeg, Man.; Department of Community Health Sciences (Vickers, Williamson) and Centre for Health Informatics (Williamson), University of Calgary, Calgary, Alta.; Dalla Lana School of Public Health (Kustra), University of Toronto, Toronto, Ont.; Département de médecine sociale et préventive (Brisson), Faculté de médecine, Université Laval, Québec, Que.; Department of Epidemiology (Baral), Johns Hopkins School of Public Health, Baltimore, Md.; Division of Infectious Diseases (Mishra), Department of Medicine, University of Toronto, Toronto, Ont.
  • Find this author on Google Scholar
  • Find this author on PubMed
  • Search for this author on this site
Mathieu Maheu-Giroux
Department of Epidemiology and Biostatistics (Xia, Buckeridge, Maheu-Giroux), School of Population and Global Health, McGill University, Montréal, Que.; MAP Centre for Urban Health Solutions (Xia, Ma, Moloney, Yiu, Mishra), St. Michael’s Hospital, Unity Health Toronto, Toronto, Ont.; School of Population and Public Health (Velásquez García, Janjua), University of British Columbia; British Columbia Centre for Disease Control (Velásquez García, Janjua), Vancouver, BC; Departments of Community Health Sciences and Family Medicine (Sirski, Katz), Rady Faculty of Health Sciences, University of Manitoba, Winnipeg, Man.; Department of Community Health Sciences (Vickers, Williamson) and Centre for Health Informatics (Williamson), University of Calgary, Calgary, Alta.; Dalla Lana School of Public Health (Kustra), University of Toronto, Toronto, Ont.; Département de médecine sociale et préventive (Brisson), Faculté de médecine, Université Laval, Québec, Que.; Department of Epidemiology (Baral), Johns Hopkins School of Public Health, Baltimore, Md.; Division of Infectious Diseases (Mishra), Department of Medicine, University of Toronto, Toronto, Ont.
  • Find this author on Google Scholar
  • Find this author on PubMed
  • Search for this author on this site
  • Article
  • Figures & Tables
  • Related Content
  • Responses
  • Metrics
  • PDF
Loading

Abstract

Background: Understanding inequalities in SARS-CoV-2 transmission associated with the social determinants of health could help the development of effective mitigation strategies that are responsive to local transmission dynamics. This study aims to quantify social determinants of geographic concentration of SARS-CoV-2 cases across 16 census metropolitan areas (hereafter, cities) in 4 Canadian provinces, British Columbia, Manitoba, Ontario and Quebec.

Methods: We used surveillance data on confirmed SARS-CoV-2 cases and census data for social determinants at the level of the dissemination area (DA). We calculated Gini coefficients to determine the overall geographic heterogeneity of confirmed cases of SARS-CoV-2 in each city, and calculated Gini covariance coefficients to determine each city’s heterogeneity by each social determinant (income, education, housing density and proportions of visible minorities, recent immigrants and essential workers). We visualized heterogeneity using Lorenz (concentration) curves.

Results: We observed geographic concentration of SARS-CoV-2 cases in cities, as half of the cumulative cases were concentrated in DAs containing 21%–35% of their population, with the greatest geographic heterogeneity in Ontario cities (Gini coefficients 0.32–0.47), followed by British Columbia (0.23–0.36), Manitoba (0.32) and Quebec (0.28–0.37). Cases were disproportionately concentrated in areas with lower income and educational attainment, and in areas with a higher proportion of visible minorities, recent immigrants, high-density housing and essential workers. Although a consistent feature across cities was concentration by the proportion of visible minorities, the magnitude of concentration by social determinant varied across cities.

Interpretation: Geographic concentration of SARS-CoV-2 cases was observed in all of the included cities, but the pattern by social determinants varied. Geographically prioritized allocation of resources and services should be tailored to the local drivers of inequalities in transmission in response to the resurgence of SARS-CoV-2.

The COVID-19 epidemic in Canada has varied in size and trajectory across provinces and large cities.1,2 At the national level3 and within regions,4,5 the burden of confirmed SARS-CoV-2 cases and severe COVID-19 outcomes has fallen disproportionately on socially and economically marginalized communities. 6 Social determinants of health refer to nonmedical factors influencing health outcomes, and structural determinants encompass cultural norms, policies and institutions that generate social stratification and determine socioeconomic position.7,8 In Canada and elsewhere, data have consistently highlighted the importance of determinants such as household size and density, work in essential services and structural racism (measured by proxy) in the relative risk of COVID-19.9–17

Understanding the factors associated with geographic patterns of transmission within cities can help identify the populations and, specifically, the contexts with the greatest risks. Geographic analyses can enable better allocation of resources, tailoring of policies and implementation of context-specific strategies to more effectively and efficiently curb local transmission. 18 Although respiratory virus transmission is often geographically clustered within a city,19 the early public health response to SARS-CoV-2 transmission in Canada did little to take within-city clustering into account.20,21 Similarly, few studies have quantified and compared the geographic concentration of SARS-CoV-2 cases by social determinants across Canada, and the extent to which the magnitude of inequalities might vary among cities and provinces.19,22 We therefore sought to quantify and compare the magnitude of geographic concentration of SARS-CoV-2 cases by area-level social determinants of health across metropolitan areas in British Columbia, Manitoba, Ontario and Quebec, Canada.

Methods

Study design and study population

We conducted a cross-sectional study using SARS-CoV-2 surveillance data from Jan. 23, 2020 (report date of the first documented case in Canada), to Feb. 28, 2021. We included 4 provinces, British Columbia, Manitoba, Ontario and Quebec, as these provinces had data available at the level of the dissemination area (DA), which is the smallest standard geographic unit with census information, representing 400–700 residents.23 Together these provinces accounted for 81% of SARS-CoV-2 cases in Canada by Feb. 28, 2021.24 Specifically, we included data from up to 6 of the largest census metropolitan areas (hereafter, cities) in each province. In BC, we excluded Victoria because it of its low cumulative case count. In Manitoba, only Winnipeg is qualified as a city by census definition.25

Given the unique context of transmission in long-term care homes, we excluded cases among their residents to focus on transmission dynamics in the community.

Data sources

We used individual-level data from provincial surveillance databases to calculate the number of SARS-CoV-2 cases per DA. In BC, confirmed cases are recorded in the Public Health Reporting Data Warehouse.26 In Manitoba, the COVID-19 surveillance data and contact investigation information were requested through the Manitoba Population Research Data Repository.27 In Ontario, data on laboratory-confirmed cases were recorded in the province’s case and contact management system.28 In Quebec, confirmed cases were recorded in the Trajectoire de santé publique database.29 For each confirmed case, basic sociodemographic information was collected (e.g., address) by the relevant public health authorities, in addition to epidemiological characteristics such as date of case report and living environment (e.g., long-term care facility). We assigned cases to a DA according to the residential address using the Postal Code Conversion File.30

We extracted data describing DA-level social determinants of health, with the exception of income, from the latest available Canadian Census (2016),31 which represents the most complete, comparable and representative source of area-level characteristics of the population in each city.32 We obtained the DA-level after-tax income from the Postal Code Conversion File Plus Version 7A/7D for each province.33 This variable is generated by Statistics Canada using administrative data sources and captures household size to generate a per-person equivalent measure.34

Measures

We defined SARS-CoV-2 cases as those confirmed by laboratory testing using the polymerase chain reaction.35 For Quebec, we also included cases confirmed by epidemiological link (i.e., individuals with COVID-19 symptoms without other apparent cause that had a close contact with a laboratory-confirmed case),36 given the lack of testing capacity during the first wave in February to April 2020. We considered measures of social determinants of SARS-CoV-2 transmission based on previous studies that conceptualized factors as they related to contact rates and types of potential exposures for transmission.19,37,38 These included sociodemographic indices (after-tax income per-person equivalent; proportion of population without certificate, diploma or degree; and proxies for systemic racism, namely the proportions of self-reported visible minorities39,40 and of recent immigrants),17,18,38 dwelling-related indicators (proportion of population not living in high-density housing)9,13 and occupation-related variables (proportion of population working in essential services, conceptualized using national occupation classifications41 that would be least amenable to remote work,42,43 namely, health; trades, transport and equipment operation; sales and services; manufacturing and utilities; and resources, agriculture and production).16 We ranked determinants from the highest value to the lowest and grouped them into 10 deciles within each city. Appendix 1, Table S1, available at www.cmaj.ca/lookup/doi/10.1503/cmaj.211249/tab-related-content details the definitions of each variable.

Statistical analysis

We aggregated the cumulative numbers of confirmed SARS-CoV-2 cases to the DA level, along with population denominators and social determinants. First, we quantified the magnitude of overall geographical heterogeneity within each city using Gini coefficients and crude Lorenz curves. These nonparametric methods allow for straightforward quantification and visualization of within-city inequalities.44 Second, we quantified the extent to which cases were concentrated by each social determinant using Gini covariance (co-Gini) coefficients and concentration curves.45 To generate the curves, we plotted the cumulative proportion of a city’s population, ranked by number of SARS-CoV-2 cases and by each social determinant on the X axis, with the corresponding cumulative proportion of SARS-CoV-2 cases on the Y axis.46 The Lorenz (concentration) curves depict a diagonal line of equality, and the further the data deviate from the diagonal, the higher the variability (i.e., greater inequality or concentration) in cases across the population. We calculated the Gini and co-Gini coefficients as twice the area between the Lorenz curve and the line of equality.47 Values closer to 1 reflect greater inequality, and those closer to 0 represent uniform distributions.48 The methods we adopted are appropriate to evaluate inequalities within each city under contexts of varied distributions of social determinants and the health measures of SARS-CoV-2 transmission. Each provincial team conducted data management and analyses separately using standardized protocols and a shared code base. Aggregated results were shared across provincial teams as per the data privacy requirements of each province. All analyses were conducted using R statistical software.

Ethics approval

Ethics approvals were obtained from the University of British Columbia Research Ethics Board (H20-02097), the University of Manitoba Health Research Ethics Board (HS24140 [H2020:352]) and the Health Information Privacy Committee of the Government of Manitoba (No. 2020/2021-32), the University of Toronto Health Sciences Research Ethics Board (39253) and the Institutional Review Board of McGill University in Quebec (A06-M52-20B).

Results

During the study period, 62 709 (BC), 15 089 (Manitoba), 239 160 (Ontario) and 215 928 (Quebec) SARS-CoV-2 cases were recorded in the 16 cities included in the study (Table 1). These 16 cities accounted for 81%, 57%, 83% and 80% of all 78 322, 27 764, 287 606 and 268 789 confirmed cases in BC, Manitoba, Ontario and Quebec, respectively. Fewer than 6% of DAs recorded 0 cases during the study period.

View this table:
  • View inline
  • View popup
Table 1:

Characteristics of census metropolitan areas (cities) and dissemination areas (DAs) included in the study from Jan. 23, 2020, to Feb. 28, 202121

Overall heterogeneity

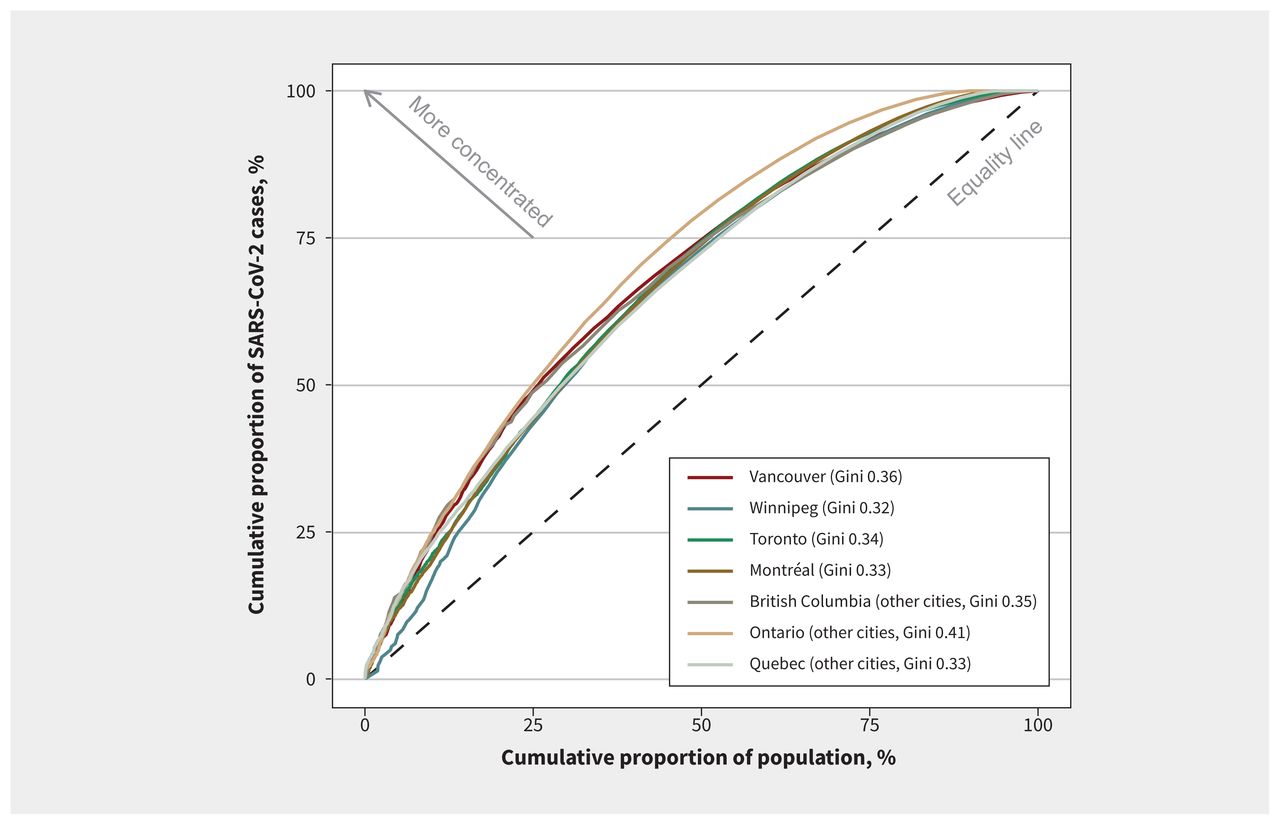
In each city, half of the cumulative SARS-CoV-2 cases were among people living in DAs that accounted for 21%–35% of their respective city’s population (Figure 1 and Table 1). The cities in Ontario generally exhibited the greatest within-city heterogeneity (Gini coefficients 0.32–0.47), followed by BC (Gini coefficients 0.23–0.36), Manitoba (Gini coefficient 0.31) and then Quebec (Gini coefficients 0.28–0.37). The magnitude of heterogeneity across cities varied within provinces. The largest and smallest Gini coefficients were observed, respectively, in Vancouver and Kelowna in BC, St. Catharines–Niagara and Hamilton in Ontario, and Saguenay and Trois-Rivières in Quebec. Lorenz curves and Gini coefficients for each city can be found in Table 2 and Appendix 2, Figure S1, available at www.cmaj.ca/lookup/doi/10.1503/cmaj.211249/tab-related-content.

Figure 1:
  • Download figure
  • Open in new tab
  • Download powerpoint
Figure 1:

Lorenz curves of the cumulative proportion of confirmed SARS-CoV-2 cases (excluding long-term care residents) by cumulative proportion of population in cities in British Columbia, Manitoba, Ontario and Quebec. The population was ranked by the number of cases in each dissemination area, from the highest to the lowest.

View this table:
  • View inline
  • View popup
Table 2:

Characteristics of social and structural determinants across all dissemination areas (DAs) of each city and the corresponding Gini and co-Gini coefficients of cumulative COVID-19 cases

Heterogeneity by social determinants

Nearly all cities had a concentration of cases according to the proportion of self-reported visible minorities (Figure 2). The distribution of all social determinants, co-Gini coefficients, the proportion of population and confirmed cases by social determinants and concentration curves for each city can be found in Table 2; Appendix 2, Figures S2 and S3; and Appendix 3, available at www.cmaj.ca/lookup/doi/10.1503/cmaj.211249/tab-related-content.

Figure 2:
  • Download figure
  • Open in new tab
  • Download powerpoint
Figure 2:

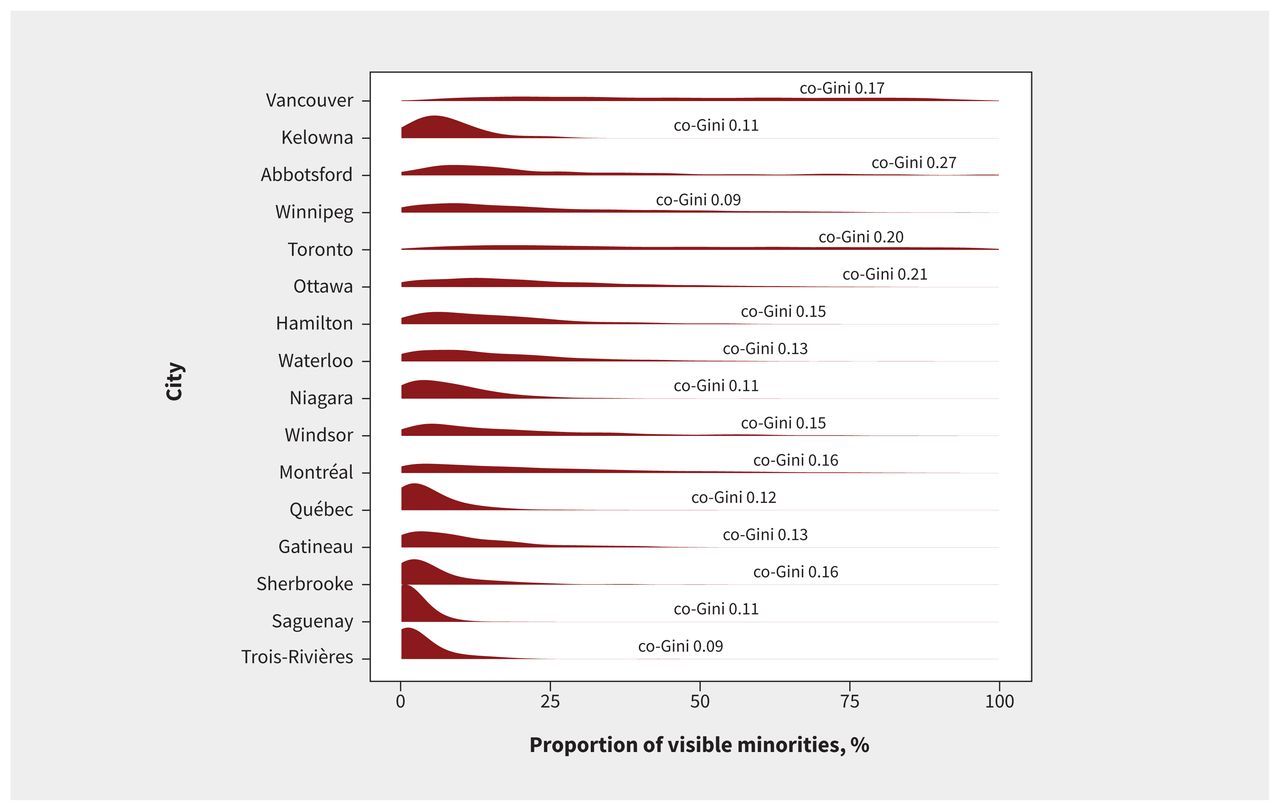
Distribution of proportion of visible minorities and Gini covariance coefficients by city. The curves (red) represent the density distributions of the dissemination area–level proportions of visible minorities for each census metropolitan area (i.e., city). Flatter curves indicate that the proportions of visible minorities by dissemination area are more evenly distributed over the 0%–100% range (e.g., Vancouver, Toronto, Montréal). Density distributions concentrated near 0% (to the left) show that most dissemination areas had low proportions of visible minorities (e.g., Saguenay, Trois-Rivières). For reference, the Gini covariance coefficients (co-Gini) are also displayed. These represent the degree of geographical concentration of SARS-CoV-2 cases by social determinant, with value closer to 1 reflecting greater inequality and values closer to 0 representing uniform distributions.

The distribution of the underlying social determinants was heterogeneous across cities. Larger cities usually had wider distributions of social determinants (Appendix 2, Figure S2). Cities with less variability in the social determinant tended to have a smaller co-Gini for that determinant. For example, Kelowna (co-Gini 0.07) had a narrow distribution for proportion of population not living in high-density housing, compared with Vancouver’s distribution for this variable (co-Gini 0.19; Appendix 2, Figure S2). Across all cities, SARS-CoV-2 cases were disproportionately concentrated in DAs with lower income, a higher proportion living in high-density housing, lower education attainment and higher proportions of visible minorities, recent immigrants and essential workers (Appendix 2, Figure S3). Concentration of SARS-CoV-2 cases by visible minority was the most consistent finding in each city, with variability in other inequalities across cities. The largest co-Gini coefficients by social determinants were 0.19 for income, in Ottawa; 0.24 for educational attainment, in Vancouver; 0.27, 0.23 and 0.21 for proportions of visible minorities, recent immigrants and population not living in high-density housing, respectively, in Abbotsford–Mission; and 0.25 for proportion of essential workers, in Vancouver (Table 2). In Winnipeg, after-tax income explained the most heterogeneity (co-Gini 0.13).

Among the 3 largest cities in Canada, the geographic concentration by social determinants was similar for Toronto and Vancouver, particularly with regard to the proportion of the poulation employed in essential services (co-Gini 0.24 in Toronto, co-Gini 0.25 in Vancouver). In contrast, although Montréal had similar overall heterogeneity (Gini 0.33) to Toronto (Gini 0.34) and Vancouver (Gini 0.36), we observed a different pattern of heterogeneity by social determinant. In Montréal, the largest co-Gini was observed for the proportion of visible minorities (co-Gini 0.16).

Interpretation

This study provides comprehensive and robust evidence of high geographic concentration of SARS-CoV-2 cases within Canadian cities in BC, Manitoba, Ontario and Quebec. These hotspots are largely defined along social determinants related to occupation, income, housing and proxies for structural racism. Although the degree of geographical heterogeneity was relatively similar across cities, and a consistent theme across cities was the concentration of cases by the proportion of visible minorities, the degree of concentration by social determinants differed across cities.

These findings have 2 important implications for public health. First, given that each city showed geographic concentrations of SARS-CoV-2 cases — with 21%–35% of the cities’ populations residing in DAs accounting for 50% of cases — prioritizing and allocating resources to geographic hotspots could lead to a more effective and efficient response to the pandemic, and reduce inequalities,49 especially in the context of limited resources. An example of a hotspot-targeted strategy has been that of vaccination roll-out in some jurisdictions,50 but this type of geographically prioritized approach could also be systematically applied to ensure timely access to testing, support for isolation and quarantine of contacts. Indeed, data suggest that the absence of a systematic and intentional hotspot- and community-tailored strategy has meant that both testing and vaccination coverage were lowest in geographic hotspots50,51 and among racialized communities38 in Canada and other high-income countries.44,52

The second implication relates to the concentration of SARS-CoV-2 cases by social determinants of health. In each city, cases were concentrated across each determinant, but the magnitude of concentration by determinant differed among cities. That is, cities may differ with respect to which determinants were most associated with geographic clustering of SARS-CoV-2 cases. Each city would therefore benefit from tailoring its geographically prioritized strategy to its local social and structural determinants of heterogeneity. For example, the distribution of DA-level proportions of essential workers in Montréal, Vancouver and Toronto was similar, but the co-Gini in Montréal was much lower than in the other 2 cities. This suggests that the underlying context for hotspots (e.g., policies for sick leave)53 may be different and signal different unmet needs of the people who disproportionately shouldered the burden of the pandemic. Thus, using city-specific spatial clustering of cases by social determinants to guide the local response could lead to the more equitable allocation of resources and better access to interventions by providing services that actually meet the needs of communities at disproportionate risk. Such an approach may become even more important in the context of appropriately addressing the needs of unvaccinated pockets of contact networks,54 and with increasingly transmissible variants of SARS-CoV-2.55

Our results are consistent with the sociogeographic clustering patterns observed in other studies from Canada,38,55,56 the United States57–59 and Sweden.60 Higher rates of SARS-CoV-2 cases among racialized communities or neighbourhoods with greater diversity have been a consistent finding across countries, and reflect the products of systemic racism, including occupational exposure risks and barriers to prevention61 and access to effective isolation.62–64 In a previous study of the first wave of COVID-19 in Ontario, the association between area-level proxies of systemic racism (e.g., proportion of visible minorities) and SARS-CoV-2 cases was no longer present after adjusting for other relevant explanatory factors, including occupation, household size and income.38 Clustering of cases in the context of essential services may reflect type and rates of contacts, sometimes without occupational protections and access to safe working environments.65,66 Similarly, income, occupation and educational attainment are often correlated, with the latter further associated with barriers in access to health information and health care, including prevention.67,68 Meanwhile, high-density households represent a barrier to physical distancing and effective isolation or quarantine.69 Importantly, these determinants are often correlated,70,71 which likely means that the distribution of certain determinants and cases have a similar explanatory pathway, especially in the relation between income and cases, and proxies of systemic racism and cases.37 Taken together, the concentration of cases by social determinants reflects plausible mechanistic pathways for population-level transmission and, as such, the local contexts that contribute to hotspots under broad stay-at-home policies in each city.72

Our descriptive study did not include an explanatory set of analyses to evaluate sources of heterogeneity in co-Gini across cities. However, we note that the distribution of each social determinant varied among cities, as depicted in Appendix 2, Figure S2. When there is less variability of a given social determinant within a city, it consequently may be less of a determinant of geographic heterogeneity in SARS-CoV-2 cases. For example, the distribution of not living in high-density housing was more homogeneous in Kelowna than Vancouver, whereas the corresponding co-Gini was higher in Vancouver. As such, the levels of geographic concentration of cases by social determinants among cities may also vary because of differences in the underlying degree of homogeneity or heterogeneity for the determinants.

Limitations

Limitations of our study include our use of observed cases reported by provincial surveillance systems. We could have underestimated the co-Gini if testing rates were lower among marginalized communities.38 Testing capacity constraints were especially salient in the first wave of the pandemic, likely contributing to under-reporting of cases.73–75 Although we excluded residents of long-term care homes, our definition of community-wide cases could still include other congregate settings such as shelters and group homes, reflecting other unmeasured social determinants that could lead to geographic concentration within cities. We extracted the DA-level social determinants from the most recent available census data from 2016, which may not accurately represent the characteristics of the population in 2020–2021. As individual-level data on social determinants for cases were not available, we conducted our unit of analysis at the smallest area (DA) possible to limit misclassification in the context of an ecological study. Furthermore, in the few surveillance systems (e.g., Ontario) where individual-level data on some social determinants were collected and were available, and despite about 50% data missingness in this individual-level data, the pattern and magnitude of findings were similar to the DA-level findings.76,77 We limited the descriptive study to a cross-sectional analysis of each social determinant separately. Future work should evaluate sources of differences in the magnitude of inequalities or concentration in cases among cities (e.g., underlying differences in distribution of social determinants, the application of interventions), over time (to evaluate longitudinal patterns of heterogeneities over time and in each wave), with mediation or explanatory modelling of pathways to further explore the clustering of cases. Future research could also develop a composite measure of social determinants56 or use multivariable analyses, given the potential for differential correlation between social determinants in each city.19

Conclusion

Geographic hotspots have been a consistent feature of the COVID-19 pandemic across major urban centres in BC, Manitoba, Ontario and Quebec. The pattern of concentration of SARS-CoV-2 cases and, thus, inequalities by social determinants varied among cities. Geographically prioritized allocation of resources and services that are tailored to the local drivers of inequalities in acquisition and transmission risk offer a path forward in the public health response to SARS-CoV-2.

Acknowledgements

The authors thank Andrew Calzavera for outlining the approach to generating the income variable and Dr. Sharon Straus, Dr. Jeff Kwong, and Dr. Maria Sunderam for helpful discussions. The analyses, conclusions, opinions and statements expressed herein are solely those of the authors and do not reflect those of the funding or data sources; no endorsement is intended or should be inferred.

Footnotes

  • Competing interests: Alan Katz is president of the Canadian Association for Health Services and Policy Research, and sits on the board of the College of Family Physicians of Canada and the international advisory board of SAIL Databank. He also reports grants from the Canadian Institutes of Health Research (CIHR), outside the submitted work. Marc Brisson reports grants from CIHR and the Institut national de santé publique du Québec (INSPQ), outside the submitted work. Mathieu Maheu-Giroux reports a research grant from Gilead Sciences Inc., and contractual agreements with the World Health Organization, the Joint United Nations Programme on HIV/AIDS INSPQ and the Institut d’excellence en santé et en services sociaux, outside the submitted work. No other competing interests were declared.

  • This article has been peer reviewed.

  • Contributors: Yiqing Xia, Huiting Ma, Gary Moloney, Stefan Baral, Sharmishtha Mishra and Mathieu Maheu-Giroux conceived of and designed the study. Yiqing Xia and Huiting Ma developed the analysis plan, wrote the code and coordinated code sharing across provincial teams. All authors contributed to data acquisition. Yiqing Xia, Huiting Ma, Héctor Velásquez García and Monica Sirski conducted the data analysis. Naveed Janjua, David Vickers, Tyler Williamson, Alan Katz, Kristy Yiu, Rafal Kustra, David Buckeridge, Marc Brisson, Sharmistha Mishra and Mathieu Maheu-Giroux interpreted data. Yiqing Xia drafted the manuscript. All of the authors revised it critically for important intellectual content, gave final approval of the version to be published and agreed to be accountable for all aspects of the work.

  • Funding: This work was supported by the Canadian Institutes of Health Research (VR5-172683). The authors acknowledge financial support from the McGill Interdisciplinary Initiative in Infection and Immunity (Mathieu Maheu-Giroux), with seed funding from the McGill University Health Centre Foundation. Mathieu Maheu-Giroux’s research program is supported by a Canada Research Chair (Tier 2) in Population Health Modeling. Sharmistha Mishra’s research program is supported by a Canada Research Chair (Tier 2) in Mathematical Modeling and Program Science.

  • Data sharing: All data related to SARS-CoV-2 cases used in this study are not available to public. Census Canada 2016 data can be downloaded from the Statistics Canada website; the Postal Code Conversion File may be accessed through the Data Liberation Initiative partnership between postsecondary institutions and Statistics Canada.

  • Disclaimer: In Ontario, the reported SARS-CoV-2 cases were obtained from the provincial Case and Contact Management data as part of the Public Health Ontario Integrated Public Health Information System via the Ontario COVID-19 Modelling Consensus Table. The data were made available by the Ontario Ministry of Health to the Ontario Modelling Consensus Table on a daily basis. The authors acknowledge the Manitoba Centre for Health Policy (MCHP) for use of data contained in the Manitoba Population Research Data Repository under project 2020-046 (HIPC No. 2020/2021-32). Data used in this study came from this repository which is housed at the MCHP, University of Manitoba and were derived from data provided by Manitoba Health, Seniors and Active Living, Winnipeg Regional Health Authority and Statistics Canada. They also acknowledge the assistance of the BC Centre for Disease Control, BC Ministry of Health and Regional Health Authority staff involved in data access, procurement, and management of case data in British Columbia. All inferences, opinions and conclusions drawn in this report are those of the authors, and do not reflect the opinions or policies of the data stewards.

  • Accepted January 7, 2022.

This is an Open Access article distributed in accordance with the terms of the Creative Commons Attribution (CC BY-NC-ND 4.0) licence, which permits use, distribution and reproduction in any medium, provided that the original publication is properly cited, the use is noncommercial (i.e., research or educational use), and no modifications or adaptations are made. See: https://creativecommons.org/licenses/by-nc-nd/4.0/

References

  1. ↵
    COVID-19 daily epidemiology update. Ottawa: Government of Canada; updated 2022 Jan. 7. Available: https://health-infobase.canada.ca/covid-19/epidemiological-summary-covid-19-cases.html (accessed 2021 July 18).
  2. ↵
    Public Health Infobase: data on COVID-19 in Canada. Ottawa: Public Health Agency of Canada; 2020. Available: https://open.canada.ca/data/en/dataset/261c32ab-4cfd-4f81-9dea-7b64065690dc (accessed 2021 July 18).
  3. ↵
    COVID-19 infections among healthcare workers and other people working in healthcare settings. Ottawa: Public Health Agency of Canada January; 2021. Available: https://www.canada.ca/en/public-health/services/diseases/coronavirus-disease-covid-19/epidemiological-economic-research-data/infections-healthcare-workers-other-people-working-healthcare-settings.html (accessed 2021 Mar. 12).
  4. ↵
    1. Sannigrahi S,
    2. Pilla F,
    3. Basu B,
    4. et al
    . Examining the association between sociodemographic composition and COVID-19 fatalities in the European region using spatial regression approach. Sustain Cities Soc 2020;62:102418.
    OpenUrlPubMed
  5. ↵
    1. Dolbeault J,
    2. Turinici G
    . Social heterogeneity and the COVID-19 lockdown in a multi-group SEIR model. Comput Math Biophys 2021;9:14–21.
    OpenUrl
  6. ↵
    1. Acharya R,
    2. Porwal A
    . A vulnerability index for the management of and response to the COVID-19 epidemic in India: an ecological study. Lancet Glob Health 2020;8:e1142–51.
    OpenUrl
  7. ↵
    1. Solar O,
    2. Irwin A
    . A conceptual framework for action on the social determinants of health. Social Determinants of Health Discussion Paper 2 (Policy and Practice). Geneva: World Health Organization; 2010.
  8. ↵
    1. Crear-Perry J,
    2. Correa-de-Araujo R,
    3. Lewis Johnson T,
    4. et al
    . Social and structural determinants of health inequities in maternal health. J Womens Health (Larchmt) 2021;30:230–5.
    OpenUrl
  9. ↵
    1. de Figueiredo AM,
    2. de Figueiredo DCMM,
    3. Gomes LB,
    4. et al
    . Social determinants of health and COVID-19 infection in Brazil: an analysis of the pandemic. Rev Bras Enferm 2020;73(Suppl 2):e20200673.
    OpenUrl
    1. Andersen LM,
    2. Harden SR,
    3. Sugg MM,
    4. et al
    . Analyzing the spatial determinants of local COVID-19 transmission in the United States. Sci Total Environ 2021;754:142396.
    OpenUrlPubMed
    1. Mollalo A,
    2. Vahedi B,
    3. Rivera KM
    . GIS-based spatial modeling of COVID-19 incidence rate in the continental United States. Sci Total Environ 2020;728:138884.
    OpenUrlCrossRef
    1. Abrams EM,
    2. Szefler SJ
    . COVID-19 and the impact of social determinants of health. Lancet Respir Med 2020;8:659–61.
    OpenUrlPubMed
  10. ↵
    1. Maroko AR,
    2. Nash D,
    3. Pavilonis BT
    . COVID-19 and inequity: a comparative spatial analysis of New York City and Chicago hot spots. J Urban Health 2020;97:461–70.
    OpenUrlCrossRefPubMed
    1. Takian A,
    2. Kiani MM,
    3. Khanjankhani K
    . COVID-19 and the need to prioritize health equity and social determinants of health. Int J Public Health 2020;65:521–3.
    OpenUrlPubMed
    1. Ramírez IJ,
    2. Lee J
    . COVID-19 emergence and social and health determinants in Colorado: a rapid spatial analysis. Int J Environ Res Public Health 2020;17:3856.
    OpenUrlCrossRef
  11. ↵
    1. Fielding-Miller RK,
    2. Sundaram ME,
    3. Brouwer K
    . Social determinants of COVID-19 mortality at the county level. PLoS One 2020;15:e0240151.
    OpenUrlCrossRef
  12. ↵
    1. Tai DBG,
    2. Shah A,
    3. Doubeni CA,
    4. et al
    . The disproportionate impact of COVID-19 on racial and ethnic minorities in the United States. Clin Infect Dis 2021;72:703–6.
    OpenUrlPubMed
  13. ↵
    1. Cordes J,
    2. Castro MC
    . Spatial analysis of COVID-19 clusters and contextual factors in New York City. Spat Spatiotemporal Epidemiol 2020;34:100355.
    OpenUrlCrossRefPubMed
  14. ↵
    1. Mishra S,
    2. Ma H,
    3. Moloney G,
    4. et al.
    COVID-19 Heterogeneity Research Group. Increasing concentration of COVID-19 by socioeconomic determinants and geography in Toronto, Canada: an observational study. Ann Epidemiol 2022;65:84–92.
    OpenUrl
  15. ↵
    1. Mishra S,
    2. Kwong JC,
    3. Chan AK,
    4. et al
    . Understanding heterogeneity to inform the public health response to COVID-19 in Canada. CMAJ 2020;192:E684–5.
    OpenUrlFREE Full Text
  16. ↵
    1. Mandhane R
    . OHRC statement: demographic data necessary to fight COVID-19. Toronto: Ontario Human Rights Commission (OHRC); 2020. Available: https://www.ohrc.on.ca/en/news_centre/ohrc-statement-demographic-data-necessary-fight-covid-19 (accessed 2021 Dec. 23).
  17. ↵
    1. Wang L,
    2. Ma H,
    3. Yiu KCY,
    4. et al
    . Heterogeneity in testing, diagnosis and outcome in SARS-CoV-2 infection across outbreak settings in the Greater Toronto Area, Canada: an observational study. CMAJ Open 2020;8:E627–36.
    OpenUrlAbstract/FREE Full Text
  18. ↵
    Dictionary, Census of Population, 2016: dissemination area (DA). Ottawa: Statistics Canada; 2016, modified 2019 Jan. 3. Available: https://www12.statcan.gc.ca/census-recensement/2016/ref/dict/geo021-eng.cfm (accessed 2021 Mar. 16).
  19. ↵
    COVID-19 daily epidemiology update. Ottawa: Statistics Canada; 2021. Available: https://health-infobase.canada.ca/covid-19/epidemiological-summary-covid-19-cases.html?stat=num&measure=total&map=pt#a2 (accessed 2021 Feb. 28).
  20. ↵
    Census metropolitan area (CMA) and census agglomeration (CA). Ottawa: Statistics Canada; 2018. Available: https://www150.statcan.gc.ca/n1/pub/92-195-x/2011001/geo/cma-rmr/cma-rmr-eng.htm (accessed 2021 Jul. 12).
  21. ↵
    Public health analytics. Vancouver: BC Centre for Disease Control; 2021. Available: http://www.bccdc.ca/our-services/service-areas/public-health-analytics (accessed 2021 July 10).
  22. ↵
    The Manitoba Population Research Data Repository. Winnipeg: Manitoba Centre for Health Policy; 2021. Available: https://umanitoba.ca/manitoba-centre-for-health-policy/data-repository (accessed 2021 July 10).
  23. ↵
    Management of cases and contacts of COVID-19 in Ontario. Toronto: Ontario Ministry of Health; 2021. Available: https://www.health.gov.on.ca/en/pro/programs/publichealth/coronavirus/docs/contact_mngmt/management_cases_contacts.pdf (accessed 2021 July 10).
  24. ↵
    Méthodologie des données COVID-19. Québec City: Institut national de santé publique du Québec; 2021. Available: https://www.inspq.qc.ca/covid-19/donnees/methodologie (accessed 2021 July 10).
  25. ↵
    Postal Code OM Conversion File. Ottawa: Statistics Canada. Cat no 92-154-X. Available: https://www150.statcan.gc.ca/n1/en/catalogue/92-154-X (accessed 2021 July 12).
  26. ↵
    Census Profile, 2016 Census. Ottawa: Statistics Canada; 2017, updated 2019 June 18. Available: https://www12.statcan.gc.ca/census-recensement/2016/dp-pd/prof/index.cfm?Lang=E (accessed 2021 July 10).
  27. ↵
    Guide to the Census of Population, 2016. Ottawa: Statistics Canada; 2017, updated 2020 Jan. 27. Available: https://www12.statcan.gc.ca/census-recensement/2016/ref/98-304/index-eng.cfm (accessed 2021 Dec. 9).
  28. ↵
    Postal Code Conversion File Plus (PCCF+) Version 7A & 7D. Ottawa: Statistics Canada; 2016. Cat no 82F0086X. Available: https://www150.statcan.gc.ca/n1/en/catalogue/82F0086X (accessed 2021 July 12).
  29. ↵
    2016 Census topic: income. Ottawa: Statistics Canada; 2017, updated 2019 Dec. 10. Available: https://www12.statcan.gc.ca/census-recensement/2016/rt-td/inc-rev-eng.cfm (accessed 2021 Dec. 9).
  30. ↵
    1. Shmerling RH
    . Which test is best for COVID-19? Boston: Harvard Health Publishing; 2021. Available: https://www.health.harvard.edu/blog/which-test-is-best-for-covid-19-2020081020734 (accessed 2021 July 10).
  31. ↵
    Coronavirus (COVID-19): définition de cas. Québec: Ministère de la Santé et des Services sociaux; updated 2021 July 22. Available: https://www.msss.gouv.qc.ca/professionnels/maladies-infectieuses/coronavirus-2019-ncov/ (accessed 2021 July 10).
  32. ↵
    The Lancet Respiratory Medicine. COVID-19 transmission: up in the air. Lancet Respir Med 2020;8:1159.
    OpenUrl
  33. ↵
    1. Sundaram ME,
    2. Calzavara A,
    3. Mishra S,
    4. et al
    . Individual and social determinants of SARS-CoV-2 testing and positivity in Ontario, Canada: a population-wide study. CMAJ 2021;193:E723–34.
    OpenUrlAbstract/FREE Full Text
  34. ↵
    1. Kaplan JB,
    2. Bennett T
    . Use of race and ethnicity in biomedical publication. JAMA 2003;289:2709–16.
    OpenUrlCrossRefPubMed
  35. ↵
    1. Flanagin A,
    2. Frey T,
    3. Christiansen SL
    ; AMA Manual of Style Committee. Updated guidance on the reporting of race and ethnicity in medical and science journals. JAMA 2021;326:621–7.
    OpenUrl
  36. ↵
    National Occupational Classification [main page]. Ottawa: Government of Canada; updated 2021 Oct. 20. Available: https://noc.esdc.gc.ca (accessed 2021 Nov. 5).
  37. ↵
    Guidance on essential services and functions in Canada during the COVID-19 pandemic. Ottawa: Public Safety Canada; updated 2021 Oct. 14. Available: https://www.publicsafety.gc.ca/cnt/ntnl-scrt/crtcl-nfrstrctr/esf-sfe-en.aspx (accessed 2021 Nov. 5).
  38. ↵
    1. Deng Z,
    2. Morissette R,
    3. Messacar D
    . Running the economy remotely: potential for working from home during and after COVID-19. Ottawa: Statistics Canada; modified 2020 May 28. Available: https://www150.statcan.gc.ca/n1/pub/45-28-0001/2020001/article/00026-eng.htm (accessed 2021 Nov. 5).
  39. ↵
    1. Mody A,
    2. Pfeifauf K,
    3. Geng EH
    . Using Lorenz curves to measure racial inequities in COVID-19 testing. JAMA Netw Open 2021;4:e2032696.
    OpenUrl
  40. ↵
    1. Yitzhaki S,
    2. Schechtman E
    . The Gini methodology: a primer on a statistical methodology. New York: Springer; 2013:1–548.
  41. ↵
    1. Kerani RP,
    2. Handcock MS,
    3. Handsfield HH,
    4. et al
    . Comparative geographic concentrations of 4 sexually transmitted infections. Am J Public Health 2005;95:324–30.
    OpenUrlCrossRefPubMed
  42. ↵
    1. Lee WC
    . Characterizing exposure-disease association in human populations using the Lorenz curve and Gini index. Stat Med 1997;16:729–39.
    OpenUrlCrossRefPubMed
  43. ↵
    1. Althaus CL,
    2. Turner KME,
    3. Schmid BV,
    4. et al
    . Transmission of Chlamydia trachomatis through sexual partnerships: a comparison between three individual-based models and empirical data. J R Soc Interface 2012;9:136–46.
    OpenUrlCrossRefPubMed
  44. ↵
    1. Thomas LJ,
    2. Huang P,
    3. Yin F,
    4. et al
    . Spatial heterogeneity can lead to substantial local variations in COVID-19 timing and severity. Proc Natl Acad Sci U S A 2020;117:24180–7.
    OpenUrlAbstract/FREE Full Text
  45. ↵
    1. Mishra S,
    2. Stall NM,
    3. Ma H,
    4. et al
    . A vaccination strategy for Ontario COVID-19 hotspots and essential workers. Ontario COVID-19 Science Advisory Table; 2021. Available: https://covid19-sciencetable.ca/sciencebrief/a-vaccination-strategy-for-ontario-covid-19-hotspots-and-essential-workers/ (accessed 2021 July 12).
  46. ↵
    1. Simon L,
    2. John H
    . Some of B.C.’s COVID hot spots also have the lowest vaccination rates, data shows. Global News 2021 May 12. Available: https://globalnews.ca/news/7856112/bc-hot-spot-vaccination-rate-data-covid/ (accessed 2021 July 9).
  47. ↵
    1. Paton J
    . U.K. vaccination rates struggle in places worst-hit by COVID-19. Bloomberg Equality 2021 Mar. 30. Available: https://www.bloomberg.com/news/features/2021-03-30/britain-s-ethnic-vaccine-gap-risks-more-covid-19-cases-deaths-in-deprived-areas (accessed 2021 July 12).
  48. ↵
    Questions and answers pertaining to employers and workers during the COVID-19 pandemic. Government du Québec; updated 2021 May 27. Available: https://www.quebec.ca/sante/problemes-de-sante/a-z/coronavirus-2019/sante-securite-milieu-travail/retour-travail-travailleurs-apres-isolement (accessed 2022 Jan. 18).
  49. ↵
    1. Jeyasundaram B
    Community ambassadors are the link to Toronto’s unvaccinated populations. The Local 2021 June 4. Available: https://thelocal.to/community-ambassadors-are-the-link-to-torontos-unvaccinated-populations/ (accessed 2021 July 12).
  50. ↵
    1. Chagla Z,
    2. Ma H,
    3. Sander B,
    4. et al
    . Characterizing the disproportionate burden of SARS-CoV-2 variants of concern among essential workers in the Greater Toronto Area, Canada. medRxiv 2021 Mar. 26. doi: 10.1101/2021.03.22.21254127.
    OpenUrlAbstract/FREE Full Text
  51. ↵
    Inégaux face à la pandémie: des écarts qui presistent. Government du Québec; updated 2021 Oct. 13. Available: https://santemontreal.qc.ca/fileadmin/fichiers/Campagnes/coronavirus/situation-montreal/point-sante/inegalites-montreal/Inegaux-Pandemie-EcartsQuiPersistent-FR.pdf (accessed 2022 Jan. 19).
  52. ↵
    1. Tirupathi R,
    2. Muradova V,
    3. Shekhar R,
    4. et al
    . COVID-19 disparity among racial and ethnic minorities in the US: a cross sectional analysis. Travel Med Infect Dis 2020;38:101904.
    OpenUrlPubMed
    1. Desmet K,
    2. Wacziarg R
    Understanding spatial variation in COVID-19 across the United States. J Urban Econ 2021 Mar. 11 [Epub ahead of print]. doi: 10.1016/j.jue.2021.103332.
    OpenUrlCrossRef
  53. ↵
    1. Rozenfeld Y,
    2. Beam J,
    3. Maier H,
    4. et al
    . A model of disparities: risk factors associated with COVID-19 infection. Int J Equity Health 2020;19:126.
    OpenUrlPubMed
  54. ↵
    1. Burström B,
    2. Tao W
    Social determinants of health and inequalities in COVID-19. Eur J Public Health 2020;30:617–8.
    OpenUrlCrossRefPubMed
  55. ↵
    1. Cevik M,
    2. Baral SD,
    3. Crozier A,
    4. et al
    . Support for self-isolation is critical in COVID-19 response. BMJ 2021;372.
  56. ↵
    1. Palameta B
    Low income among immigrants and visible minorities. Perspectives. Ottawa: Statistics Canada; 2004. Cat no 75-001-XIE. Available: https://citeseerx.ist.psu.edu/viewdoc/download?doi=10.1.1.583.8843&rep=rep1&type=pdf (accessed 2021 Mar. 22).
    1. Shommu NS,
    2. Ahmed S,
    3. Rumana N,
    4. et al
    . What is the scope of improving immigrant and ethnic minority healthcare using community navigators: a systematic scoping review. Int J Equity Health 2016;15:6.
    OpenUrlPubMed
  57. ↵
    1. Blakemore E
    Race and ethnicity: How are they different? Washington (DC): National Geographic; 2019. Available: https://www.nationalgeographic.com/culture/article/race-ethnicity (accessed 2021 Dec. 9).
  58. ↵
    1. Yearby R,
    2. Mohapatra S
    Structural discrimination in COVID-19 workplace protections [blog]. Health Aff (Millwood) 2020 May 29. Available: https://www.healthaffairs.org/do/10.1377/hblog20200522.280105/full/ (accessed 2021 July 12).
  59. ↵
    1. Saba R
    ‘It’s just a flu’: COVID prevention rules are often ignored on Toronto construction sites, workers tell the Star. Toronto Star 2021 Feb. 16. Available: https://www.thestar.com/business/2021/02/16/its-just-a-flu-covid-prevention-rules-are-often-ignored-on-sites-worried-construction-workers-tell-the-star.html (accessed 2021 July 12).
  60. ↵
    1. Thakur N,
    2. Lovinsky-Desir S,
    3. Bime C,
    4. et al
    . The structural and social determinants of the racial/ethnic disparities in the U.S. COVID-19 pandemic. What’s our role? Am J Respir Crit Care Med 2020;202:943–9.
    OpenUrlCrossRefPubMed
  61. ↵
    1. Berrigan D,
    2. Dodd K,
    3. Troiano RP,
    4. et al
    . Patterns of health behavior in U.S. adults. Prev Med 2003;36:615–23.
    OpenUrlCrossRefPubMed
  62. ↵
    1. Krieger N
    Structural racism, health inequities, and the two-edged sword of data: structural problems require structural solutions. Front Public Health 2021; 9:655447.
    OpenUrl
  63. ↵
    1. Mishra S,
    2. Ma H,
    3. Moloney G,
    4. et al.
    COVID-19 Heterogeneity Research Group. Increasing concentration of COVID-19 by socioeconomic determinants and geography in Toronto, Canada: an observational study. Ann Epidemiol 2022;65:84–92.
    OpenUrl
  64. ↵
    COVID-19: what We Know So Far About … social determinants of health. Toronto: Public Health Ontario; 2020. Available: https://www.publichealthontario.ca/-/media/documents/ncov/covid-wwksf/2020/05/what-we-know-social-determinants-health.pdf?la=en (accessed 2021 Dec. 9).
  65. ↵
    1. Braveman P,
    2. Gottlieb L
    The social determinants of health: it’s time to consider the causes of the causes. Public Health Rep 2014;129(Suppl 2):19–31.
    OpenUrlCrossRefPubMed
  66. ↵
    COVID-19: guidance for the health sector. Toronto: Ontario Ministry of Health; updated 2022 Jan. 5. Available: https://health.gov.on.ca/en/pro/programs/publichealth/coronavirus/2019_guidance.aspx#symptoms (accessed 2021 July 12).
  67. Testing for COVID-19. Gouvernement du Québec. Available: https://www.quebec.ca/en/health/health-issues/a-z/2019-coronavirus/testing-for-covid-19/ (accessed 2021 Mar. 23).
  68. ↵
    1. Godin A,
    2. Xia Y,
    3. Buckeridge DL,
    4. et al
    . The role of case importation in explaining differences in early SARS-CoV-2 transmission dynamics in Canada: a mathematical modeling study of surveillance data. Int J Infect Dis 2021;102:254–9.
    OpenUrlCrossRef
  69. ↵
    1. McKenzie K,
    2. Dube S,
    3. Petersen S
    Tracking COVID-19 through race-based data. Toronto: Ontario Health; 2021. Available: https://www.wellesleyinstitute.com/publications/tracking-covid-19/ (accessed 2021 Nov. 5).
  70. ↵
    COVID 19: ethno-racial identity & income. Toronto: City of Toronto. Available: https://www.toronto.ca/home/covid-19/covid-19-pandemic-data/covid-19-ethno-racial-group-income-infection-data/ (accessed 2021 Nov. 5).
PreviousNext
Back to top

In this issue

Canadian Medical Association Journal: 194 (6)
CMAJ
Vol. 194, Issue 6
14 Feb 2022
  • Table of Contents
  • Index by author

Article tools

Respond to this article
Print
Download PDF
Article Alerts
To sign up for email alerts or to access your current email alerts, enter your email address below:
Email Article

Thank you for your interest in spreading the word on CMAJ.

NOTE: We only request your email address so that the person you are recommending the page to knows that you wanted them to see it, and that it is not junk mail. We do not capture any email address.

Enter multiple addresses on separate lines or separate them with commas.
Geographic concentration of SARS-CoV-2 cases by social determinants of health in metropolitan areas in Canada: a cross-sectional study
(Your Name) has sent you a message from CMAJ
(Your Name) thought you would like to see the CMAJ web site.
CAPTCHA
This question is for testing whether or not you are a human visitor and to prevent automated spam submissions.
Citation Tools
Geographic concentration of SARS-CoV-2 cases by social determinants of health in metropolitan areas in Canada: a cross-sectional study
Yiqing Xia, Huiting Ma, Gary Moloney, Héctor A Velásquez García, Monica Sirski, Naveed Z Janjua, David Vickers, Tyler Williamson, Alan Katz, Kristy Yiu, Rafal Kustra, David L Buckeridge, Marc Brisson, Stefan D Baral, Sharmistha Mishra, Mathieu Maheu-Giroux
CMAJ Feb 2022, 194 (6) E195-E204; DOI: 10.1503/cmaj.211249

Citation Manager Formats

  • BibTeX
  • Bookends
  • EasyBib
  • EndNote (tagged)
  • EndNote 8 (xml)
  • Medlars
  • Mendeley
  • Papers
  • RefWorks Tagged
  • Ref Manager
  • RIS
  • Zotero
‍ Request Permissions
Share
Geographic concentration of SARS-CoV-2 cases by social determinants of health in metropolitan areas in Canada: a cross-sectional study
Yiqing Xia, Huiting Ma, Gary Moloney, Héctor A Velásquez García, Monica Sirski, Naveed Z Janjua, David Vickers, Tyler Williamson, Alan Katz, Kristy Yiu, Rafal Kustra, David L Buckeridge, Marc Brisson, Stefan D Baral, Sharmistha Mishra, Mathieu Maheu-Giroux
CMAJ Feb 2022, 194 (6) E195-E204; DOI: 10.1503/cmaj.211249
Digg logo Reddit logo Twitter logo Facebook logo Google logo Mendeley logo
  • Tweet Widget
  • Facebook Like

Jump to section

  • Article
    • Abstract
    • Methods
    • Results
    • Interpretation
    • Acknowledgements
    • Footnotes
    • References
  • Figures & Tables
  • Related Content
  • Responses
  • Metrics
  • PDF

Related Articles

  • PubMed
  • Google Scholar

Cited By...

  • No citing articles found.
  • Google Scholar

More in this TOC Section

  • Statin initiation and risk of incident kidney disease in patients with diabetes
  • Acute care related to cannabis use during pregnancy after the legalization of nonmedical cannabis in Ontario
  • Safer opioid supply via a biometric dispensing machine: a qualitative study of barriers, facilitators and associated outcomes
Show more Research

Similar Articles

Collections

  • Topics
    • Epidemiology & epidemiological methods
    • Health policy
    • Infectious diseases: COVID-19
    • Inner city health
    • Public health
    • Vulnerable populations


View Latest Classified Ads

Content

  • Current issue
  • Past issues
  • Collections
  • Sections
  • Blog
  • Podcasts
  • Alerts
  • RSS
  • Early releases

Information for

  • Advertisers
  • Authors
  • Reviewers
  • CMA Members
  • CPD credits
  • Media
  • Reprint requests
  • Subscribers

About

  • General Information
  • Journal staff
  • Editorial Board
  • Advisory Panels
  • Governance Council
  • Journal Oversight
  • Careers
  • Contact
  • Copyright and Permissions
CMAJ Group

Copyright 2023, CMA Impact Inc. or its licensors. All rights reserved. ISSN 1488-2329 (e) 0820-3946 (p)

All editorial matter in CMAJ represents the opinions of the authors and not necessarily those of the Canadian Medical Association or its subsidiaries.

To receive any of these resources in an accessible format, please contact us at CMAJ Group, 500-1410 Blair Towers Place, Ottawa ON, K1J 9B9; p: 1-888-855-2555; e: cmajgroup@cmaj.ca

CMA Civility, Accessibility, Privacy


Powered by HighWire