


Article Figures & Tables
Figures
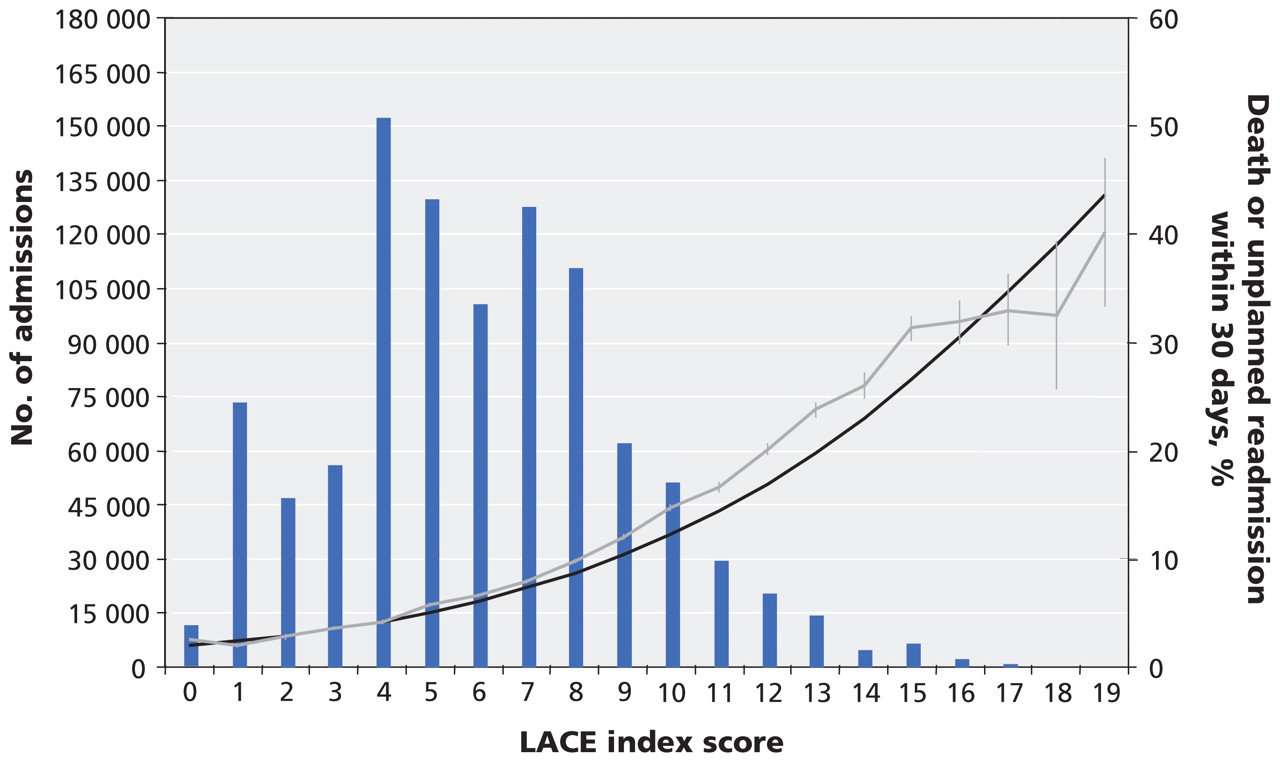
Figure 1: Calibration curve for the LACE index, based on data representing patients in the derivation and internal validation groups. Note: bars = number of patients with the same LACE score; black line = expected risk of death or unplanned readmission within 30 days after discharge; grey line = observed risk (error bars = 95% confidence intervals).
Figure 2: External validation of the LACE index, as represented by its accuracy for 1 000 000 randomly selected patients discharged from hospital in Ontario between 2004 and 2008. Note: bars = number of patients with the same LACE score; black line = expected risk of death or unplanned readmission within 30 days after discharge; grey line = observed risk (error bars = 95% confidence intervals).

Tables
Table 1: Characteristics of 4812 participants discharged from hospital to the community, by outcome within 30 days after discharge

Table 2: Final logistic regression model for risk of death or unplanned readmission within 30 days after discharge (derivation group only, n = 2393)
Table 3: LACE index for the quantification of risk of death or unplanned readmission within 30 days after discharge
Table 4: Expected and observed probability of death or unplanned readmission within 30 days after discharge, by LACE score


In this issue
Article tools


Jump to section
Related Articles
Cited By...
- Rural caregivers preparedness for detecting and responding to the signs of worsening health conditions in recently hospitalised patients at risk for readmission: a qualitative descriptive study
- Identifying older adults at increased risk of medication-related readmission to hospital within 30 days of discharge: development and validation of a risk assessment tool
- Mixed-methods study examining family carers perceptions of the relationship between intrahospital transitions and patient readiness for discharge
- The risk of death or unplanned readmission after discharge from a COVID-19 hospitalization in Alberta and Ontario
- A PRACTICAL MODEL FOR EARLY IDENTIFICATION OF PROSPECTIVE HIGH NEED HIGH COST PATIENTS
- Social Vulnerability Indices as a Risk Factor for Heart Failure Readmissions
- Evaluation of an intervention targeted with predictive analytics to prevent readmissions in an integrated health system: observational study
- Published models that predict hospital readmission: a critical appraisal
- Exploring instruments used to evaluate potentially inappropriate medication use in hospitalised elderly patients in Kosovo
- Accurate and reproducible prediction of ICU readmissions
- Combining structured and unstructured data for predictive models: a deep learning approach
- Improving Hospital Readmission Prediction using Individualized Utility Analysis
- Reader Response: Neuro R2 Score: Predicting High-Risk Neurologic Readmissions Within 30 Days
- Heart Failure with Preserved Ejection Fraction and 30-Day Readmission
- HOSPITAL Score, LACE Index and LACE+ Index as predictors of 30-day readmission in patients with heart failure
- Improving transitions from acute care to home among complex older adults using the LACE Index and care coordination
- Neuro R2 score: Predicting high-risk neurologic readmissions within 30 days
- Ability of the LACE index to predict 30-day hospital readmissions in patients with community-acquired pneumonia
- Predicting and preventing hospital readmission for exacerbations of COPD
- Medication-related harm in older adults following hospital discharge: development and validation of a prediction tool
- Vital Sign Abnormalities on Discharge Do Not Predict 30-Day Readmission
- Predicting risk of unplanned hospital readmission in survivors of critical illness: a population-level cohort study
- Predictors of 30-day hospital readmission: The direct comparison of number of discharge medications to the HOSPITAL score and LACE index
- Risk scores identifying elderly inpatients at risk of 30-day unplanned readmission and accident and emergency department visit: a systematic review
- Protocol of a multimethod descriptive study: adapting hospital-to-home transitional care interventions to the rural healthcare context in Ontario, Canada
- Disparities in health outcomes among seniors without a family physician in the North West Local Health Integration Network: a retrospective cohort study
- Impact of oral anticoagulants on 30-day readmission: a study from a single academic centre
- Death and readmissions after hospital discharge during the December holiday period: cohort study
- Factors associated with attendance at primary care appointments after discharge from hospital: a retrospective cohort study
- Development of a risk predictive scoring system to identify patients at risk of representation to emergency department: a retrospective population-based analysis in Australia
- The Cleveland Clinic Pharmacy Population Health Management Summit
- Determinants of patient choice for hospital readmission after township hospitalisation: a population-based retrospective study in China
- Necessity for a pathway for "high-alert" patients
- Emergency department presentation and readmission after index psychiatric admission: a data linkage study
- Predictive risk modelling under different data access scenarios: who is identified as high risk and for how long?
- Development and validation of a transitions-of-care pharmacist tool to predict potentially avoidable 30-day readmissions
- Acute Myocardial Infarction Readmission Risk Prediction Models: A Systematic Review of Model Performance
- Mortality of hospitalised internal medicine patients bedspaced to non-internal medicine inpatient units: retrospective cohort study
- Investigating the effect of sociodemographic factors on 30-day hospital readmission among medical patients in Toronto, Canada: a prospective cohort study
- Patients and providers perceptions of the preventability of hospital readmission: a prospective, observational study in four European countries
- National Estimates of 30-Day Unplanned Readmissions of Patients on Maintenance Hemodialysis
- Preventing hospital readmissions: the importance of considering 'impactibility, not just predicted risk
- The PEARL score predicts 90-day readmission or death after hospitalisation for acute exacerbation of COPD
- Caring about what happens to people with COPD
- Evaluating the predictive strength of the LACE index in identifying patients at high risk of hospital readmission following an inpatient episode: a retrospective cohort study
- Burden of Readmissions Among Patients With Critical Limb Ischemia
- Utility of models to predict 28-day or 30-day unplanned hospital readmissions: an updated systematic review
- Admission Data Predict High Hospital Readmission Risk
- Rehospitalizations and Emergency Department Visits after Hospital Discharge in Patients Receiving Maintenance Hemodialysis
- Physician experience and outcomes among patients admitted to general internal medicine teaching wards
- Association between frailty and 30-day outcomes after discharge from hospital
- A tool for prediction of risk of rehospitalisation and mortality in the hospitalised elderly: secondary analysis of clinical trial data
- Safely and effectively reducing inpatient length of stay: a controlled study of the General Internal Medicine Care Transformation Initiative
- The effect of a collaborative pharmacist-hospital care transition program on the likelihood of 30-day readmission
- Causes and patterns of readmissions in patients with common comorbidities: retrospective cohort study
- Do Outcomes for Patients With Heart Failure Vary by Emergency Department Volume?
- Postdischarge Outcomes in Heart Failure Are Better for Teaching Hospitals and Weekday Discharges
- Postdischarge Environment Following Heart Failure Hospitalization: Expanding the View of Hospital Readmission
- How Health Systems Could Avert 'Triple Fail' Events That Are Harmful, Are Costly, And Result In Poor Patient Satisfaction
- Home-care nurses' perceptions of unmet information needs and communication difficulties of older patients in the immediate post-hospital discharge period
- Transitional interventions to reduce early psychiatric readmissions in adults: systematic review
- Development of a predictive model to identify inpatients at risk of re-admission within 30 days of discharge (PARR-30)
- Causes and patterns of readmissions in patients with common comorbidities: retrospective cohort study
- Predictors of Thirty-Day Readmission Among Hospitalized Family Medicine Patients
- An Index to Predict Unplanned Hospital Readmission
More in this TOC Section
Similar Articles

