


Abstract
Background: Recommendations for deliveries of pregnant patients with a previous cesarean delivery and the type of hospitals deemed safe for these deliveries have evolved in recent years, although no studies have examined hospital factors and associated safety. We sought to evaluate maternal and neonatal outcomes among patients with a previous cesarean delivery by hospital tier and volume.
Methods: We carried out an ecological study of singleton live births delivered at term gestation to patients with a previous cesarean delivery in all Canadian hospitals (excluding Quebec), 2013–2019. We obtained data from the Discharge Abstract Database of the Canadian Institute for Health Information. The primary outcomes were severe maternal morbidity or mortality (SMMM), and serious neonatal morbidity or mortality (SNMM). We used regression modelling to examine hospital tier (tier 4 hospitals being those that provide the highest level of care) and volume; we also identified hospitals with high rates of SMMM and SNMM using within-tier comparisons and comparisons with the overall rate.
Results: We included 235 442 deliveries to patients with a previous cesarean delivery; SMMM and SNMM rates were 14.6 per 1000 deliveries and 4.6 per 1000 live births, respectively. Among patients with a parity of 1, SMMM rates were lower in tier 1 hospitals (adjusted incidence rate ratio [IRR] 0.68, 95% confidence interval [CI] 0.52–0.89) and higher in tier 4 hospitals (adjusted IRR 1.41, 95% CI 1.05–1.91) than in tier 2 hospitals; SNMM rates did not differ by hospital tier. Rates of SNMM increased with increasing hospital volume (adjusted IRR 1.02, 95% CI 1.00–1.04) and increasing rates of vaginal birth after cesarean delivery (adjusted IRR 1.02, 95% CI 1.01–1.04). Most hospitals had relatively low SMMM and SNMM rates, although a few hospitals in each tier and volume category had significantly higher rates than others.
Interpretation: Adverse maternal and neonatal outcomes among patients with a previous cesarean delivery showed no clear pattern of decreasing SMMM and SNMM with increasing tiers of service and hospital volume. All hospitals, irrespective of tier or size, should continually review their rates of adverse maternal and neonatal outcomes.
The approach to delivery for patients with a previous cesarean delivery has undergone substantial changes over the last few decades in Canada, the United States and elsewhere. Rates of vaginal birth after cesarean delivery (VBAC) in Canada increased rapidly, from less than 5% of deliveries in the late 1970s to peak at more than 35% in the mid-1990s.1–4 However, this trend reversed sharply after studies in the mid-1990s showed that attempted VBAC (as opposed to elective repeat cesarean delivery) was associated with higher rates of severe maternal morbidity and of fetal and infant morbidity and mortality.5–9 The decline has partly reversed after the release of a guideline from the Society of Obstetricians and Gynaecologists of Canada (SOGC) in 2005, and the National Institutes of Health Consensus Development Conference in 2010, which affirmed that patients with 1 previous transverse lower-segment cesarean section and no contraindications could be offered a trial of labour with appropriate discussion of risks and benefits.10,11
Recommendations regarding hospitals deemed safe for delivering patients with a previous cesarean delivery have also evolved. The 1998 and 1999 guidelines of the American College of Obstetricians and Gynecologists (ACOG) required hospitals attempting trials of labour to have “ready availability of emergency care” or “immediate availability of emergency care.”12,13 After the publication of these guidelines, about 30% of hospitals in the US stopped offering trial-of-labour services to patients with a previous cesarean delivery because they could not provide immediate surgical and anesthesia services, which compelled many patients who had opted for a trial of labour to travel to hospitals far from their homes and families.14–16 More recently, guidelines have attempted to balance clinical safety with the challenges associated with such social disruption. The current ACOG guideline states that a trial of labour can be attempted in a level 1 maternity care facility (i.e., a hospital providing basic obstetric services), which has “the ability to begin emergency cesarean delivery within a time interval that best incorporates maternal and fetal risks and benefits.”17 Similarly, the current SOGC guideline states that hospitals providing trial-of-labour services should have “the resources to perform an emergency cesarean section.”18 This change in recommendations has led to an increase in the number of hospitals that offer trials of labour, though concerns about inadequate access to such delivery options persist.19,20
Although clinical guidelines regarding hospitals deemed safe for delivering patients with a previous cesarean delivery have changed in recent years, to our knowledge, no studies have evaluated hospital factors and associated safety issues. We sought to evaluate maternal and infant outcomes of deliveries to patients with a previous cesarean delivery by tier of obstetric service and hospital delivery volume.
Methods
Study design and setting
We carried out an ecological study comparing maternal and infant outcomes by tiers of service and hospital delivery volume, using hospitals as the unit of analysis. Analyses also compared hospital-specific outcome rates within tiers of obstetric service, and against the average rate for all hospitals. We included in-hospital deliveries in Canada (excluding Quebec) between April 2013 and March 2019.
Study population and data source
We included all patients with a previous cesarean delivery who had a singleton live birth at term gestation (≥ 37 wk). We obtained data from the Discharge Abstract Database of the Canadian Institute for Health Information, which includes all hospital admissions in Canada (excluding Quebec). Information in the database is routinely abstracted from medical charts after hospital discharge by trained personnel using standardized definitions and processes, and includes labour and delivery events, diagnoses and procedures.21 Information in the database has been shown to accurately reflect the information in medical charts (e.g., the sensitivity and specificity of repeat elective and emergency cesarean delivery was estimated to be 90%–95% and 99%–100%, respectively).22–24
Maternal and neonatal outcomes
The primary maternal outcome was composite severe maternal morbidity and maternal mortality (SMMM), with the components of severe maternal morbidity adapted from a list developed by the Canadian Perinatal Surveillance System.24 These included severe hemorrhage, hysterectomy, complications of obstetric surgery, assisted ventilation, severe uterine rupture, sepsis and other complications (Appendix 1, Table 1, available at www.cmaj.ca/lookup/doi/10.1503/cmaj.220928/tab-related-content). Some components, namely admission to an intensive care unit and severe pre-eclampsia, were not included (the former because of variability in admission thresholds). The primary neonatal outcome, composite serious neonatal morbidity and neonatal mortality (SNMM), captured severe events among live births at term,26–28 including neonatal seizures, assisted ventilation (via endotracheal intubation or tracheostomy) and neonatal death (Appendix 1, Table 2).
We assessed maternal outcomes among all patients with a previous cesarean delivery, and assessed neonatal outcomes of infants without a congenital anomaly.
Variables
The determinants of primary interest were the hospital’s tier of service and volume (i.e., number of deliveries to patients with a previous cesarean delivery). The tier-of-service framework varied by province and territory, with hospital designations ranging from 0 to 3 or 4; tier 0 hospitals provided no obstetric services, tier 1 hospitals provided basic obstetric services and tier 3 or 4 hospitals provided the highest level of obstetric care.29 We designated tiers of service based on province- or territory-specific tiers and using a common framework of tiers of service. The latter involved a recategorization based on tier descriptions,29 and was similar to other frameworks (e.g., tiers 2a and 2b in Ontario were recategorized as tier 2, and tier 2c was recategorized as tier 3).30
For the ecological analysis, we restricted the population of singleton term deliveries to patients with a parity of 1 (i.e., patients with 1 previous cesarean delivery) to minimize between-hospital differences (i.e., we excluded patients with several previous cesarean deliveries, which increases the risk of uterine rupture and placenta accreta).31 We controlled for confounders by using restriction (to term gestation, singletons, parity 1 and infants without congenital anomalies) and regression adjustment (for advanced age, pre-existing diabetes, gestational diabetes and hypertensive disorders) (Appendix 1, Table 3).27,32
Statistical analysis
The number of cases of SMMM or SNMM in each hospital constituted the dependent variable (offset by the number of deliveries or live births, respectively. We attempted regression analysis using a Poisson model, but ultimately used a negative binomial model because of overdispersion. The adjusted model included tiers of service, volume, VBAC rate and the proportions of patients with advanced age, pre-existing diabetes, gestational diabetes and hypertensive disorders. We estimated adjusted cumulative incidence rate ratios (IRRs) for the determinants of interest.
We identified hospitals with outlier rates of SMMM or SNMM within a tier of service in each province or territory. We compared each hospital’s rate of SMMM or SNMM with that of all other hospitals in the same tier of service (in a given province or territory) using a 2-sided Fisher exact test. We also used multilevel models for stabilizing and adjusting each hospital’s SMMM or SNMM rate to permit comparisons with the SMMM or SNMM rate for all hospitals.33–36 Confounders controlled in this individual-level regression model included maternal characteristics, namely age (in 5-yr categories), parity (1, ≥ 1 and missing), pre-existing diabetes (yes or no), gestational diabetes (yes or no), hypertensive disorders (yes or no), and province- or territory-specific tiers of service. We obtained 95% confidence intervals (CIs) for these rates using bootstrap methods.35,36 We identified hospitals with SMMM or SNMM rates that were 10% higher and significantly different from the average rate as outliers.
Information related to parity was missing for a large number of patients. We excluded these patients from ecological analyses, and included them as a separate category in comparisons involving the overall national rate. Since hospital tier of service and delivery volume were potentially collinear, sensitivity analyses estimated associations with only 1 of these determinants included in the regression.
Ethics approval
The ethics review board of the University of British Columbia approved the study (H17-00587).
Results
The study population included 235 442 term, singleton deliveries to patients with a previous cesarean delivery (Figure 1). The proportion of patients with advanced age, pre-existing diabetes, gestational diabetes and hypertensive disorders increased with higher tiers of service (Table 1). Overall, 43 337 (18.4%) patients had a VBAC, 3437 had an SMMM (14.6 per 1000 deliveries) and 1001 of 219 608 infants without congenital anomalies had an SNMM (4.6 per 1000 live births). The most common severe maternal morbidity was severe hemorrhage, followed by procedures to the uterus, hysterectomy and complications of obstetric surgery. Need for assisted ventilation was the most common serious neonatal morbidity. A total of 138 462 patients had a parity of 1 and their characteristics also varied by tier of service (Table 1).

Numbers of deliveries and live births in Canada (excluding Quebec) and creation of the study cohort, April 2013 to March 2019.
Distribution of maternal characteristics by tier of obstetric service* among singleton term deliveries to patients with a previous cesarean delivery, Canada (excluding Quebec), April 2013 to March 2019 Maternal characteristic
Comparisons by tier of service and volume
A few hospitals had significantly higher rates of SMMM and SNMM; this was unrelated to tier of service and delivery volume (Figure 2 and Figure 3). A similar pattern of SMMM and SNMM rates was observed among patients with a parity of 1 (Appendix 1, Figure 1 and Figure 2), and in province- or territory-specific analyses (Appendix 1, Figures 3–22).

Hospital-specific rates of (A) severe maternal morbidity and maternal mortality (SMMM) and (B) serious neonatal morbidity and neonatal mortality (SNMM) among singleton, term deliveries and live births to patients with a previous cesarean delivery by tier of obstetric service, Canada (excluding Quebec), April 2013 to March 2019. Each hospital’s SMMM and SNMM rate is represented by a circle, with error bars showing the 95% confidence intervals (CIs). Note that the Y axes are truncated; thus, some point estimates and 95% CIs are not shown.
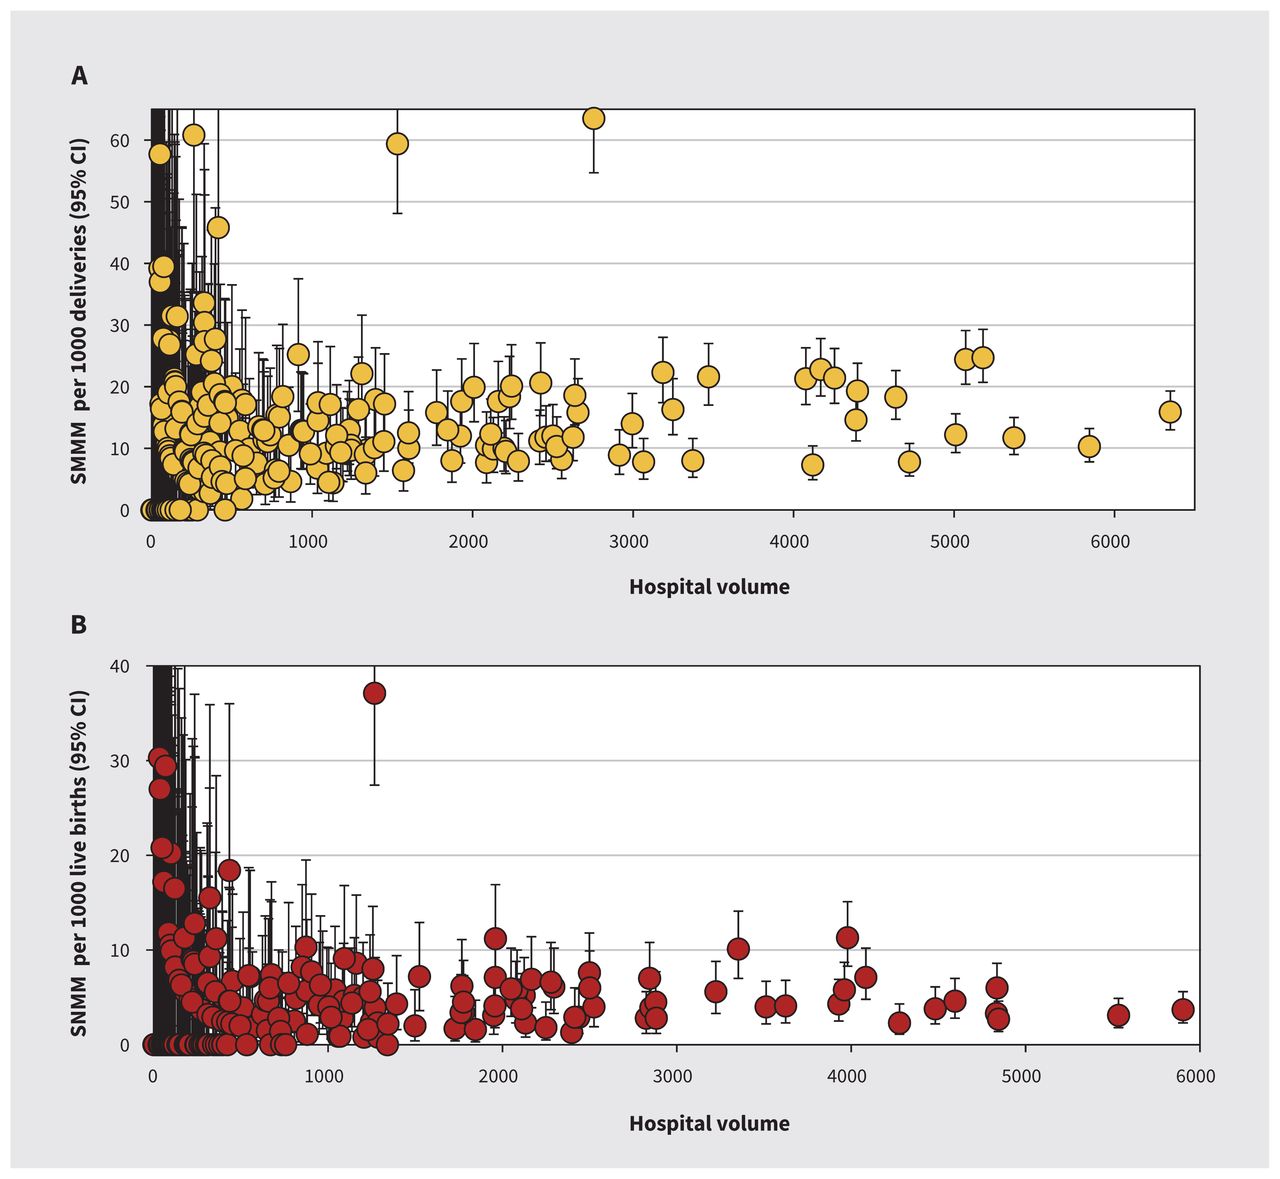
Hospital-specific rates of (A) severe maternal morbidity and maternal mortality (SMMM) and (B) serious neonatal morbidity and neonatal mortality (SNMM) among singleton, term deliveries and live births to patients with a previous cesarean delivery by hospital delivery volume, Canada (excluding Quebec), April 2013 to March 2019. Delivery volume refers to the number of deliveries to patients with a previous cesarean delivery in each hospital. Each hospital’s SMMM and SNMM rate is represented by a circle, with error bars showing the 95% confidence intervals (CIs). Note that the Y axes are truncated; thus, some point estimates and 95% CIs are not shown.
When we aggregated hospitals using the common tiers-of-service framework, VBAC rates were highest in tier 4 hospitals, although there was no clear pattern by tier (Table 2). Rates of SMMM were lowest in tier 1 hospitals and highest in tier 0 and tier 4 hospitals; SNMM rates were highest in tier 3 hospitals.
Numbers of deliveries to patients with a previous cesarean delivery, and associated rates of vaginal birth after cesarean delivery, severe maternal morbidity and mortality, and serious neonatal morbidity and mortality by tier of obstetric service, Canada (excluding Quebec), April 2013 to March 2019
Among patients with a parity of 1, unadjusted analyses showed that tier 4 hospitals, pre-existing diabetes and hypertensive disorders were associated with higher SMMM rates, and tier 1 hospitals had lower rates (Table 3). Delivery volume and VBAC were associated with higher rates of SNMM in the unadjusted analyses. In adjusted analyses, SMMM rates were significantly lower in tier 1 hospitals (adjusted IRR 0.68, 95% CI 0.52–0.89) and significantly higher in tier 4 hospitals (adjusted IRR 1.41, 95% CI 1.05–1.91), compared with tier 2 hospitals, but delivery volume was not associated with SMMM rates. Adjusted analyses showed that SNMM rates were not associated with tier of service, although SNMM rates were higher in higher-volume hospitals (adjusted IRR 1.02, 95% CI 1.00–1.04 for a 100-delivery increase in volume; Table 3). Adjusted analyses showed no significant association between rates of VBAC and SMMM, although SNMM rates increased with increasing VBAC rates (adjusted IRR 1.02, 95% CI 1.01–1.04). Regression models that estimated the effect of tier of service without adjustment for delivery volume (and vice versa) showed similar results (Appendix 1, Table 4 and Table 5).
Results of negative binomial regression analyses of associations between hospital factors with severe maternal morbidity and mortality, and with serious neonatal morbidity and mortality, among patients with a previous cesarean delivery and a parity of 1, Canada (excluding Quebec), April 2013 to March 2019
Between-hospital comparisons
Among the 278 hospitals included in the analysis, within-tier comparisons identified 24 outlier hospitals with regard to SMMM, and 14 outlier hospitals with regard to SNMM. Comparisons between each hospital’s stabilized and adjusted outcome rate and the average rate for all hospitals identified 57 outlier hospitals in the SMMM analyses and 56 outlier hospitals in the SNMM analyses. With 1 exception, all hospitals identified as outliers in the within-tier analyses were also identified as outliers in the comparison against the overall rate. Outlier hospitals were identified in all tiers from tier 1 to 4 (Appendix 1, Tables 6–9).
Interpretation
We evaluated maternal and infant outcomes among patients with a previous cesarean delivery, and found some associations between rates of SMMM or SNMM and tier of hospital, but no clear pattern. Adjusted delivery volume and VBAC rates were not associated with SMMM rates, but higher delivery volume and higher VBAC rates were associated with higher SNMM rates. Outlier hospitals, with significantly higher rates of SMMM and SNMM, were identified in every tier of service and in both low- and high-volume hospitals.
The absolute SMMM rate in the study population (14.6 per 1000 deliveries) was similar to previously documented SMMM rates in Canada in 2012–2016 (16.1 per 1000 deliveries).25 Unfortunately, the absence of a standardized definition of SMMM limited between-study comparisons.27,32 However, neonatal outcomes were comparable between this study (4.6 per 1000 live births) and a previous Canadian study (4.5 per 1000 live births), which used the same SNMM definition.27
Our study showed that most hospitals in Canada that delivered patients with a previous cesarean delivery had relatively low rates of SMMM and SNMM, although a few hospitals in every tier and in both low- and high-volume hospitals, had very high rates. The pattern of SMMM and SNMM rates by tier of service and volume suggests that overemphasizing hospital tier and volume with regard to the safe delivery of women with a previous cesarean delivery may be misplaced. Safe delivery of patients with a previous cesarean delivery requires careful selection of candidates for VBAC and careful management of labour and delivery, irrespective of hospital tier or size.5–9 However, it should be noted that our time- and place-specific study describes obstetric practice between 2013 and 2019. We did not assess specific practices with regard to selection of candidates for attempted VBAC or management. Although hospitals that performed well during the study period will likely perform well with continued adherence to their practices, this may not necessarily follow if patient profiles, practice patterns or hospital volumes change. Similarly, our study findings cannot be extrapolated to home deliveries and deliveries at birthing centres. On the other hand, outlier hospitals with high SMMM and SNMM rates need to carefully reassess patient selection for VBAC and labour management, irrespective of their tier of service and delivery volume.28
The higher SMMM rates among tier 4 hospitals and the higher SNMM rates in hospitals with higher volumes were unexpected, insofar as safety concerns have usually focused on small hospitals. These disparities likely occurred because of management differences such as in continuity of care or because larger hospitals, with immediate availability of emergency services, entertained higher thresholds for intervention. Although higher rates of SMMM in tier 4 hospitals could be considered a consequence of higher-risk patients being managed in these settings, other reasons should be considered. First, our study design, which used restriction (e.g., to patients with a single previous cesarean delivery) and regression adjustment, likely addressed most confounding by higher-risk patients being managed in higher tier hospitals. Such confounding also fails to explain the absence of a similar disparity in neonatal outcomes. In addition, tier 4 hospitals had the highest VBAC rates, which again argues against a higher-risk subpopulation. Finally, the large variability within each tier of service suggests hospital-specific differences in management rather than differences in tier-specific risk.28
Delivery of patients with a previous cesarean delivery is fraught (irrespective of hospital tier and size) because uterine rupture results in an emergency, when the interval from decision to delivery is critical.37–39 It is generally accepted that such an emergency requires a timely cesarean delivery within 30 minutes. Although a short interval from decision to delivery can prevent fetal and neonatal death, it may not necessarily prevent severe maternal morbidity or serious neonatal morbidity.40,41
Limitations
Limitations of our study include the possibility of residual confounding. Thus, differences in patient factors (e.g., smoking, obesity, requests for a trial of labour, higher baseline risk) may have resulted in higher SMMM rates in higher-tier hospitals. However, this cannot explain the higher VBAC and lower SNMM rates in tier 4 hospitals. We did not quantify hospital-specific attempted VBAC and elective repeat cesarean rates because a trial of labour can be difficult to accurately identify in large databases. Similarly, we did not include stillbirths in the outcome because of an inability to distinguish between antepartum and intrapartum fetal deaths.
Conclusion
Our study shows that rates of serious adverse maternal and neonatal outcomes among deliveries to patients with a previous cesarean delivery did not decrease with increasing hospital tier of obstetric service and delivery volume. Most hospitals had relatively low rates of SMMM and SNMM; a few hospitals in each tier of service and in both low- and high-volume hospitals had significantly higher rates of SMMM and SNMM. All hospitals should continually review their adverse maternal and neonatal outcome rates as part of a quality improvement process, which should be carried out irrespective of hospital tier or size.
Footnotes
Competing interests: Carmen Young reports a role as region 1 representative with the maternal–fetal medicine specialty committee of the Royal College of Physicians and Surgeons of Canada. Douglas Wilson reports a role as president of the Society of Obstetricians and Gynaecologists of Canada.
This article has been peer reviewed.
Contributors: K.S. Joseph and Carmen Young conceived and designed the study. K.S. Joseph, Giulia Muraca and Amélie Boutin contributed to the acquisition and analysis of the data. All of the authors contributed to the interpretation of data. K.S. Joseph drafted the manuscript. All of the authors revised it critically for important intellectual content, gave final approval of the version to be published and agreed to be accountable for all aspects of the work.
Funding: K.S. Joseph’s work is supported by an investigator award from the BC Children’s Hospital Research Institute. Amélie Boutin’s work is supported by a Scholar Award from the Fonds de Recherche du Quebec-Santé, by a Killam Postdoctoral Research Fellowship from the Killam Trusts (Izaak Walton Killam Memorial Fund) and by a Fellowship Award from the Canadian Institutes of Health Research (CIHR). Neda Razaz’ work is supported by the Swedish Research Council and the CIHR. Sid John is supported by the Government of British Columbia. Sarka Lisonkova’s work is supported by a Scholar Award from the Michael Smith Foundation for Health Research.
Data sharing: A request for access to the data used in this study can be made to the Canadian Institutes for Health Information (https://www.cihi.ca/en/access-data-and-reports/data-holdings).
- Accepted November 25, 2022.
This is an Open Access article distributed in accordance with the terms of the Creative Commons Attribution (CC BY-NC-ND 4.0) licence, which permits use, distribution and reproduction in any medium, provided that the original publication is properly cited, the use is noncommercial (i.e., research or educational use), and no modifications or adaptations are made. See: https://creativecommons.org/licenses/by-nc-nd/4.0/
References
In this issue

Article tools


Jump to section
Related Articles
Cited By...
- No citing articles found.
More in this TOC Section
Similar Articles
Collections

