


Article Figures & Tables
Figures
Figure 1: Predicted surge in international passenger traffic in Vancouver during the 2010 Olympic Winter Games. This figure depicts monthly flows of international passengers travelling through Vancouver International Airport during the past decade. Traffic flows through December 2009 reflect actual data, whereas flows during the first quarter of 2010 are predicted values based on time series analysis. The size of the predicted surge is proportional to the surge in international passenger traffic observed in Italy during the 2006 Olympic Winter Games in Torino (i.e., base estimate). Lower and upper estimates are also shown, representing 0.5 and 1.5 times the size of the surge observed during the 2006 Games in Torino. The significant reduction in baseline passenger flow observed in 2009 is consistent with that observed elsewhere in the world and is probably related to changes in the global economy. SARS = severe acute respiratory syndrome.
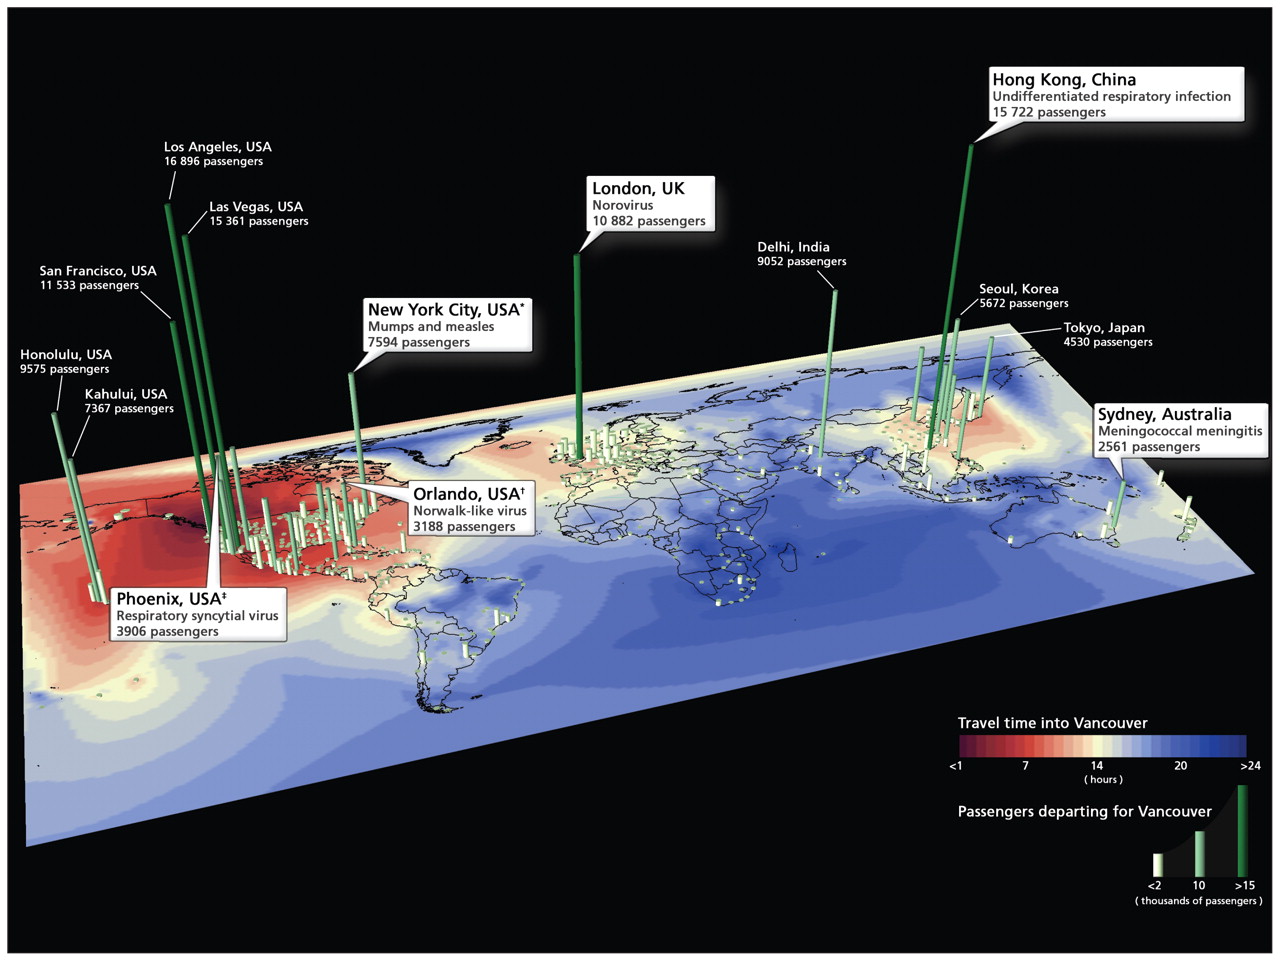
Figure 2: Potential infectious disease threats to Vancouver during the 2010 Olympic Winter Games. This figure depicts a selected number of infectious disease threats detected in February 2010 via the Internet, alongside cities with historically high volumes of passengers departing for Vancouver during the month of February. An up-to-date list of potential infectious disease threats can be viewed at www.healthmap.org/olympics. *Mumps and measles cases are reported for multiple locations across New Jersey and New York State, USA. †An outbreak of a Norwalk-like viral illness has been reported in Flagler County, Florida, USA. ‡An outbreak of respiratory syncytial virus has been reported in Mesa, Arizona, USA.

In this issue
Article tools


Jump to section
Related Articles
Cited By...
- No citing articles found.
More in this TOC Section
Similar Articles

