


Abstract
Background: Although the Canadian health care system was designed to ensure equal access, inequities persist. It is not known if inequities exist for receipt of investigations used to screen for colorectal cancer (CRC). We examined the association between socioeconomic status and receipt of colorectal investigation in Ontario.
Methods: People aged 50 to 70 years living in Ontario on Jan. 1, 1997, who did not have a history of CRC, inflammatory bowel disease or colorectal investigation within the previous 5 years were followed until death or Dec. 31, 2001. Receipt of any colorectal investigation between 1997 and 2001 inclusive was determined by means of linked administrative databases. Income was imputed as the mean household income of the person's census enumeration area. Multivariate analysis was performed to evaluate the relationship between the receipt of any colorectal investigation and income.
Results: Of the study cohort of 1 664 188 people, 21.2% received a colorectal investigation in 1997–2001. Multivariate analysis demonstrated a significant association between receipt of any colorectal investigation and income (p < 0.001); people in the highest-income quintile had higher odds of receiving any colorectal investigation (adjusted odds ratio [OR] 1.38; 95% confidence interval [CI] 1.36–1.40) and of receiving colonoscopy (adjusted OR 1.50; 95% CI 1.48–1.53).
Interpretation: Socioeconomic status is associated with receipt of colorectal investigations in Ontario. Only one-fifth of people in the screening-eligible age group received any colorectal investigation. Further work is needed to determine the reason for this low rate and to explore whether it affects CRC mortality.
Colorectal cancer (CRC) is the most common cause of cancer-related death among nonsmokers in North America. In 2004 an estimated 19 200 Canadians will receive a diagnosis of CRC and 8400 will die from the disease.1 Although the age-standardized incidence and mortality of CRC have been decreasing, the number of new cases is increasing because of the growing size of the elderly population.
CRC screening reduces the incidence and disease-specific mortality,2,3,4,5,6 is cost-effective7,8 and is endorsed by many professional societies.9,10,11,12,13,14,15 In 1994 the Canadian Task Force on the Periodic Health Examination (now the Canadian Task Force on Preventive Health Care) concluded that there was insufficient evidence to support CRC screening in asymptomatic people over the age of 40 years.16 In the 2001 update of these guidelines9 fecal occult blood testing (FOBT) every 1 or 2 years or flexible sigmoidoscopy every 5 years was recommended for screening average-risk people 50 years of age or older; there was judged to be insufficient evidence to support colonoscopy as the initial screening test. Despite these endorsements the use of CRC screening remains suboptimal.17,18,19
The Canadian health care system covers all medically necessary services without user fees. Although equity has been achieved in certain areas,20,21 low socioeconomic status (SES) is associated with a lower rate of use of cardiovascular procedures22,23 and screening tests for breast and cervical cancer.24,25,26 It is unknown whether SES affects the receipt of CRC screening investigations. This study assessed the association of neighbourhood income (a marker of SES) with the receipt of colorectal investigations in people eligible for screening who lived in Ontario.
Methods
Data were obtained from the Ontario Registered Persons Database (RPDB), the Ontario Health Insurance Plan (OHIP) database and the Canadian Institute for Health Information (CIHI) database. The RPDB contains demographic information on all Ontario residents ever covered under OHIP. The OHIP database records all physician claims in Ontario. The CIHI database contains diagnostic and procedural information on all patients discharged from hospitals and same-day surgery units. These databases have high rates of reliability for demographic, diagnostic and procedural information.27
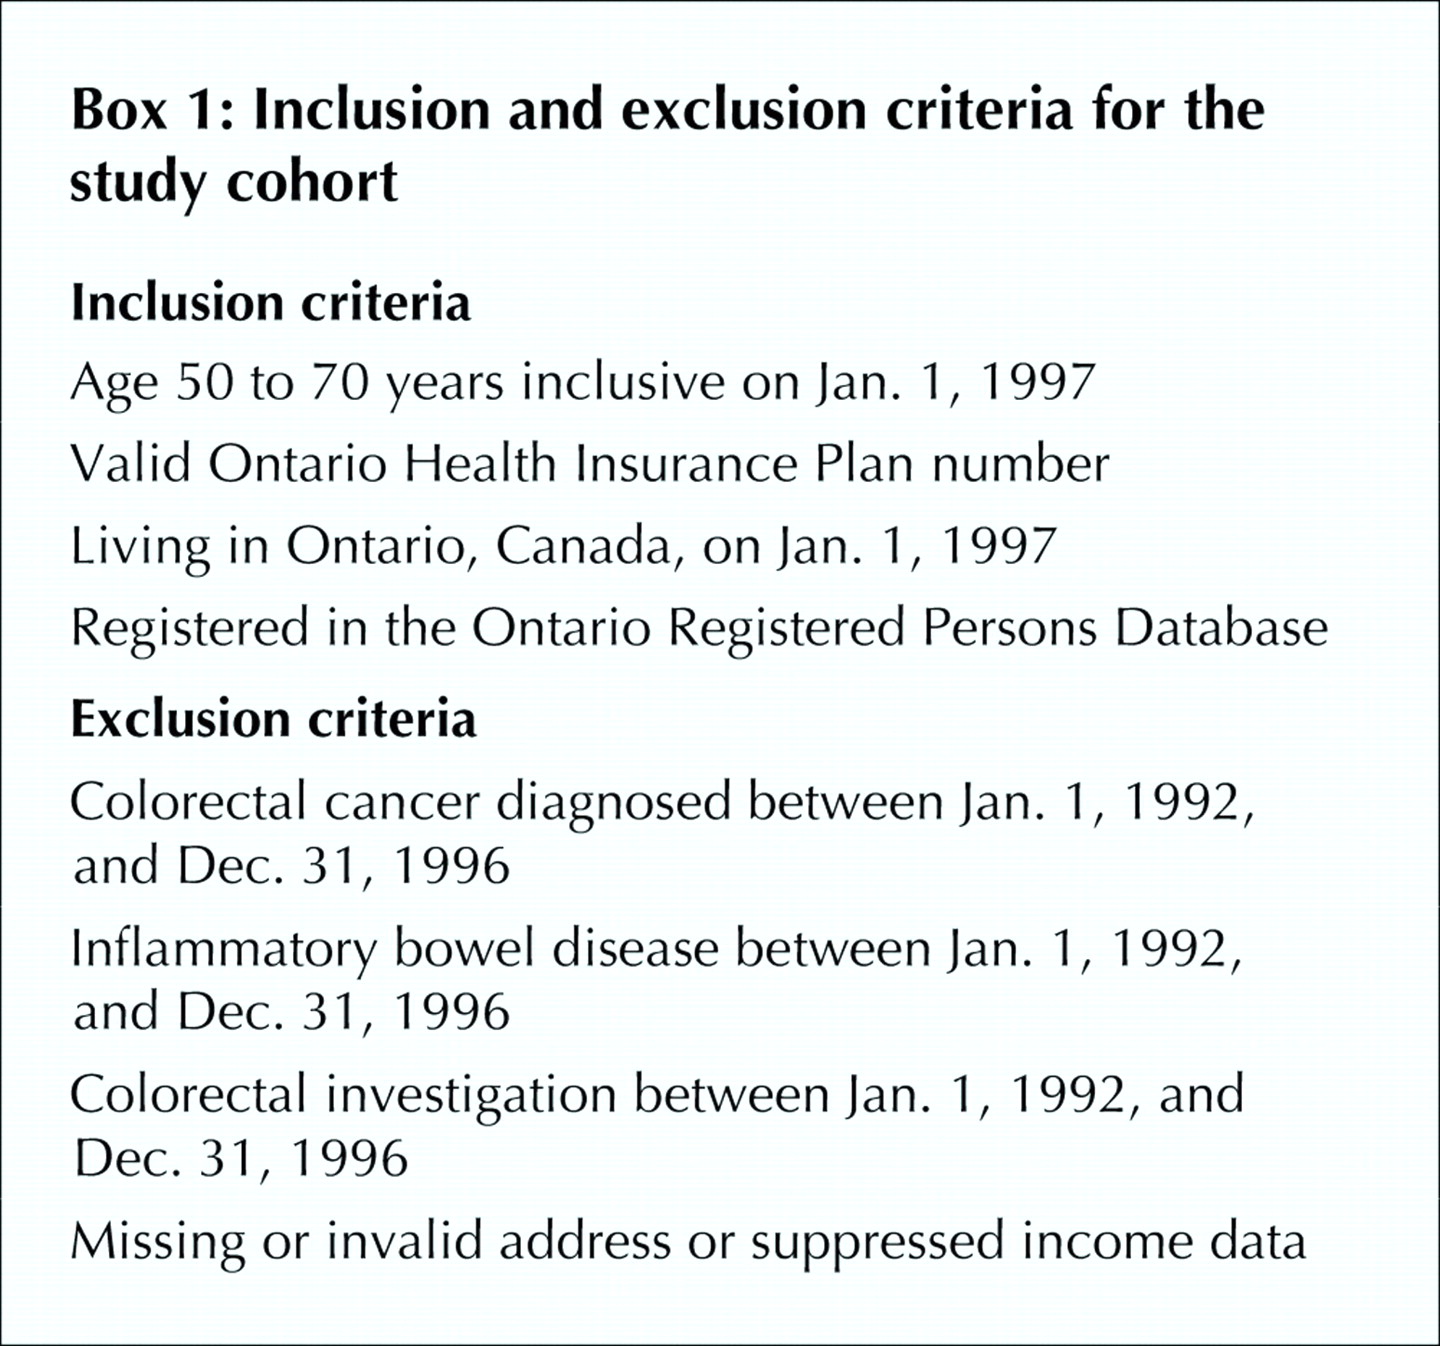
Inclusion and exclusion criteria for the study cohort are summarized in Box 1. People aged 50 to 70 years living in Ontario on Jan. 1, 1997, who had a valid OHIP number were identified in the RPDB. Those who in the previous 5 years had had CRC, inflammatory bowel disease or colorectal investigation were excluded. The remainder approximated a cohort at average risk of CRC. People with missing geographic or suppressed income data were excluded.

A longitudinal record was created, and each person was followed until death or Dec. 31, 2001. People were classified as living in urban or rural areas according to 1996 Statistics Canada Census definitions28 applied to the postal code of the primary address. Health status on Jan. 1, 1997, was assessed with the Deyo score, as follows. Weights were assigned for specific comorbid conditions (e.g., myocardial infarction, diabetes mellitus without complications, renal disease), and a score was calculated for each person in the cohort with the use of codes of the International Classification of Diseases, 9th revision, recorded in the hospital discharge abstracts between Jan. 1, 1992, and Dec. 31, 1996, according to the method described by Deyo, Cherkin and Ciol.29 With this approach, a score of 0 indicates no comorbidity, and higher scores denote higher levels of comorbidity.
People who received any colorectal investigation (FOBT, barium-enema radiography, sigmoidoscopy, colonoscopy) were identified in both the OHIP and CIHI databases; Appendix 1 lists the procedural and diagnostic codes. Using administrative data, one cannot distinguish between screening and diagnostic investigations; however, identifying these procedures in an average-risk population approximates identifying screening procedures.
Because personal income is not included in Ontario administrative databases, we used 1996 Statistics Canada Census data to calculate the mean household income of the enumeration area in which the person lived. An enumeration area is the geographic area canvassed by 1 census representative; in 1996 the number of dwellings in each enumeration area varied from 125 to 440. The enumeration areas were classified into quintiles, each containing approximately 20% of the Ontario population, that were based on the mean household income: $34 370 for the first quintile, $47 792 for the second, $56 244 for the third, $65 949 for the fourth and $95 066 for the fifth. Census data have previously been used as a surrogate for personal income.21,22,23,26,30,31
We used analysis of variance (for continuous variables) and χ2 tests (for categorical variables) to determine if any statistically significant difference existed across income quintiles and between the group that received colorectal investigations and the group that did not. We used multivariate logistic regression to evaluate the independent association of income and receipt of any investigation, adjusting for age, sex, location of primary address (rural or urban) and the Deyo score; we calculated 95% confidence intervals (CIs) for each value. We performed separate analyses for people who received colonoscopy and those who did not. The level of statistical significance was set at p < 0.05.
We obtained approval for the study from the Sunnybrook and Women's College Health Sciences Centre Research Ethics Board.
Results
Of the 1 810 702 people in the inception cohort, 3.2% had missing geographic data, and 4.9% had suppressed income data. The remaining 1 664 188 (91.9%) constituted the study cohort.
The mean age of the study cohort was 58.6 years, 49.9% were male, 14.3% lived in rural areas, and 91% had a Deyo score of 0. There were no imbalances in age, sex or Deyo score between the groups with and without complete data. During follow-up, 151 854 died.
Table 1 summarizes the baseline characteristics of the study cohort. For all demographic characteristics there were small differences among the income quintiles: people in higher-income quintiles tended to be younger, be male, live in urban areas and have a lower Deyo score.
Table 1.
Table 2 compares the 21.2% of the study cohort who received any colorectal investigation during the follow-up period with those who did not. There were small but significant differences between the 2 groups: those who received any colorectal investigation tended to be older, be female, live in urban areas and have a higher Deyo score. Of those who received any colorectal investigation, a greater proportion had higher incomes.
Table 2.
Table 3 displays the results of the multivariate analysis for receipt of any colorectal investigation in the follow-up period. Higher age, female sex, urban residence and a moderate Deyo score (1 or 2) were independent predictors of receiving colorectal investigations. After adjustment for all variables, people in higher-income quintiles had increased odds of receiving any colorectal investigation. Those in the highest-income quintile had 1.38 higher odds of receiving any investigation than those in the lowest.
Table 3.
Table 4 displays the results of the multivariate analysis for receipt of colonoscopy in the follow-up period. Higher age, female sex and rural residence were independent predictors of receiving colonoscopy. After adjustment for these variables, people in higher-income quintiles had increased odds of receiving colonoscopy. Those in the highest-income quintile had 1.50 higher odds of receiving colonoscopy than those in the lowest.
Table 4.
Interpretation
We observed a marked association between income and receipt of colorectal investigations in a screening-eligible age group in Ontario. Increased income was associated with 1.38 higher odds of receiving any colorectal investigation and 1.50 higher odds of receiving colonoscopy. In addition, during a 5-year period about one-fifth of people in the screening-eligible age group in Ontario received any colorectal investigation. As we could not distinguish screening from diagnostic investigations, this value represents the upper extent of CRC screening.
Despite universal health care, Canadians of higher SES still have greater access to certain medical procedures than Canadians of lower SES;22,23,24,25,26 our findings add to the earlier work. In addition, the rate of screening for CRC in Ontario is low; in the United States in 2001, by comparison, about 20% of the population received FOBT, and 43% had undergone lower endoscopy in the previous 10 years.18 Screening rates may be suboptimal owing to factors affecting decision-making by physicians19,32,33,34,35 and patients.36,37,38,39,40 Universal health insurance alone may not reduce SES differences in health care;41 organized screening programs may be necessary to reduce the disparity.26
It is important to acknowledge the limitations of our methodology. First, our results do not pertain strictly to screening, because administrative databases do not distinguish screening from diagnostic investigations. To approximate an average-risk cohort, we studied people in the screening-eligible age group who had no history of previous CRC, inflammatory bowel disease or colorectal investigations. Although not perfect, our analysis reasonably estimated the receipt of screening investigations. For certain, the proportion screened was less than 21%. Second, although census data have been used as a surrogate for personal income in the past, total wealth may be a more appropriate marker of financial resources in the elderly. Finally, our main outcome was receipt of colorectal investigations, not quality of life, survival or death. Previous work has demonstrated a small improvement in survival rates for patients of higher SES with CRC in Ontario.42 It will be important to determine whether a decreased risk of death from CRC was conferred on the people who received colorectal investigations in our cohort.
In conclusion, inequities in receipt of colorectal investigations exist in Ontario. In addition, fewer than 21% of people in the screening-eligible age group were screened for CRC between 1997 and 2001. Further work is necessary to determine why this disparity exists, explore its effects on CRC mortality and move forward with an organized screening program to improve CRC screening.
Footnotes
-
This article has been peer reviewed.
Contributors: Sheldon Singh, Lawrence Paszat and Linda Rabeneck conceived and designed the study. Cindy Li, Jingsong He and Chris Vinden acquired the data. Sheldon Singh, Lawrence Paszat, Cindy Li, Jingsong He and Linda Rabeneck analyzed and interpreted the data. All authors either drafted the manuscript or revised it critically, and all approved the version to be published.
Acknowledgements: We thank Ms. Deanna Rothwell for her assistance with statistical analysis and commentary on the final manuscript. Dr. Rabeneck is a Senior Investigator with the Cancer Quality Council of Ontario.
Competing interests: None declared.
References
In this issue

Article tools


Jump to section
Related Articles
Cited By...
- Equity and practice issues in colorectal cancer screening: Mixed-methods study
- Small-area variation in screening for cancer, glucose and cholesterol in Ontario: a cross-sectional study
- Screening rates for colorectal cancer in Canada: a cross-sectional study
- Using physician-linked mailed invitations in an organised colorectal cancer screening programme: effectiveness and factors associated with response
- Effect of Sociodemographic Factors on Surgical Consultations and Hip or Knee Replacements Among Patients with Osteoarthritis in British Columbia, Canada
- Association of Median Household Income With Burden of Coronary Artery Disease Among Individuals With Diabetes
More in this TOC Section
Similar Articles
Collections

