

In a large study in the United States, 20% of people with type 2 diabetes mellitus had poor control of blood glucose (i.e., a hemoglobin A1c concentration greater than 9%), only one third achieved a target rate of blood pressure (i.e., 130/80 mm Hg) and half had low-density lipoprotein cholesterol levels above the target rate. 1 Less than 50% of people with fragility fracture received a diagnostic test for osteoporosis or a diagnosis from a clinician. 2 Among elderly patients with hip, wrist or vertebral fractures, 10%–20% receive therapy for osteoporosis in the year after the fracture. 3 Researchers have found that evidence frequently isn’t used by local, 4 national 5 or international 6 policy-makers.
What is a “gap”?
All of the above facts are examples of gaps. Measuring the “gap” between evidence and actual practice or policy-making is one of the first steps in knowledge translation. 7 By evidence, we mean the best available research-based evidence. 8 Ideally, this evidence should come from high-quality practice guidelines or systematic reviews.
We’ll use a recent example from New Zealand to illustrate how to use data to address gaps — the difference between what is desired and what is actually done. For many years, vascular guidelines in New Zealand have contained recommendations that management of cardiovascular risk should be informed by the absolute risk of a cardiovascular event. 9 Moreover, they targeted treatment to those with an absolute cardiovascular risk of 15% or higher at 5 years. Researchers found that in primary care, less than one-third of people with vascular disease were receiving therapy recommended by the guidelines. 10
Before anything can be done to improve the quality of care, we need to be able to assess current care in a simple, reliable way. Quality indicators can be used as a basis for assessing gaps. These indicators are measures used to monitor, assess and improve the quality of care and organizational functions that affect patient outcomes. Examples include appropriate control of blood pressure in patients with diabetes and previous stroke, and prophylaxis against deep vein thrombosis in critically ill patients admitted to the intensive care unit.
Donabedian 11 proposed a framework for considering quality of care that separates quality into structure (i.e., the setting), process (i.e., the activity) and outcome (i.e., the status of the patient after the intervention). This framework can be used to categorize quality indicators. Considering our example of vascular risk, the availability of a computerized system for support of decision-making in a clinician’s office is a structural indicator. Completion of a vascular risk assessment by a patient or physician is a process indicator. Outcomes would include stroke, myocardial infarction and death. For each of these items, ideally we would have a descriptive statement, a list of data-based elements or criteria to measure the indicator, and information about the relevant population, how the data-based elements are collected, the timing of data collection and reporting, the analytic models used to construct the measure, the format in which the results will be presented and the evidence in support of its use (Box 1). 12

Box 1: Examples of quality indicators 13
Many countries have instituted national strategies to collect quality indicators. 12 For example, the National Institute of Clinical Studies in Australia has captured gaps from evidence to practice across a range of issues including influenza vaccination. 14 The Agency for Health Research and Quality in the United States has prepared indicators to measure aspects of quality in prevention, in-hospital care, patient safety and pediatrics. 15 However, little agreement exists on quality indicators across countries.
Quality indicators should be developed through consideration of the best available evidence. The Delphi method was modified by investigators at RAND Health to achieve consensus on this process. 16 The method involves rounds of anonymous ratings on a risk–benefit scale and in-person discussion between rounds. 17 The goal is to be inclusive of all relevant stakeholders, including the public, health care professionals and managers. This process should be followed by a test of the indicator in practice-based settings to determine if the indicator can be measured accurately and reliably. 17 For example, for our vascular risk strategy, can we measure outcomes such as death and stroke accurately? We would need to determine if this information is collected in the clinical or administrative databases and whether we can accurately extract this information.
Which gaps should we target?
Although many gaps in practice and policy-making could be identified in various settings, a process needs to be established for selecting which ones to target. 17 Realistically, given constraints in resources, it isn’t possible to target every gap from evidence to practice. Strategies include consideration of the burden of disease, including morbidity, mortality, quality of life and cost. These discussions should be transparent and involve relevant stakeholders, including patients or the public, health care professionals and managers. The vascular risk strategy of New Zealand was developed by a collaborative that included the Ministry of Health and the New Zealand Guidelines Group. Given the burden of disease and the existence of effective therapies, vascular risk was identified as a national priority, with input from health care professionals and patient-based groups. In particular, the review by stakeholders of the evidence highlighted the need to reduce cardiovascular risk in Maoris, who have the poorest health status of any group in New Zealand.
How can we measure the gap?
Needs assessment is a process for determining the size and nature of the gap between current and more desirable knowledge, skills, attitudes, behaviours and outcomes. The strategy used for assessment depends on the purpose of the assessment, the type of data and the resources available. The classification of needs includes felt needs (i.e., what people say they need), expressed needs (i.e., what people do), normative needs (i.e., what experts say), and comparative needs (i.e., group comparisons). 18 We can consider this issue from the perspective of the population, the provider organization or the health care provider. As well, needs can be measured objectively or subjectively (Table 1). 19
Table 1: Strategies for needs assessments to measure gaps in assessment and management of cardiovascular risk
At the population level
At the population level, we can consider population-based needs using epidemiological data, which are objective tools of measurement for assessment. Administrative databases or claims databases are created from administering and reimbursing health care services. 20 Typically, these databases include information on diagnosis (e.g., International Classification of Diseases, 10th Revision, Clinical Modification), procedures, laboratory investigations, billing information and some demographic information. Many administrative databases exist, ranging from regional databases, such as those provided by the Ontario Ministry of Health and Long-term Care 21 to national databases such as the Medicare Provision and Analyses Review Files. 22 Databases like these have been used to identify undertreatment of cardiovascular risk factors in patients with diabetes 23 and overuse of benzodiazepines in elderly patients. 24
These databases have some limitations. First, they were not developed for research-related use and may not contain all of the information that would be useful for gap-related analysis, including data on severity of illness. 25 Second, coding may be incomplete and we can only find events for which codes are available. 20 Third, the databases may not include the entire population. For example, the Medicare files include only people 65 and older, some people under 65 with disabilities and all people with endstage renal disease requiring renal replacement therapy.
Clinical databases can also be used to perform analyses of gaps. Clinical databases include registries of patients who have undergone specific procedures (e.g., colonoscopy) or who have certain diagnoses (e.g., colon cancer). Examples in the United Kingdom include the National Cardiac Surgical Database, which contains data on patients who have cardiac surgery, and the National Vascular Database, which contains data from surgeons who do repairs of abdominal aortic aneurysms, carotid endarterectomy and infrainguinal bypass. 20 These registries may have data that is complementary to that included in administrative databases, including more information on secondary diagnoses and comorbidities. Clinical databases can sometimes be used in combination with administrative databases to provide additional detail on gaps in practice. 26 However, some studies have shown lack of agreement between administrative and clinical databases. 27 Limitations of these databases include inaccuracy of information.
In our New Zealand example, data were available from primary care practices that used an electronic health record. Using this information, researchers were able to identify the proportion of patient records that included documentation of cardiovascular risk factors 28 and the proportion of patients received prescriptions for statins, antiplatelet agents and anti-hypertensive medications. 10 However, this database did not include all patients at risk for vascular disease.
At the organizational level
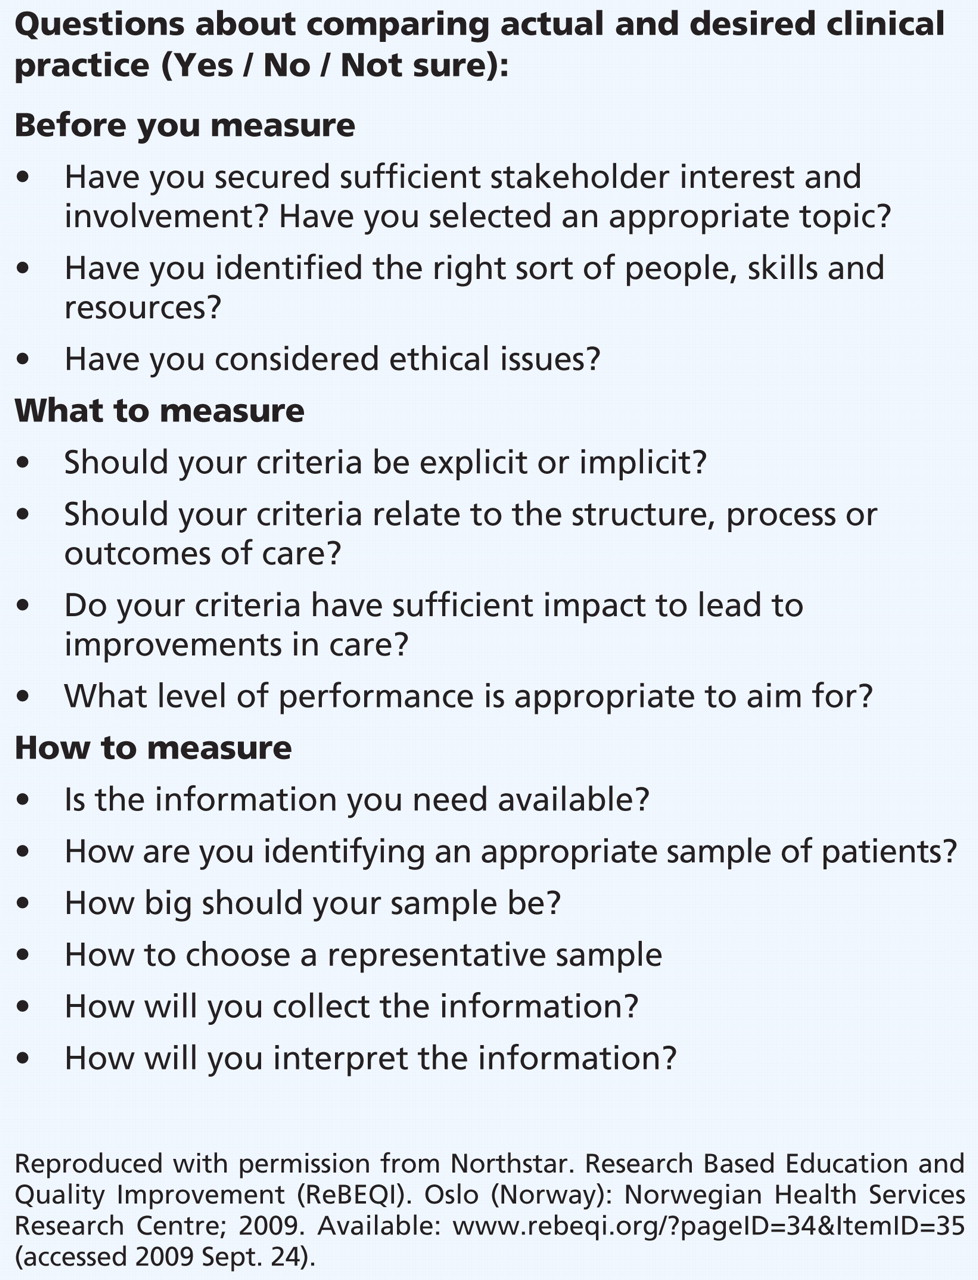
Needs assessments at the organizational level may be done at the level of the hospital or the clinic. Hospitals in many countries are required by accreditation bodies (e.g., the Joint Commission on the Accreditation of Health Care Organizations) to collect information on control of infection, mortality and use of restraints, for example. 29 This source could be used to collect information on gaps. With the growing use of computerized health care records in hospitals and community settings, these tools can be used to extract data for assessment of gaps. 30 For example, chart audits can be done to review and assess health records using preset standardized criteria for outcomes such as diagnostic tests or use of appropriate therapies. Ideally, criteria for review should be based on valid evidence for the quality indicator and include objective measures, such as whether target levels of blood pressure and blood glucose were achieved in patients with increased cardiovascular risk. An approach that we can consider when completing a baseline measurement is shown in Box 2.

Box 2: Questions to consider when beginning a chart audit.
At the care-provider level
Several strategies can be used for assessment of needs at the provider level, including chart audits, observation, assessment of competency and reflective practice. Direct observation of the performance of providers can be completed through the use of standardized patients 31 or video recording of clinicians interacting with patients. 32 Similarly, assessments of competency, including questionnaires about knowledge, can be completed (e.g., those done as part of the requirements for certification by the American Board of Internal Medicine or through completion of clinical vignettes). 33 Finally, reflective practice, whereby clinicians use their own clinical experiences to highlight learning opportunities, or learning-based portfolios that support the identification and recording of needs from clinical experiences, can be considered. 34 However, these subjective forms of assessment may be less accurate in determining needs than more objective measures such as actual practice (e.g., prescribing a particular medication). Clinicians tend to pursue education around topics that they already know while avoiding areas in which they are deficient. 35 For this reason, although surveys, interviews and focus groups can inform assessments of needs, they are more subjective and may not accurately reflect gaps in practice.
Why do gaps exist?
Performing audits is a method for obtaining information about gaps in practice. However, it must be cautioned that using gaps in practice to blame clinicians is easy, but gaps from evidence to action usually reflect systems-related issues and not solely the performance of providers. For this reason, we need to look beyond the evidence of a practice gap to determine the “why.” Van de Ven 36 argues that we underestimate what we already know about human behaviour; namely, that human beings have problems paying attention to nonroutine tasks. Also, most individuals find dealing with complexity and remembering complex information challenging 37 but are efficient processors of routine tasks. We do not concentrate on repetitive tasks once they are mastered. Skills for performing repetitive tasks (e.g., writing admission orders) are repressed in our subconscious memory, permitting us to pay attention to things other than the performance of the repetitive task. The consequence is that what most individuals do most frequently is what they think about the least. If we do not have ways of evaluating the impact of these tasks, then gaps between evidence and practice can occur.
March and Simon 38 state that dissatisfaction with existing conditions stimulates us to search for improved conditions and that we stop searching when a satisfactory result is found. Therefore, in any discussions about potential gaps, data need to be presented along with descriptions of individuals’ experiences and preferences for the change in practice. We feel happy and satisfied when the changes we have made correspond to our own set of beliefs about our job and we have successfully achieved the change. 39
Gaps between evidence and decision-making occur for many reasons. A review of barriers to implementation of guidelines by physicians has identified more than 250 barriers. 40 Barriers can range from systems-related issues, such as lack of facilities to perform assessment of vascular risk, to individual factors, such as lack of awareness of the evidence in support of assessment of vascular risk. Assessment of barriers to uptake of knowledge will be discussed in a subsequent article in this series.
What are the gaps in gap identification?
An area for further research is the testing of how data can be used to stimulate the identification of gaps in care, in monitoring changes to practice and in the introduction of new practices in a reliable and valid way. We need further understanding of ways to support greater autonomy and self-direction of local teams so they can keep vigilant over routine matters. Being clearer about how we identify the gaps from knowledge to action in the health care system is also important. 41
Identifying the gaps in care is a starting point for implementation of knowledge. The next articles in this series will address how to adapt the knowledge to local context and how to understand barriers and facilitators to implementation of knowledge.
-
Identifying the gaps from knowledge to practice is the starting point of implementing knowledge. Analyses of gaps should involve use of rigorous methods and engage relevant stakeholders.
-
Strategies for completing needs assessments depend on the purpose of the assessment, the type of data and the resources that are available.
-
Needs can be assessed from the perspective of a population, an organization or a health care provider.
Key points
Articles to date in this series
-
Straus SE, Tetroe J, Graham I. Defining knowledge translation. CMAJ 2009;181:165-8.
-
Brouwers M, Stacey D, O’Connor A. Knowledge creation: synthesis, tools and products. CMAJ 2009.DOI:10.1503 /cmaj.081230
Footnotes
-
This article has been peer reviewed.
Competing interests: None declared.
Sharon Straus is section editor of Reviews at CMAJ and was not involved in the editorial decision-making process for this article.
Contributors: Both of the authors were involved in the development of the concepts in the manuscript and in the drafting of the manuscript, and both of them approved the final version submitted for publication.
The book Knowledge Translation in Health Care: Moving from Evidence to Practice, edited by Sharon Straus, Jacqueline Tetroe and Ian D. Graham and published by Wiley-Blackwell in 2009, includes the topics addressed in this series.
REFERENCES
- 1.
- 2.
- 3.
- 4.
- 5.
- 6.
- 7.
- 8.
- 9.
- 10.
- 11.
- 12.
- 13.
- 14.
- 15.
- 16.
- 17.
- 18.
- 19.
- 20.
- 21.
- 22.
- 23.
- 24.
- 25.
- 26.
- 27.
- 28.
- 29.
- 30.
- 31.
- 32.
- 33.
- 34.
- 35.
- 36.
- 37.
- 38.
- 39.
- 40.
- 41.