Article Text

Abstract
Introduction An unintended consequence of indoor smoking restrictions is the relocation of smoking to building entrances, where non-smokers may be exposed to secondhand smoke, and smoke from outdoor areas may drift through entrances, exposing people inside. Tobacco smoke has been linked to numerous health effects in non-smokers and there is no safe level of secondhand smoke (SHS) exposure. This paper presents data on levels of tobacco smoke inside and outside entrances to office buildings.
Methods Real-time air quality monitors were used to simultaneously measure respirable particulate matter (PM2.5; air pollutant particles with a diameter of 2.5 μm or less) as a marker for tobacco smoke, outside and inside 28 entrances to office buildings in downtown Toronto, Ontario, in May and June 2008. Measurements were taken when smoking was and was not present within 9 m of entrances. Background levels of PM2.5 were also measured for each session. A mixed model analysis was used to estimate levels of PM2.5, taking into account repeated measurement errors.
Results Peak levels (10 s averages) of PM2.5 were as high as 496 μg/m3 when smoking was present. Mixed model analysis shows that the average outdoor PM2.5 with smoking was significantly higher than the background level (p<0.0001), and significantly and positively associated with the number of lit cigarettes (p<0.0001). The average level of PM2.5 with ≥5 lit cigarettes was 2.5 times greater than the average background level.
Conclusions These findings support smoke-free policies at entrances to buildings to protect non-smokers from exposure to tobacco smoke.
- Secondhand smoke
- tobacco smoke pollution
- building entrances
- air quality
- outdoor tobacco smoking
- environment
- environmental tobacco smoke
- public policy
Statistics from Altmetric.com
- Secondhand smoke
- tobacco smoke pollution
- building entrances
- air quality
- outdoor tobacco smoking
- environment
- environmental tobacco smoke
- public policy
Introduction
An unintended consequence of indoor smoking restrictions is the relocation of smoking to the entrances of buildings. Smokers who congregate outside buildings may expose non-smokers who are standing nearby or entering and exiting a building to tobacco smoke. According to the 2009 Canadian Tobacco Use Monitoring Survey, over half (54%) of Canadians reported being exposed to tobacco smoke at an entrance to a building in the past month.1 Smoke from outdoor areas may also drift inside through doors, windows and air intakes, exposing those in protected areas.2
Smoking around building entrances is a public health concern because: (a) there is no safe level of exposure to tobacco smoke3 and (b) there is evidence that outdoor exposure can be substantial and, in some cases, as high as indoors during active smoking.2 4 5 In 2006, the California Air Resources Board identified secondhand smoke (SHS) as a ‘toxic air contaminant’ that may cause and/or contribute to death or serious illness.4
There is a substantial body of evidence that connects indoor exposure to tobacco smoke with adverse health effects in non-smoking adults including lung and nasal sinus cancer, heart disease,6 breathing difficulty for people with chronic respiratory diseases or asthma,3 7 breast cancer in non-smoking premenopausal women,4 8 and adverse health effects specific to children and infants.4 9 There is also evidence that brief exposure to tobacco smoke may induce short-term general respiratory irritation, eye irritation and asthma symptoms,3 and has been found to cause immediate harm to non-smokers, particularly those with very sensitive cardiovascular systems.3 10–12 This is supported by a recent review of existing biological evidence regarding acute health effects of SHS exposure, which concluded that even brief, acute, transient exposures to SHS may cause significant adverse effects on several systems in the human body.13 Heiss et al demonstrated that 30 min of exposure to real-world levels of tobacco smoke in restaurants and bars leads to sustained vascular injury among young adults who were lifelong non-smokers.14 Pope et al also found that short-term real-world exposure to tobacco smoke for 2 h altered cardiac autonomic function, and concluded that acute exposure may be part of the pathophysiological mechanisms linking exposure to increased risk of cardiovascular mortality.15 More recently, Pope et al looked at relative risks of mortality against estimated average daily exposure to SHS and concluded that relatively low levels of fine particulate exposure from either air pollution or SHS are sufficient to induce adverse biological responses increasing the risk of cardiovascular disease mortality.16 Further, a recent study has linked low level tobacco smoke exposure to lung health risk as a result of biological changes in the small airway epithelium.17
However, there are few data on actual levels of tobacco smoke exposure in outdoor environments. The first peer-reviewed publication of systematic measurements of outdoor tobacco smoke concentrations in common outdoor settings (parks, sidewalk cafes, restaurant and pub patios) published by Klepeis et al in 2007,5 concluded that outdoor tobacco smoke levels can be substantial under certain conditions, such as when downwind from a smoker and within 1–2 m of a lit cigarette.
Several studies also suggest that smoking around doorways creates problems of increased litter, fire risk, negative role modelling and concerns that it presents a poor image to outsiders and visitors.18–20 Thus, establishing smoke-free outdoor spaces will reduce the direct impact of tobacco smoke exposure on health and may also reduce negative social and environmental impacts associated with smoking.
As of January 2010, most Canadian provinces and territories had legislation that included a smoke-free buffer zone ranging from 2–10m around the entrances, operable windows and air intakes of specific types of buildings (eg, public buildings, healthcare facilities or enclosed work places), and about 55 municipalities had a bylaw that exceeded their provincial or territorial legislation.21 In the US, about 900 municipalities restrict smoking near entrances, windows and ventilation systems of enclosed places.22 However, the vast majority of these policies address public (ie, municipal or city) buildings and not commercial office buildings or other types of work places. In Ontario, Canada, the Smoke-free Ontario Act prohibits smoking within 9 m (30 feet) of any entrance or exit of a public or private hospital, psychiatric facility, nursing home, approved home or charitable home for the aged, or independent health facility.
While interest in the impact of outdoor smoking has been increasing, few studies have specifically measured levels of tobacco smoke from multiple sources at entrances to public buildings in a real-world setting. The primary objective of this study was to determine the extent of SHS at entrances to buildings by comparing real-time levels of tobacco smoke outside and inside office building entrances during smoking and non-smoking conditions.
Methods
Real-time levels of particulate matter (PM2.5; air pollutant particles with a diameter of 2.5 μm or less), employed as a marker for SHS, were measured inside and outside 28 commercial and corporate office building entrances in the central business district (CBD) of Toronto during May and June 2008. With a population of over 2.5 million residents, the city of Toronto is the largest urban centre in Canada and its CBD is comparable to other large international cities.23 Office buildings in downtown Toronto were inventoried and a short list was identified that included the following criteria: at least five floors to ensure that the entrances were well used, a similar distance from the entrance to the street to ensure that exposure to passing traffic was comparable among sites, and no direct access to indoor food courts or other hot food preparation areas to minimise contamination from cooking aerosols. None of the buildings had automatic sliding doors that would be accidentally triggered by the data collectors. Over half (57%) of the doors consisted of a manual revolving door with hinged casement doors on either side. The remaining 43% consisted of casement doors only. A total of 39% of the entrances had an exterior and interior door. While there are no legislated outdoor smoking restrictions at entrances to office buildings in Toronto, 6 of the 28 entrances had posted voluntary signs asking people to refrain from smoking at the doorway.
TSI SidePak AM510 Personal Aerosol Monitors24 were used to sample and record the levels of PM2.5 in the air following the indoor air monitoring protocol developed for the Global Air Monitoring Study,25 which we modified for outdoor use. The SidePak uses a built-in sampling pump to draw air through the device where the particulate matter in the air scatters the light from a laser. Based on the amount of light scattered, the device displays the real-time concentration of particles in mg/m3. In data analysis, this unit was converted to μg/m3 (ie, multiplied by 1000). The monitor was fitted with a 2.5 μm impactor and the flow rate was set at 1.7 litres/min, to measure the concentration of particulate matter less than 2.5 μm (PM2.5). These ‘fine particles’ are released in large quantities from burning cigarettes and are an established indicator of tobacco smoke.5 26 27 The SidePak measures particle concentrations once every second. We set the equipment to a 10 s log interval, which averages the previous 10 1 s data points. A standard calibration adjustment factor of 0.32 was applied to the raw data to correct for the properties of SHS. This factor has been established by various investigators through collocation of SidePak monitors and gravimetric filter samplers.5 28 Before each data collection session the SidePak was charged, cleaned and zero-calibrated in accordance with the manufacturer's specifications.
Unobtrusive air quality measurements at each of the 28 building entrances were taken in 30 min sessions to capture different levels of smoking within 9 m of building entrances. The approximate 9 m distance from the entrance was measured during the previous site inventories and, through practice, the data collectors were able to estimate distance within approximately 1 m. We conducted our measurements between 8:30 and 16:00, when the buildings were most likely to be accessed by the public. Two trained data collectors each carried a monitor in a backpack with the air intake tube positioned at shoulder height (approximately 1.5 m above the ground). One data collector stood inside the entrance within 2 m of the interior doors and the other simultaneously stood outside the entrance within 2 m of the exterior doors.
The following observational data were also recorded at 5 min intervals throughout each measurement session in a time-log synchronised with the monitors: number of lit cigarettes within 9 m of the entrance, distance from the nearest lit cigarette to the outdoor monitor, number of door openings, and strength and direction of wind. Assuming that it normally takes more than 5 min to smoke an average cigarette, a 5 min interval ensured that we did not miss any lit cigarettes. The first count was taken at the start of the 30 min session (0 min) then every 5 min, resulting in at least seven counts per session. If a cigarette was lit between intervals, this was noted in the log and included in the count at the next 5 min interval. Wind direction and strength were subjectively measured by observing the direction and distance a tissue travelled when dropped. While not as accurate as the use of an anemometer, this method was less conspicuous. Passing trucks and buses or idling vehicles were also noted in the log as they occurred. Where possible, the data collectors noted any smoking that occurred beyond 9 m from the entrance in the data log.
Background levels of PM2.5 were measured in nearby outdoor spaces that matched street type and distance from traffic, and where smoking was not present within 30 m, either immediately before or after each session. Our background levels were comparable to ambient air quality levels for downtown Toronto obtained from the Ontario Ministry of the Environment that corresponded to our data collection period. Following each session, the measurements were downloaded to a laptop computer for data management and analysis using TrakPro Data Analysis Software V.3.6.0 (TSI, St Pauls, Minnesota, USA).29
Time-weighted average and median PM2.5 levels were calculated for indoor and outdoor conditions by the number of lit cigarettes. A mixed model analysis was also used to compare levels of PM2.5 by the number of lit cigarettes, taking into account the repeated measures design. Mixed model analyses of outdoor levels were adjusted for wind direction (towards entrance, across entrance and unpredictable; compared to no wind) and strength (little, mild and strong; compared to no wind), and distance (in metres) from the nearest lit cigarette to the monitor. Similarly, indoor levels were adjusted for outdoor wind direction and strength, distance (in metres) from the nearest lit cigarette to the entrance, distance (in metres) from the indoor monitor to the entrance and number of door openings. In the mixed model analysis, natural log-transformed data were used to obtain Normal distributions. All analyses were conducted using SAS V.9.1 (SAS, Cary, North Carolina, USA).30
Results
Descriptive analyses
Table 1 shows average and median levels of PM2.5 for the background, outdoor and indoor conditions by the number of lit cigarettes within 9 m of the entrance. Median levels of PM2.5 were the same for background (8.0 μg/m3) and outdoor conditions (8.0 μg/m3) when no lit cigarettes were present. However, the median outdoor levels of PM2.5 increased with 1–4 (11.0 μg/m3) and 5+ (16.0 μg/m3) lit cigarettes. Outdoor maximum levels were as high as 496 μg/m3 (raw data, 10 s average) when smoking was present. Median indoor levels of PM2.5 were lower than the outdoor background level with minimal variation, regardless of the number of lit cigarettes outside the entrance.
Outdoor and indoor PM2.5 (μg/m3) by level of lit cigarettes, raw data (10 s average), Toronto Doorway Study, May to June 2008
Table 2 shows statistics using outdoor 10 s average values of PM2.5 (μg/m3) by level of lit cigarettes and location of the monitor in relation to the nearest lit cigarette. The median outdoor PM2.5 level increased with the level of lit cigarettes from 8.0 μg/m3 with no lit cigarettes to 19.5 μg/m3 with 5+ lit cigarettes, but was not associated with the distance between the monitor and the nearest lit cigarette within 9 m of entrances. People passing by entrances could be exposed to a 2.5-fold higher level of PM2.5 with ≥5 lit cigarettes than the background level, even if the lit cigarette was 3 m away.
Outdoor PM2.5 (μg/m3) by level of lit cigarettes and location of the monitor, raw data (10 s average), Toronto Doorway Study, May to June 2008
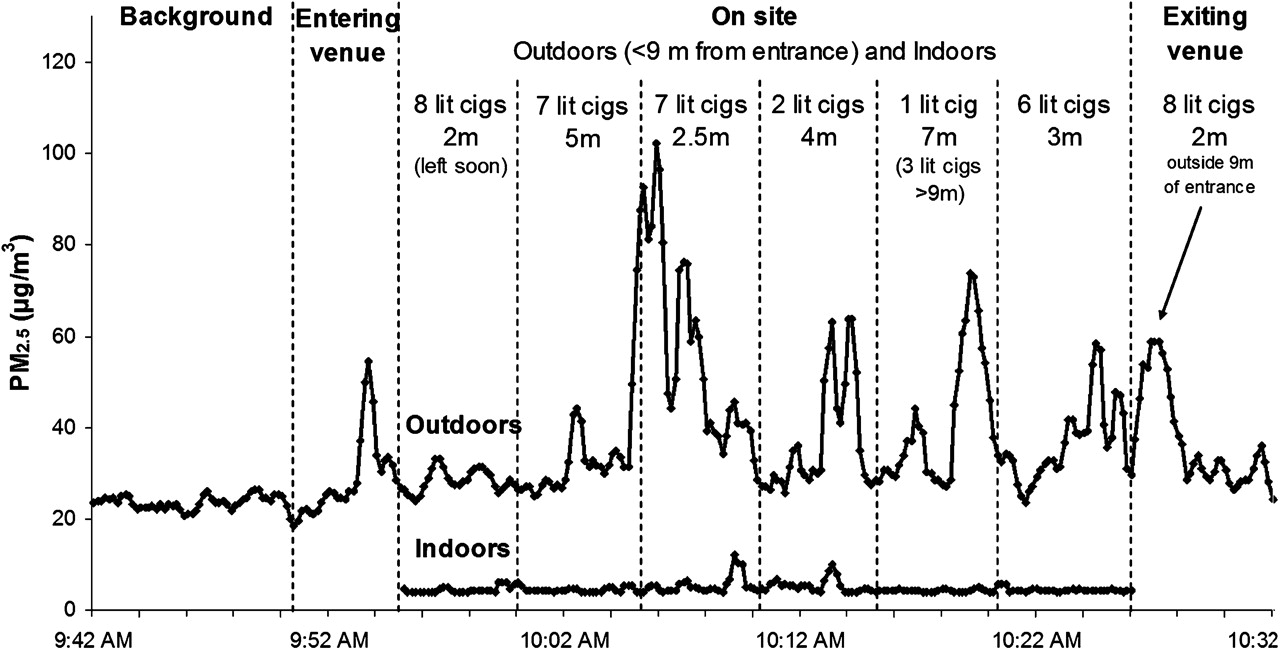
Figure 1 presents a single background and onsite measurement session to demonstrate real-time plots of PM2.5 (30 s moving average) outside and inside an office building. Outdoor background levels of PM2.5 ranged from 19 to 29 μg/m3 prior to entering the site, then increased to 55 μg/m3 as the monitor was transported into the 9 m area outside the entrance. Once the monitor was positioned within 1–2 m outside the doors, the levels of PM2.5 peaked with the presence of 1–8 lit cigarettes within the 9 m area. The highest peak level was 102 μg/m3and did not drop below background levels during the 30 min measurement period. The peak levels continued as the machine was removed from the site due to the presence of eight lit cigarettes just outside the 9 m measurement area, then levelled off close to the background level. Levels of PM2.5 for the simultaneous indoor condition remained below the outdoor background level throughout the measurement session.

PM2.5 (μg/m3) levels inside and outside the entrance to a Toronto office building (30 s moving average), 6 June 2008 (with minimum wind). Background mean: PM2.5 23.4 μg/m3; outdoor (within 1–2 m of building entrance) mean: PM2.5 38.9 μg/m3; indoor mean: PM2.5 4.7 μg/m3. Metres (eg, 2 m or 5 m) refers to the distance between the nearest lit cigarette and monitor. Trucks and/or buses were passing by or idling constantly for background and on-site measurements.
Mixed model analyses
Table 3 shows mixed regression model analyses of log-transformed PM2.5 (μg/m3). For outdoor measures, PM2.5 levels were significantly higher compared to background levels (model 1). Further, outdoor levels were significantly higher when there was smoking compared to no smoking <9 m from the entrance (model 2), and the PM2.5 levels increased with the level and numbers of lit cigarettes (models 3 and 4). The adjusted analysis confirmed these associations and found that the distance between the nearest lit cigarette and outdoor monitor was negatively associated with the outdoor PM2.5 levels. However, this was not the case in the linear trend model, when each number of lit cigarettes was entered into the model. Wind direction and strength were not associated with outdoor PM2.5 levels. (Data on covariates are not shown).
Mixed effects model analysis of PM2.5, using natural log-transformed data based on 10 s average raw data, Toronto Doorway Study, May to June 2008
For indoor measures, PM2.5 levels were lower than the outdoor background level (model 1). In the adjusted mixed model analysis, indoor PM2.5 was not associated with outdoor smoking (models 2–4). However, indoor PM2.5 was positively associated with outdoor PM2.5 and negatively associated with the distance between the indoor monitor and building entrance. Wind direction and strength, and number of door openings were not associated with indoor PM2.5. Median indoor levels of PM2.5 were slightly higher in buildings with an additional set of interior doors (6.0 μg/m3) than in buildings with exterior doors only (5.0 μg/m3). However, in the adjusted analysis, there was no significant difference in indoor PM2.5 between door types (data not shown).
Discussion
Outdoor levels of secondhand smoke
Our results demonstrate that levels of outdoor tobacco smoke increased with the number of lit cigarettes within 9 m of building entrances. Similarly, Klepeis et al suggests that the distance at which outdoor tobacco smoke is detectable is likely to increase as the number of active cigarettes increases.5 We did not find a statistically significant association between PM2.5 levels and the distance between the nearest lit cigarette and the monitor, when the number of lit cigarettes was included in the linear trend model; however, we did find a significant negative association when the level of lit cigarettes (0, 1–4, 5+) was included in the models. This is also consistent with findings of Klepeis et al, who observed a clear reduction in levels of outdoor tobacco smoke particle concentrations with increased distance from a tobacco smoke source. The discrepancy in our two models may be a result of wind inconsistency at the measurement sites. Levels of outdoor tobacco smoke are highly dependent on wind conditions, with upwind levels likely to be very low and downwind levels likely to be high.5 While we adjusted for wind strength and direction in the analyses, these measures were subjective and not as reliable as instrumental measures.
Although we found a negative association between PM2.5 levels and the distance between the nearest lit cigarette and the monitor in our mixed model analysis, based on the unadjusted analysis (table 2), the average levels of exposure were comparable whether the monitor was within 1.5 m or over 3 m away from the nearest lit cigarette.
Indoor measures of secondhand smoke
There is evidence in the literature that outdoor tobacco smoke can infiltrate indoor environments.31 32 Our average indoor levels of PM2.5 were positively associated with outdoor PM2.5 levels, suggesting that some tobacco smoke may have drifted inside the entrance. However, average indoor levels of PM2.5 were lower than the outdoor background levels and not associated with the presence of lit cigarettes.
Although 40% of the sampled sites had an additional set of interior doors, there was only a slight difference in average indoor levels of PM2.5 compared to sites with exterior doors, and no significant difference in the adjusted analysis. Thus, the double interior door configuration did not appear to be a factor in the migration of tobacco smoke. Further research is required to better understand the movement of tobacco smoke between outdoor and indoor environments, including the role of doorway design, air vents, and differences between outside and inside air pressure and temperature.
Implications for health
There is a growing body of evidence linking short-term exposure to tobacco smoke with immediate health impacts on non-smokers. The 2009 Institute of Medicine report on Secondhand Smoke Exposure and Cardiovascular Effects concluded that even brief exposure to SHS could trigger a heart attack.6 Exposure to SHS for as little as 30 min has been found to lead to sustained vascular injury among non-smokers,14 and 2 h of exposure altered cardiac autonomic function.15 These studies used only a single exposure in indoor environments, whereas people entering and exiting buildings when smoking is present may be exposed to high levels of tobacco smoke over weeks, months or even years; although each time the exposure may be brief. Evidence is unclear on the health effects of cumulative brief exposure to PM2.5 over long periods of time compared to lengthier one-time daily exposure to high levels of PM2.5. Furthermore, since SHS contains many hazardous gas-phase compounds in addition to fine particles, consideration of PM2.5 exposures by themselves may lead to an underestimate of health impact.
In addition to the effects of short-term SHS exposure on the circulatory system, there is evidence that brief exposure to tobacco smoke can trigger an asthma attack in children.3 Research on the effects of tobacco smoke exposure on adult asthma symptoms is lacking in comparison. However, adults frequently report tobacco smoke as a trigger for asthma symptoms,33 34 and evidence suggests a causal relationship between SHS exposure and exacerbation of asthma among adults.35 The US Surgeon General recommends that individuals with predisposing asthma take special precautions to avoid exposure to SHS, as they are at especially high risk for ill effects.3
Although the outdoor peak values of PM2.5 observed in the current study were not averaged over 24 h, it is useful to place our findings within the context of an established air quality guideline. We found maximum 10 s outdoor levels of tobacco smoke as high as 496 μg/m3 when smoking was present, falling within the ‘hazardous’ range on the US Environmental Protection Agency (EPA) Air Quality Index (AQI).36
Seasonal variation
Weather influences smoking behaviour, with smokers typically standing closer to building entrances in inclement weather (eg, wind, rain, cold), and seeking more exposed spaces to smoke when the weather is pleasant.37 Our measurements were taken during milder months of the year (May and June), when temperatures varied from 8.8°C to 30.3°C (47.8°F to 86.5°F), and likely underestimate the numbers of smokers and levels of PM2.5 at these sites during colder months. This was tested by Thomas et al who found that PM2.5 levels were higher, and more lit cigarettes were observed closer to building entrances, when temperatures ranged from –9.8°C to 4.8°C (14.4°F to 40.6°F).38
Implications for policy
In addition to protecting non-smokers from exposure to tobacco smoke, there are other beneficial implications of smoke-free policies. There is consensus in the literature that workplace smoking policies lead to reduced cigarette consumption among continuing smokers.39–41 Such policies are also associated with higher rates of quit attempts and lower rates of relapse in smokers who attempt to quit because of reduced cues for smoking.40–42 While these studies are primarily based on indoor smoking restrictions, outdoor restrictions at building entrances may have similar benefits. If smoking is made inconvenient and socially unacceptable in these locations, some smokers may cut back or quit. Indeed, in recent years there has been a shift in public support for smoking restrictions in different types of outdoor locations, such as restaurant patios, entrances to buildings and areas frequented by children.43
However, such restrictions may move smoking to other outdoor locations, such as sidewalks, and continue to expose passers by.37 Further research on the impact of outdoor smoking restrictions on smoking behaviour would help to anticipate and plan for unintended consequences.
Some office buildings in downtown Toronto have begun to introduce voluntary (non-legislated) smoke-free policies at their entrances. However, such restrictions are more difficult to enforce, and their signage and rules (eg, required distances) are often inconsistent. Legislating doorway restrictions would provide consistency and easier enforcement, and convey a message about the inappropriateness of smoking in places where non-smokers are regularly exposed.
For places that have not yet adopted indoor smoking restrictions, outdoor spaces could be included as part of a comprehensive smoke-free policy. The WHO's Framework Convention on Tobacco Control (FCTC) provides rationale for adopting outdoor smoke-free policies. Section 24 and 27 of the Guidelines on Article 8 refer to protection from exposure to tobacco smoke in ‘outdoor and quasi-outdoor’ public places ‘where appropriate’.44 The guidelines go on to suggest that ‘Parties should consider the evidence as to the possible health hazards in various settings and should act to adopt the most effective protection against exposure wherever the evidence shows that a hazard exists’.
Limitations
Some inconsistencies in the data may have resulted from the unpredictable and variable nature of a naturalistic approach compared to a controlled experimental approach. While the monitor remained within 1–2 m of the doorway for each of the measurement sessions, there was some movement within this range to avoid interfering with the behaviour of people using the site. Also, smoking beyond the 9 m measurement area may have impacted the levels of PM2.5, depending on wind direction. While we attempted to use building entrances that were as similar as possible (eg, distance from the street, traffic patterns, doorway configuration) they were not identical and any differences may have contributed to variation in the data. Using a naturalistic approach, however, allowed us to capture real-world smoking behaviours and resulting levels of PM2.5, that people would likely be exposed to when entering and exiting buildings.
To ensure that the data collectors remained unobtrusive, we used subjective measures for traffic and wind intensity that are less accurate than objective measures. In our analysis, we controlled for the potential effects of these factors. However, future studies may consider using more objective measures. Further, PM2.5 is not specific to tobacco smoke; dust and vehicle fumes are also a source of fine particulate matter. We controlled for this by measuring background PM2.5 and selecting sites that had similar traffic flow patterns.
Conclusions
Restricting legislation to indoor public spaces is insufficient to protect non-smokers from SHS. Our study demonstrates that average levels of PM2.5 outside 28 entrances to buildings with ≥1 lit cigarettes present was more than twice as high as average levels of background air pollution. Further, 10 s peak levels of PM2.5 were as high as 496 μg/m3 with lit cigarettes present. Considering that there is no safe level of SHS, our findings support the implementation of smoke-free policies at entrances to buildings to protect people who are entering and exiting from exposure to tobacco smoke. This will also contribute to changing social norms about the acceptability of smoking. Future research should investigate the health impact of cumulative levels of tobacco smoke exposure experienced by those who regularly use public buildings.
What this paper adds
This paper provides real-time data on levels of tobacco smoke (PM2.5; air pollutant particles with a diameter of 2.5 μm or less) inside and outside entrances to office buildings during smoking and non-smoking conditions in a real-world setting.
The average outdoor level of PM2.5 was significantly (2.5 times) higher than background level (no smoking present) and increased with the number of lit cigarettes.
Peak levels of PM2.5 were more than three times as high (up to 496 μg/m3) when smoking was present compared to when smoking was not present.
Restricting legislation to indoor public spaces only is insufficient to protect non-smokers from tobacco smoke.
Acknowledgments
Data collection was coordinated by the Research Services Unit (RSU), Dalla Lana School of Public Health, University of Toronto. Thank you to all of the research assistants who helped with data collection and management: Jacqueline Gillespie, Mireille Kaprilian, Jigisha Patel and Andrew Thomas.
References
Footnotes
Funding This research was funded by a partnership under the coordination of the Canadian Tobacco Control Research Initiative (CTCRI; http://www.ctcri.ca). This work was undertaken at the Ontario Tobacco Research Unit, which receives funding from the Ontario Ministry of Health Promotion and Sport.
Provenance and peer review Not commissioned; externally peer reviewed.