


Abstract
Little is known about the descriptive epidemiology of androgen deficiency. In this study, we sought to address this issue by providing estimates of the crude and age-specific prevalence and incidence rates of androgen deficiency in a randomly sampled population-based cohort of middle-aged and older men. Data on androgen deficiency (defined using both signs/symptoms plus total and calculated free testosterone) were available for n = 1691 (baseline) and n = 1087 (follow-up) men from the Massachusetts Male Aging Study. Crude and age-specific prevalence and incidence rates were calculated. Based on these estimates, projections for the number of cases of androgen deficiency in the 40- to 69-yr-old U.S. male population were computed. Estimates of the crude prevalence of androgen deficiency at baseline and follow-up were 6.0 and 12.3%, respectively. Prevalence increased significantly with age. From baseline age-specific prevalence data, it is estimated that there are approximately 2.4 million 40- to 69-yr-old U.S. males with androgen deficiency. The crude incidence rate of androgen deficiency was 12.3 per 1,000 person-years, and the rate increased significantly (P < 0.0001) with age. Based on these incidence data, we can expect approximately 481,000 new cases of androgen deficiency per year in U.S. men 40–69 yr old.
ANDROGEN DEFICIENCY IN the elderly male is considered a syndrome that is characterized by the presence of defined signs/symptoms in conjunction with low testosterone levels (1). For years, there has been major disagreement on how to define the syndrome for clinical and epidemiologic research purposes. Investigators have generally taken two approaches; one is purely statistical, whereas the other is clinical. The statistical approach consists of defining androgen deficiency with the use of testosterone measurement and choosing percentile cut-off values (e.g. 2.5th percentile) from young normal males to determine prevalence [see e.g. Harman and colleagues (2) and Vermeulen and Kaufman (3)]. The essential problem with this statistical approach is that men with low testosterone levels may not exhibit clinically significant symptomatology. In contrast, the clinical approach relies on symptom questionnaires [e.g. the Androgen Deficiency in the Aging Male (ADAM) questionnaire (4)]. However, available screening instruments tend to have low specificity (i.e. a number of men with symptoms may have normal testosterone levels) because of the nonspecific nature of the signs/symptoms associated with the syndrome. The well-known ADAM questionnaire has 88% sensitivity and 60% specificity (4). A screener from the Massachusetts Male Aging Study (MMAS) has 76% sensitivity and 49% specificity (5). Thus, available operational definitions have considerable measurement error. As a result, estimates of prevalence may not be accurate, and correlational studies may lack the statistical power necessary to detect associations between suspected risk factors and androgen deficiency. The goal of any operational definition should be to reduce such measurement error. Recent statements by the Second Annual Andropause Consensus Meeting (1) and other leading scientists in this area [e.g. Matsumoto (6)] have argued for combining these two approaches (i.e. using signs/symptoms plus testosterone measurement). Such an approach may result in a measure of androgen deficiency that has less random error.
As a result of the confusion regarding how to operationally define androgen deficiency, we lack data on its descriptive epidemiology. To our knowledge, there are no population-based estimates of the prevalence of androgen deficiency as defined by both clinical signs/symptoms and testosterone levels. However, available data suggest that the prevalence of low testosterone (i.e. not considering signs/symptoms) in older men is around 20% (2, 3, 5, 7) and that prevalence increases with age. Estimates of the incidence (i.e. onset of the syndrome among initially well individuals) of androgen deficiency are nonexistent.
The purpose of the present study is to address these issues. Employing an operational definition of androgen deficiency that incorporates both signs/symptoms plus total and calculated free testosterone measurements, we sought to provide estimates of the crude and age-specific prevalence and incidence rates of androgen deficiency in a randomly sampled population-based cohort of middle-aged and older men.
Subjects and Methods
Study sample
The MMAS is an observational cohort study of health in a population-based random sample of men. The design has been described previously (8, 9). Briefly, communities in the Boston, Massachusetts area were randomly selected with probabilities proportional to the population, within each of six strata defined by community size and median income. Men born between 1917 and 1946 were drawn at random from the annual state census list, with sampling fractions adjusted to produce a uniform distribution between ages 40–70 yr. A total of 1709 respondents (52%) enrolled in the study and completed the baseline (1987–1989; T1) protocol. The response rate reflected, in part, the requirements for early-morning phlebotomy (to obtain basal hormone levels) and an intensive in-person interview in a population-based sample. Participants received no financial incentive at T1.
The follow-up (T2) phase of MMAS was conducted from 1995–1997 (average follow-up interval, 8.8 yr; range, 7.0–10.4 yr). During this phase, men who were interviewed at T1 who were still alive, had not moved out of the country, and were not seriously ill were eligible for interview. Of the original 1709 respondents, 180 were confirmed deceased by death certificate, five resided outside the United States, and 28 were seriously ill, leaving 1496 eligible. Of these, 1156 completed a T2 interview (77% conditional response rate). Participants received a $50 financial incentive at T2.
The field protocol for MMAS has been previously described (8). Briefly, a trained field technician/phlebotomist visited each subject in his home, administered a health questionnaire, and obtained two nonfasting blood samples. Height, weight, and blood pressure were measured according to standard research protocols developed for large-scale fieldwork (10). Age, race, education and income level, and marital and employment status were noted. MMAS received institutional review board approval, and all participants gave written informed consent.
Hormone measurements
Gray et al. (11) have shown that features of the research design (e.g. time of day of blood sampling; method of analysis) and the sample (e.g. volunteers vs. patients) are related to testosterone levels. The design of MMAS accounted for these issues. Nonfasting blood samples were drawn within 4 h of the subject’s awakening, to control for diurnal variation in hormone levels (12). Two samples were drawn 30 min apart and pooled for analysis in equal aliquots to smooth episodic secretion (13). Blood was kept in an ice-cooled container for transport and centrifuged within 6 h. Serum was stored in 5-ml scintillation vials at −20 C, shipped to the laboratory within 1 wk by same-day courier, and stored at −70 C until time of assay.
Hormone assays were performed by C.L. at The Endocrine Laboratory at the University of Massachusetts (UMASS) Medical School. Total testosterone was measured by RIA kit (Diagnostic Products Corp., Los Angeles, CA). Intraassay coefficients of variation were 5.4% at T1 and 5.8% at T2. Interassay coefficients of variation were 8.0% at T1 and 9.0% at T2. Stored T1 samples were reassayed for total testosterone in 1994, whereas T2 samples were assayed shortly after blood collection. Sixty serum samples from T1 and T2 were reassayed for total testosterone in 2000 in the same batch. A structural equation model, equivalent to a Deming regression, showed negligible change due to assay drift or storage. SHBG was measured by RIA using kits by the same manufacturer at T1 and T2, although distributors changed (T1, Farmos Diagnostica, Farmos Group LTD, Oulunsalo, Finland; T2, Orion Diagnostica, Espoo, Finland). Intraassay coefficients of variation were 8.0% at T1 and 4.5% at T2. Interassay coefficients of variation were 10.9% at T1 and 7.9% at T2. Percentage of free testosterone was calculated according to the method of Södergard (14). Data from Vermeulen et al. (15) indicate excellent correspondence between free testosterone calculated by this method and apparent free testosterone concentration obtained by equilibrium dialysis. Free testosterone concentration was calculated as (total testosterone) × (percentage free testosterone × 0.01). The reference range for free testosterone concentration (8.91–31.24 ng/dl; 0.3092–1.0841 nmol/liter) by the method of Södergard was estimated as the 2.5th and 97.5th percentiles for free testosterone in n = 492 Caucasian males, 20–29 yr of age, from the CARDIA Male Hormone Study (16). Note that using the same approach, the young normal reference range for total testosterone in these men from the CARDIA Male Hormone Study is 301-1092 ng/dl (10.44–37.89 nmol/liter). Assays from the CARDIA Male Hormone Study were analyzed in the same laboratory at UMASS. Total testosterone was measured by the same kits in MMAS and the CARDIA Male Hormone Study; SHBG was measured by chemiluminescent enzyme immunometric assay with Immulite from Diagnostic Products Corporation in the CARDIA Male Hormone study. This difference in assay method for SHBG should have minimal impact on computation of reference ranges, because C.L.’s laboratory performed validation studies using samples that were analyzed with both the old and new assays. Results from the old assay were replicated using the new assay kit.
Androgen deficiency—operational definition
Our operational definition of androgen deficiency is based specifically on a diagnostic algorithm outlined in a recent statement from the Second Annual Andropause Consensus Meeting (1). This algorithm was independently reviewed and approved by the Clinical Affairs Committee of The Endocrine Society (1). This approach stipulates that signs/symptoms of low testosterone be used in conjunction with biochemical parameters (i.e. total testosterone and free and/or bioavailable testosterone) to define the syndrome. Such an approach aligns with recent work by others (6) and reflects the reality of clinical practice (i.e. seldom is a testosterone assay ordered in the absence of signs/symptoms of androgen deficiency).
The statement from the Second Annual Andropause Consensus Meeting identified a total of 12 signs/symptoms associated with low testosterone levels. It is unlikely that any extant database not designed specifically to examine this syndrome should include all 12 of these signs/symptoms. Fortunately, MMAS has data available on eight of the 12, including: 1) loss of libido; 2) erectile dysfunction; 3) depression; 4) lethargy; 5) inability to concentrate; 6) sleep disturbance; 7) irritability; and 8) depressed mood. Signs/symptoms not measured in MMAS included: 9) osteoporosis; 10) loss of muscle strength; 11) regression of secondary sex characteristics; and 12) decreased interest in activities. Table 1 shows information on the signs/symptoms available in MMAS.
Signs/symptoms of androgen deficiency available in the MMAS (Boston, MA, 1987–1997)
| Sign/symptom | MMAS measure used as indicator of sign/symptom | Reference period | Response options |
|---|---|---|---|
| Loss of libido | “How frequently do you feel sexual desire? This feeling may include wanting to have sexual experience (masturbation or intercourse), planning to have sex, feeling frustrated due to lack of sex, etc.” | None | Ordinal, 1–8 |
| Erectile dysfunction | 13-Item composite based on responses to a sexual activity questionnaire—see Kleinman, et al., 2000 (25 ) | None | Ordinal, 1–4 |
| Depression | Antidepressant medication use | Current | Binary |
| Lethargy | “I could not get going.” | Past week | Ordinal, 1–4 |
| Inability to concentrate | “I had trouble keeping my mind on what I was doing.” | Past week | Ordinal, 1–4 |
| Sleep disturbance | “My sleep was restless.” | Past week | Ordinal, 1–4 |
| Irritability | “I was bothered by things that usually don’t bother me.” | Past week | Ordinal, 1–4 |
| Depressed mood | “I felt depressed.” | Past week | Ordinal, 1–4 |
Presence of each individual sign/symptom was defined as follows: for 4-category ordinal variables (depressed mood, erectile dysfunction, inability to concentrate, irritability, lethargy, sleep disturbance), presence was indicated by any positive endorsement [e.g. the response options for lethargy were: 1) rarely or none of the time; 2) some or a little of the time; 3) occasionally or a moderate amount of the time; and 4) most or all of the time; lethargy was considered present if a respondent endorsed response option 2, 3, or 4]; for libido, which had eight categories, we defined presence of low libido as responses in the two lowest categories (one time per day or less); finally, depression was defined as current use of any antidepressant medication as part of a full medication inventory. We chose to use presence of any three or more of the eight available signs/symptoms as the number of signs/symptoms that would trigger testosterone measurement in a clinical setting.
A slightly modified version of the diagnostic algorithm outlined in the statement from the Second Annual Andropause Consensus Meeting appears in Fig. 1. Men were classified, according to their androgen deficiency status, by a hierarchy of information according to: 1) signs/symptoms; 2) total testosterone; and 3) free testosterone. Sample sizes at T1 and T2 for each node/decision (diamond) or terminator (rounded box) appear in Fig. 1. Men were considered to have androgen deficiency if they met one of the following two conditions: 1) at least three signs/symptoms and total testosterone less than 200 ng/dl (6.94 nmol/liter); or 2) at least three signs/symptoms and total testosterone 200–400 ng/dl (6.94–13.88 nmol/liter) and free testosterone less than 8.91 ng/dl (0.3092 nmol/liter). Men were considered free of androgen deficiency if they met one of the following three conditions: 1) less than three signs/symptoms; 2) at least three signs/symptoms and total testosterone more than 400 ng/dl (13.88 nmol/liter); or 3) at least three signs/symptoms and total testosterone 200–400 ng/dl (6.94–13.88 nmol/liter) and free testosterone at least 8.91 ng/dl (0.3092 nmol/liter).
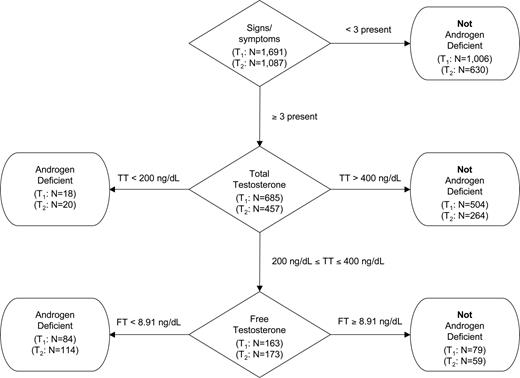
Operational definition of androgen deficiency. TT, Total testosterone; FT, free testosterone. To convert from ng/dl to nmol/liter, multiply by 0.0347.
Statistical analysis
Sufficient data were available for classification of androgen deficiency for n = 1691 men at T1 and n = 1087 men at T2. Estimates of the crude and age-specific prevalence of androgen deficiency at T1 and T2 were computed as the number of men with androgen deficiency divided by the total number of men with complete data. To compute crude and age-specific incidence rates of androgen deficiency, we limited the sample to men who were at risk of developing androgen deficiency (i.e. those not androgen deficient at T1). Incidence rates were calculated by dividing the number of new cases of androgen deficiency by the number of person-years at risk. For incidence calculations, the at-risk sample included 1020 men (9030 person-years) classified as not androgen deficient at T1 and who had complete androgen deficiency data at T2.
Ninety-five percent confidence intervals (CI) for prevalence were computed using the normal approximation to the binomial distribution; 95% CI for incidence rates were calculated under the assumption that the number of cases of androgen deficiency is a Poisson-distributed variable (17). The χ2 test of independence was used to test for relationships among categorical variables. To test for linear trend in proportions, we used the Cochran-Armitage trend test (18, 19). Likelihood ratio tests were used to test for differences in incidence rates by age (17). Nominal significance was determined by P < 0.05.
The number of existing prevalent cases and annual expected incident cases of androgen deficiency in men 40–69 yr old was estimated for the United States. The number of prevalent cases was estimated by multiplying the age-specific prevalence estimates from T1 times the number of men in each age group obtained from 2000 Census data (20). The sum of these products represents an estimate of the number of men with androgen deficiency in the specified population. For the annual number of incident cases expected, age-specific prevalence estimates from T1 data were used to determine the proportion of men free of androgen deficiency (i.e. at risk for developing androgen deficiency at T2) within each decade of age. For each age group, this proportion was multiplied by the number of men in the population obtained from 2000 Census data (20). The product represented the estimated number of U.S. men at risk for androgen deficiency within each decade of age. The number of men at risk was then multiplied by the age-specific incidence rates to obtain the annual expected number of new cases of androgen deficiency per year by age decade. Summing these yields an estimate of the total annual expected number of cases of androgen deficiency in 40- to 69-year-old men in the United States.
Results
Selected T1 characteristics of the full sample (n = 1,709) and analysis samples are displayed in Table 2. By design, an equal percentage of respondents in their 40s, 50s, and 60s were recruited at T1. The cohort was predominantly white, married, employed, had studied beyond high school, and had generally high household incomes. Comparison of men with complete androgen deficiency data at T1 (n = 1,691) (who form the analytic sample for T1 prevalence) to the men with incomplete T1 androgen deficiency data (n = 18), with exact methods, show that these two groups were similar on all demographics. There was considerable attrition in the sample from T1 to T2, which varied by these demographic characteristics as inspection of Table 2 indicates. The 1,156 men with follow-up at T2 were more likely to be young, white, married, employed, had higher education, higher incomes (all P < 0.001), compared with the remaining 553 men who did not have follow-up measurement.
Baseline demographic characteristics by study sample, MMAS (Boston, MA, 1987–1997)
| Baseline characteristic | Baseline (T1) | Follow-up (T2) | ||||||
|---|---|---|---|---|---|---|---|---|
| Full sample (n = 1709) | Completea T1 data (n = 1691) | Full sample (n = 1156) | At riskb for incident androgen deficiency (n = 1020) | |||||
| n | % | n | % | n | % | n | % | |
| Age group (yr) | ||||||||
| 40–49 | 564 | 33 | 561 | 33 | 421 | 36 | 383 | 38 |
| 50–59 | 565 | 33 | 558 | 33 | 410 | 35 | 375 | 37 |
| 60–70 | 579 | 34 | 572 | 34 | 325 | 28 | 262 | 26 |
| Race | ||||||||
| White | 1629 | 95 | 1613 | 95 | 1122 | 97 | 993 | 98 |
| Black | 52 | 3 | 51 | 3 | 19 | 2 | 15 | 1 |
| Other | 25 | 1 | 25 | 1 | 13 | 1 | 10 | 1 |
| Marital status | ||||||||
| Never married | 164 | 10 | 162 | 10 | 107 | 9 | 100 | 10 |
| Currently married | 1308 | 77 | 1297 | 77 | 912 | 79 | 803 | 79 |
| Divorced | 182 | 11 | 181 | 11 | 113 | 10 | 100 | 10 |
| Widowed | 54 | 3 | 51 | 3 | 24 | 2 | 17 | 2 |
| Currently employed | 1338 | 78 | 1328 | 79 | 987 | 85 | 887 | 87 |
| Education | ||||||||
| Less than high school | 194 | 11 | 190 | 11 | 97 | 8 | 81 | 8 |
| High school graduate | 294 | 17 | 290 | 17 | 181 | 16 | 155 | 15 |
| More than high school | 1220 | 71 | 1211 | 72 | 878 | 76 | 784 | 77 |
| Annual household income | ||||||||
| <$40,000 | 640 | 39 | 628 | 38 | 361 | 32 | 311 | 31 |
| $40,000–$79,999 | 689 | 42 | 687 | 42 | 502 | 44 | 441 | 44 |
| ≥$80,000 | 327 | 20 | 325 | 20 | 266 | 24 | 244 | 25 |
Subjects were considered to have complete data if they could be classified according to androgen deficiency status.
Subjects were considered to be at risk for androgen deficiency if they had complete T1 and T2 androgen deficiency data and did not have androgen deficiency at T1.
As shown in Table 3, at T1, 2.0, 23.3, and 74.7% of men had total testosterone levels less than 200 ng/dl (6.94 nmol/liter), 200–400 ng/dl (6.94–13.88 nmol/liter), and more than 400 ng/dl (13.88 nmol/liter), respectively (Table 3). At T2, these figures were 3.1, 36.2, and 60.8% (Table 3). The percent of men with low free testosterone (<8.91 ng/dl; 0.3092 nmol/liter) at T1 and T2 was 19.4 and 37.1%, respectively (Table 3). Also shown in Table 3 is the relationship between having three or more of any of the eight signs/symptoms and total and free testosterone level at T1 and T2. These data indicate that at T1 neither total nor free testosterone was significantly related to presence of three or more signs/symptoms (total, P = 0.3118; free, P = 0.0993). In contrast, both total and free testosterone were significantly related to presence of three or more signs/symptoms at T2 (total, P = 0.0421; free, P = 0.0122).
Number and percentage of men in each testosterone category by presence of 3+ signs/symptoms of androgen deficiency at baseline (T1) and follow-up (T2), MMAS (Boston, MA, 1987–1997)
| na | %a | 3 or more signs/symptomsb | |||
|---|---|---|---|---|---|
| n | % | P valuec | |||
| Baseline | |||||
| Total testosterone (ng/dl) | 0.3118 | ||||
| <200 | 34 | 2.0 | 18 | 2.6 | |
| 200–400 | 389 | 23.3 | 163 | 23.8 | |
| >400 | 1248 | 74.7 | 504 | 73.6 | |
| Free testosterone (ng/dl) | 0.0993 | ||||
| <8.91 | 324 | 19.4 | 146 | 21.3 | |
| ≥8.91 | 1346 | 80.6 | 539 | 78.7 | |
| Follow-up | |||||
| Total testosterone (ng/dl) | 0.0421 | ||||
| <200 | 32 | 3.1 | 20 | 4.4 | |
| 200–400 | 376 | 36.2 | 173 | 37.9 | |
| >400 | 632 | 60.8 | 264 | 57.8 | |
| Free testosterone (ng/dl) | 0.0122 | ||||
| <8.91 | 386 | 37.1 | 189 | 41.4 | |
| ≥8.91 | 654 | 62.9 | 268 | 58.6 | |
Number and percentage of subjects in each testosterone category (i.e., without considering sign/symptom data).
Number and percentage of subjects in each testosterone category, given presence of 3+ signs/symptoms.
Testing the null hypothesis of independence with χb test.
There were 102 cases of androgen deficiency at T1, yielding a crude prevalence of 6.0% (Table 4). At T2, the crude prevalence doubled to 12.3%. Also shown in Table 4 are age-specific prevalence estimates. The prevalence of androgen deficiency increased significantly with age at both observation periods (both P values for trend < 0.001). The age-specific prevalence appeared to increase slightly from T1 to T2. For example, among men in their 60s, prevalence of androgen deficiency was 9.4% and 11.5% at T1 and T2, respectively. By applying T1 age-specific prevalence data to the population of U.S. men 40–69 yr of age, we estimate that approximately 2.4 million men have androgen deficiency according to our operational definition (data not tabulated; available upon request).
Crude and age-specific prevalence of androgen deficiency at baseline (T1) and follow-up (T2), MMAS (Boston, MA, 1987–1997)
| Androgen deficiencya | |||||
|---|---|---|---|---|---|
| No. of cases | No. of men | % | 95% CIb | P valuec | |
| Baseline | |||||
| Crude | 102 | 1691 | 6.0 | 4.9, 7.2 | |
| Age-specific (yr) | 0.0002 | ||||
| 40–49 | 23 | 561 | 4.1 | 2.5, 5.7 | |
| 50–59 | 25 | 558 | 4.5 | 2.8, 6.2 | |
| 60–70 | 54 | 572 | 9.4 | 7.0, 11.8 | |
| Follow-up | |||||
| Crude | 134 | 1087 | 12.3 | 10.4, 14.3 | |
| Age-specific (yr) | <0.0001 | ||||
| 48–59 | 31 | 436 | 7.1 | 4.7, 9.5 | |
| 60–69 | 46 | 401 | 11.5 | 8.4, 14.6 | |
| 70–79 | 57 | 250 | 22.8 | 17.6, 28.0 | |
See Subjects and Methods for definition.
95% CI computed using the normal approximation to the binomial distribution.
Testing the null hypothesis of no age trend in prevalence with Cochran-Armitage test for trend.
As shown in Table 5, among the 1020 men at risk of developing androgen deficiency, there were a total of 111 cases of androgen deficiency during 9030 person-years of follow-up [crude incidence rate, 12.3 per 1000 person-years; 95% CI (10.2, 14.8)]. Incidence rates of androgen deficiency showed a significant dose-response relationship with age (P < 0.0001). Applying these age-specific incidence data to the population of U.S. men 40–69 yr of age, we estimate that there are approximately 481,000 new cases of androgen deficiency per year in this age group (data not tabulated; available upon request).
Crude and age-specific incidence rates (per 1000 person-years) of androgen deficiency, MMAS (Boston, MA, 1987–1997)
| Androgen deficiencya | |||||
|---|---|---|---|---|---|
| No. of cases | No. of person-years at risk | Incidence rate (/1000 person-years) | 95% CIb | P valuec | |
| Baseline | |||||
| Crude | 111 | 9030 | 12.3 | 10.2, 14.8 | |
| Age-specific (yr) | <0.0001 | ||||
| 40–49 | 20 | 3394 | 5.9 | 3.8, 9.1 | |
| 50–59 | 37 | 3316 | 11.2 | 8.1, 15.4 | |
| 60–70 | 54 | 2320 | 23.3 | 17.8, 30.4 | |
See Subjects and Methods for definition.
95% CI computed under the assumption that the number of cases of androgen deficiency is a Poisson-distributed variable.
Testing the null hypothesis of no age trend in incidence rates with likelihood ratio test.
Discussion
Summary
To our knowledge, this is the first population-based study to present prevalence and incidence data on androgen deficiency using a definition that incorporates both signs/symptoms and testosterone levels. The overall prevalence of androgen deficiency increased from T1 (6.0%) to T2 (12.3%). The age-specific prevalence increased slightly from T1 to T2. This could be due to random variability or to factors not examined in this report. Similar to prior work on the prevalence of low testosterone, we found that the prevalence of androgen deficiency was strongly related to age. Finally, the crude incidence of androgen deficiency was 12.3 per 1000 person-years, and it increased significantly with age.
Prevalence estimates of low testosterone obviously vary with the definition used or cutpoints employed, the population studied, and method of analysis used. Our estimates of the prevalence of androgen deficiency are lower than previously published estimates of low testosterone, which is most likely due to the more stringent nature of our operational definition. In fact, not considering signs/symptoms, 25.3% of men in the T1 sample had total testosterone levels less than 400 ng/dl (13.88 nmol/liter), which is comparable with prevalence estimates from other studies: 17.2–25% for values of total testosterone less than 300 ng/dl (10.14 nmol/liter) and less than 350 ng/dl (12.15 nmol/liter) (2, 3, 5, 7); 10% and 25%, respectively, in men aged 40–59 and 60–80 yr using free testosterone less than 6.5 ng/dl (0.2256 nmol/liter) (3); 25% using bioavailable testosterone less than 70 ng/dl (2.43 nmol/liter) (4); and 31% with one androgen deficiency symptom plus total testosterone less than 300 ng/dl (10.41 nmol/liter) (21). To our knowledge, no other study has estimated the incidence of androgen deficiency.
Potential limitations
Potential limitations to the current study should be noted. There are three issues related to the set of signs/symptoms used in this analysis. First, the observed associations between testosterone and signs/symptoms thought to be a manifestation of androgen deficiency are cause for concern. Despite finding a significant association between signs/symptoms and total and free testosterone at T2, neither total nor free testosterone was related to signs/symptoms at T1. These discrepant findings could be merely due to chance, or to the effect of some unmeasured variable. Several other possibilities (e.g. the set of symptoms we used is not appropriate for screening, there is too much overlap among these symptoms, or perhaps the signs/symptoms should be given unequal weights) might explain the lack of relationship at T1. Particularly appealing is the possibility that signs/symptoms should be given unequal weight in defining androgen deficiency (e.g. loss of libido might receive more weight than lethargy). The best approach to deriving such weights, however, is not entirely clear. Given these observations, it is doubtful that the manner in which we used the signs/symptoms available to us can be reliably employed in screening for androgen deficiency. Future investigations using the approach outlined by the Second Annual Andropause Consensus Meeting and employed by us (signs/symptoms plus testosterone) should consider using validated screening instruments to assess signs/symptoms.
Second, our set of signs/symptoms has not been formally validated as a screener for low testosterone. However, we selected signs/symptoms of low testosterone available in MMAS that were consistent with recommendations of the Second Annual Andropause Consensus Meeting (1), and these signs/symptoms are relatively consistent with those used in the validated ADAM questionnaire (4). Furthermore, it should be noted that three of the signs/symptoms of androgen deficiency used in the current analysis [low libido, erectile dysfunction, and lethargy (or reduced energy)] were those most commonly found in older men with low bioavailable testosterone on the ADAM questionnaire. In that study, Morley et al. (4) estimated the prevalence of low libido, erectile dysfunction, and reduced energy to be 48%, 61%, and 49%, respectively, among men with bioavailable testosterone less than 70 ng/dl.
Finally, we used three or more signs/symptoms (compared with one or two or some other number) to trigger testosterone measurement in our operational definition of androgen deficiency. The precise number of signs/symptoms needed to constitute a given medical problem remains a persistent issue in epidemiological and clinical research. Given that many of the signs/symptoms of androgen deficiency are nonspecific, multifactorially determined, and accompany normal aging (3), it is doubtful that clinicians would consider only one or even two signs/symptoms sufficient for testosterone screening. Likewise, it is unlikely that clinicians would require the presence of eight or 12 signs/symptoms to initiate testosterone screening. Indeed the length of many screening instruments may render them of limited utility in time-constrained practice settings. We chose a middle ground, opting for a combination of any three of the eight signs/symptoms included in the MMAS data as a reasonable approximation of what is likely to occur in an everyday clinical practice. As such, this potential limitation may actually be a strength of the study, but additional research on the number of signs/symptoms necessary to trigger testosterone measurement is clearly needed to make such judgment.
Our estimates from the MMAS may be conservative. First, the MMAS was mostly white and included men with generally high socioeconomic status, which was consistent with the racial and socioeconomic composition of Massachusetts males 40–69 yr of age at the time of survey (1980, 1990 Census). Second, there is a possibility for survivorship or attrition bias if those without follow-up were more likely to develop androgen deficiency. Analyses not shown reveal that after adjustment for age, T1 androgen deficiency status was unrelated to mortality (P = 0.3172), so estimates are not likely biased by survivorship. Finally, MMAS does not have all signs/symptoms of low testosterone identified in the statement from the Second Annual Andropause Consensus Meeting.
Strengths
There are several strengths associated with this study. These include a random, population-based sample of men from a defined geographic area, and the use of an operational definition that is based on the opinion of leading experts in the field of endocrinology. Our operational definition is clearly more reflective of clinical practice than a simple biochemical definition, which has been the most common method used to determine prevalence to date. Another strength of the present study is its longitudinal design. Thus, we are able to present incidence rates, which, unlike prevalence estimates, reflect risk of disease. The reference range data for free testosterone from the CARDIA Male Hormone Study are relatively consistent with previous studies, although the lower limit (8.91 ng/dl; 0.3092 nmol/liter) was somewhat higher than that reported in Swerdloff et al. (22) (3.5 ng/dl; 0.1215 nmol/liter), Amory et al. (23) (5.2 ng/dl; 0.1804 nmol/liter), Morley et al. (24) (5.2 ng/dl; 0.1804 nmol/liter), and Vermeulen and Kaufman (3) (6.5 ng/dl; 0.2256 nmol/liter). This is most likely the result of using young males, 20–29 yr old, as the reference population for free testosterone. Most investigators use 40 yr as the upper age limit. Use of this younger population is probably more appropriate because testosterone levels begin to decline after the third decade of life. Finally, laboratory variability is a major issue in longitudinal epidemiologic studies. We sought to limit artifactual changes in testosterone levels by performing testosterone measurements in the same laboratory at T1 and T2, following the same collection protocol at T1 and T2 and using the same or comparable laboratory assays at T1 and T2.
Conclusion
In conclusion, we provide data on the descriptive epidemiology of androgen deficiency. Prevalence estimates were similar to, though somewhat lower than, previous studies that estimated the prevalence of low testosterone. Incidence data are presented for the first time and show that, in addition to the estimated 2.4 million prevalent cases of androgen deficiency in U.S. men between the ages of 40 and 69 yr, we can expect approximately 481,000 additional cases of androgen deficiency annually in this population. MMAS has recently completed a third wave of data collection; future analyses will allow us to update these estimates in older men. Additionally, future analyses will include examination of the prevalence of this syndrome in a broader age range and by race/ethnicity from an ongoing epidemiologic study; the Boston-Area Community Health Survey includes a cohort of 3,000 Non-Hispanic black, Non-Hispanic white, and Hispanic Boston-area men 30–79 yr of age.
Acknowledgements
We are grateful to Dr. Susan Gapstur (Department of Preventive Medicine, Feinberg School of Medicine, Northwestern University, and Principal Investigator of the CARDIA Male Hormone Study) for providing us with the reference range data for free testosterone. The authors also appreciate the helpful comments of Dr. Frances J. Hayes (Reproductive Endocrine Unit, Massachusetts General Hospital), who reviewed this manuscript in draft form. Finally, special thanks to Charlene Franz at The Endocrine Laboratory (UMASS Medical School) for her efforts.
This work was supported by Grant AG 04673 from the National Institute on Aging and by Grants DK 44995 and DK 51345 from the National Institute of Diabetes and Digestive and Kidney Disorders. The CARDIA Male Hormone Study is supported by Public Health Service Grant R01-CA770403 from the National Cancer Institute, National Institutes of Health.
C.L. is deceased.
Abbreviations:
- ADAM,
Androgen Deficiency in the Aging Male;
- CARDIA,
Coronary Artery Risk Development in Young Adults;
- CI,
confidence interval;
- MMAS,
Massachusetts Male Aging Study;
- T1,
study phase conducted from 1987–1989;
- T2,
follow-up phase conducted from 1995–1997.
References
The Endocrine Society 2001 Summary from the 2nd Annual Andropause Consensus Meeting. The Endocrine Society, Chevy Chase, MD
McKinlay S, Kipp D, Johnson P, Downey K, Carelton R, A field approach for obtaining physiological measures in surveys of general populations: response rates, reliability and costs. Proc 4th Conference on Health Survey Research Methods, Washington, DC, 1984, p 195–204
United States Census Bureau 2002 Census 2000 summary file 3-United States/prepared by the U.S. Census Bureau
