


Abstract
Background: The post-acute burden of health care use after SARS-CoV-2 infection is unknown. We sought to quantify the post-acute burden of health care use after SARS-CoV-2 infection among community-dwelling adults in Ontario by comparing those with positive and negative polymerase chain reaction (PCR) test results for SARS-CoV-2 infection.
Methods: We conducted a retrospective cohort study involving community-dwelling adults in Ontario who had a PCR test between Jan. 1, 2020, and Mar. 31, 2021. Follow-up began 56 days after PCR testing. We matched people 1:1 on a comprehensive propensity score. We compared per-person-year rates for health care encounters at the mean and 99th percentiles, and compared counts using negative binomial models, stratified by sex.
Results: Among 531 702 matched people, mean age was 44 (standard deviation [SD] 17) years and 51% were female. Females who tested positive for SARS-CoV-2 had a mean of 1.98 (95% CI 1.63 to 2.29) more health care encounters overall per-person-year than those who had a negative test result, with 0.31 (95% CI 0.05 to 0.56) more home care encounters to 0.81 (95% CI 0.69 to 0.93) more long-term care days. At the 99th percentile per-person-year, females who tested positive had 6.48 more days of hospital admission and 28.37 more home care encounters. Males who tested positive for SARS-CoV-2 had 0.66 (95% CI 0.34 to 0.99) more overall health care encounters per-person-year than those who tested negative, with 0.14 (95% CI 0.06 to 0.21) more outpatient encounters and 0.48 (95% CI 0.36 to 0.60) long-term care days, and 0.43 (95% CI −0.67 to −0.21) fewer home care encounters. At the 99th percentile, they had 8.69 more days in hospital per-person-year, with fewer home care (−27.31) and outpatient (−0.87) encounters.
Interpretation: We found significantly higher rates of health care use after a positive SARS-CoV-2 PCR test in an analysis that matched test-positive with test-negative people. Stakeholders can use these findings to prepare for health care demand associated with post-COVID-19 condition (long COVID).
The public health effects of the COVID-19 pandemic are difficult to overstate.1 More than 600 million SARS-CoV-2 infections and 6.5 million deaths have been reported worldwide as of September 2022,2 which are likely gross undercounts as many infections go undetected.3
Long-term morbidity can be caused by SARS-CoV-2 infection.4–9 In the first pandedmic wave, as many as 27% of people admitted to hospital died or were readmitted within 60 days, and as many as 70% of people who were not admitted to hospital reported at least 1 symptom 4 months after infection.10,11 By the World Health Organization (WHO) definition, about 10%–20% of those infected acquire a post-COVID-19 condition (long COVID).12,13
Analysis of 10 prospective surveys and the medical records of 1.1 million patients with COVID-19 diagnosis codes before the emergence of the Omicron variant showed similar findings: 7.8%–17% had symptoms 12 weeks after self-reported COVID-19, with 1.2%–4.8% reporting debilitating symptoms.14 Estimates of long COVID vary by methodology (e.g., definitions of initial infection and timing of symptoms, timing of data collection), but risk is thought to be influenced by infection severity, type of variant, patient characteristics, vaccination15 and, potentially, previous infection.16 Because each new SARS-CoV-2 infection carries some risk of long COVID, everyone remains at risk for developing the condition.
Health care funders, policy-makers and clinicians need a clear understanding of the impact of long COVID on use of health care resources to allocate resources equitably now and plan for future needs.17 We sought to quantify the post-acute burden of health care use after SARS-CoV-2 infection among community-dwelling adults in Ontario.
Methods
Study design and data sources
We conducted a retrospective cohort study using ICES data.18 The data holdings at ICES are comparable to the Healthcare Cost and Utilization Project (HCUP) in the United States but are more inclusive, encompassing all care provided in hospitals or by physicians for the population of Ontario, with linked patient-level data (Appendix 1, Table E1, available at www.cmaj.ca/lookup/doi/10.1503/cmaj.220728/tab-related-content). These data sets were linked using unique encoded identifiers and analyzed at ICES.
We constructed a retrospective cohort of community-dwelling adults (≥ 18 yr) who underwent polymerase chain reaction (PCR) testing for SARS-CoV-2 between Jan. 1, 2020, and Mar. 31, 2021, in Ontario. We linked PCR test results to health care encounters, including outpatient, hospital-based and home care visits, which are reimbursed by the publicly funded health care system of Ontario. Physician services are administered by the Ontario Health Insurance Plan, which reimburses physician services for the 14.8 million residents of Ontario. We also linked PCR test results to clinical characteristics, mortality and other information such as the domains of the Ontario Marginalization Index:19 residential instability, material deprivation, dependency and ethnic concentration. Variable definitions and descriptions of source data sets are listed in Appendix 1, Table E1 and Table E2, respectively. All PCR tests were performed within, and reimbursed by, the health care system of Ontario.
For people with at least 1 positive PCR test result, we selected the index date to be the date of the first positive test. For people with several PCR test results and no positive test results, the index date was the last test date. We excluded people who died within 8 weeks (56 d) of their index date, were residing in long-term care facilities on their index date or who lacked valid date-of-birth, sex or death information.
Exposure and outcomes
We categorized people according to results of SARS-CoV-2 PCR testing as either test negative or test positive. We excluded pending or indeterminate test results (< 0.02%).
Our outcomes were health care encounters, assessed by type and overall: days in hospital, outpatient encounters (in person, by phone and virtual), home care visits (e.g., wound care), emergency department visits and days in a long-term care facility. For patients admitted to hospital or long-term care, we considered each day an encounter (e.g., a 6-d hospital admission was considered 6 encounters). In the overall analysis, we gave each encounter equal weight, so that 1 outpatient encounter received the same weight as 1 day in hospital or in long-term care. Followup began 8 weeks or later (≥ 56 d) after the index PCR test date, which we chose based on the duration of typical SARS-CoV-2 infectivity and acute symptoms.1,20–22 Follow-up ended on Sept. 30, 2021, or death, whichever occurred first.
Matching
We matched people with a positive SARS-CoV-2 PCR test result to those with only negative PCR test results by sex, test date, public health unit and a propensity score that comprised recent health care use, age, baseline sociodemographics and comorbidities, neighbourhood-level socioeconomic indices19 and vaccination status (Appendix 1, Table E2; morbidity measure, Johns Hopkins ACG System, Version 10).23 We matched on the logit of the propensity score to perform one-to-one matching with a caliper width equal to 0.05 times the standard deviation (SD) of the logit of the propensity score.24 We assessed balance after matching using standardized differences: we considered a standardized difference of less than 0.1 to indicate a good match.23,25
Statistical analysis
We conducted analyses at the patient level using SAS version 9.4. We reported baseline characteristics as means with SDs, medians and interquartile ranges (IQRs) or frequencies, as appropriate.
We used 2 different methods for summarizing the outcome for each person. First, for a given outcome (e.g., outpatient encounters), we computed the per-person-year rate of the outcome by dividing the number of encounters by the number of days at risk and then multiplying by 365 for each person. This produced the rate of encounters per year of follow-up (i.e., for a person with 2 outpatient encounters over a 6-mo period, the rate was 4 encounters per-person-year). Owing to the skewed distribution of health care use (i.e., a few people use a large number of resources), this process was used to compare the absolute difference in the mean, as well as the 99th percentile, of outcomes between the 2 groups. In the matched cohort, we computed the mean and 99th percentile of the per-person-year rate for types of health care encounters and overall in each group, and then computed their absolute difference. We constructed confidence intervals (CIs) using 1000 bootstrap replicates.26
Second, for a given type of health care encounter, we used the count of the number of encounters in negative binomial regression analyses. The time from the 8-week postinfection index date to the end of follow-up was the offset variable to denote each person’s time at risk for an outcome. These analyses estimated the relative difference in the rate of an outcome between groups. Using the count of the type of health care encounter, we fit a negative binomial model in the matched sample to determine the rate ratio, which compares the relative difference in the rate of health care encounters between test-positive and test-negative people (the sole independent variable in the model). We estimated the models using generalized estimating equations to account for the matched nature of the sample.27 This estimated the relative difference in the rate of health care use associated with test positivity. As the p value was less than 0.001 for a Z-test assessing the potential effect modification by sex,28–30 we stratified results by sex (nonstratified results are shown in Appendix 1).
We conducted 4 sensitivity analyses: follow-up that began after hospital discharge or 56 days, whichever occurred later, follow-up censored at entry into long-term care, follow-up censored at 6 months and all previous sensitivity analyses in a cohort also matched by hospital admission within 2 weeks after PCR testing. We also performed a final sensitivity analysis with matching by admission to an intensive care unit.
Ethics approval
This study was conducted at ICES, previously the Institute for Clinical Evaluative Sciences, an independent, nonprofit research institute that has legal status to collect and analyze health care and demographic data without consent for the purposes of health system evaluation and improvement. Therefore, no research ethics board approval is necessary.
Results
Between Jan. 1, 2020, and Mar. 31, 2021, more than 11 million SARS-CoV-2 PCR tests were completed for 3 777 451 unique adults in Ontario (Figure 1). Of the 3 631 040 people who were included in our study, 268 521 (7.4%) had a positive PCR test result for SARS-CoV-2, and mean followup was 240 (SD 88) days. Matching was successful for 99%; the matched cohort comprised 531 702 people. Demographics, clinical characteristics and standardized differences between test-positive and test-negative people for the matched and unmatched cohorts are reported in Table 1 and Appendix 1, Table E3, respectively. We found that sociodemographic and clinical characteristics were well balanced in the matched cohort. Compared with the unmatched cohort, the matched cohort was younger, had fewer females and people with lower incomes, was more urban and more ethnically diverse, a greater proportion underwent PCR testing during late 2020 or early 2021 and fewer were vaccinated (2% were vaccinated with at least 2 doses in the unmatched cohort, whereas only 0.5% were vaccinated in the matched cohorts).
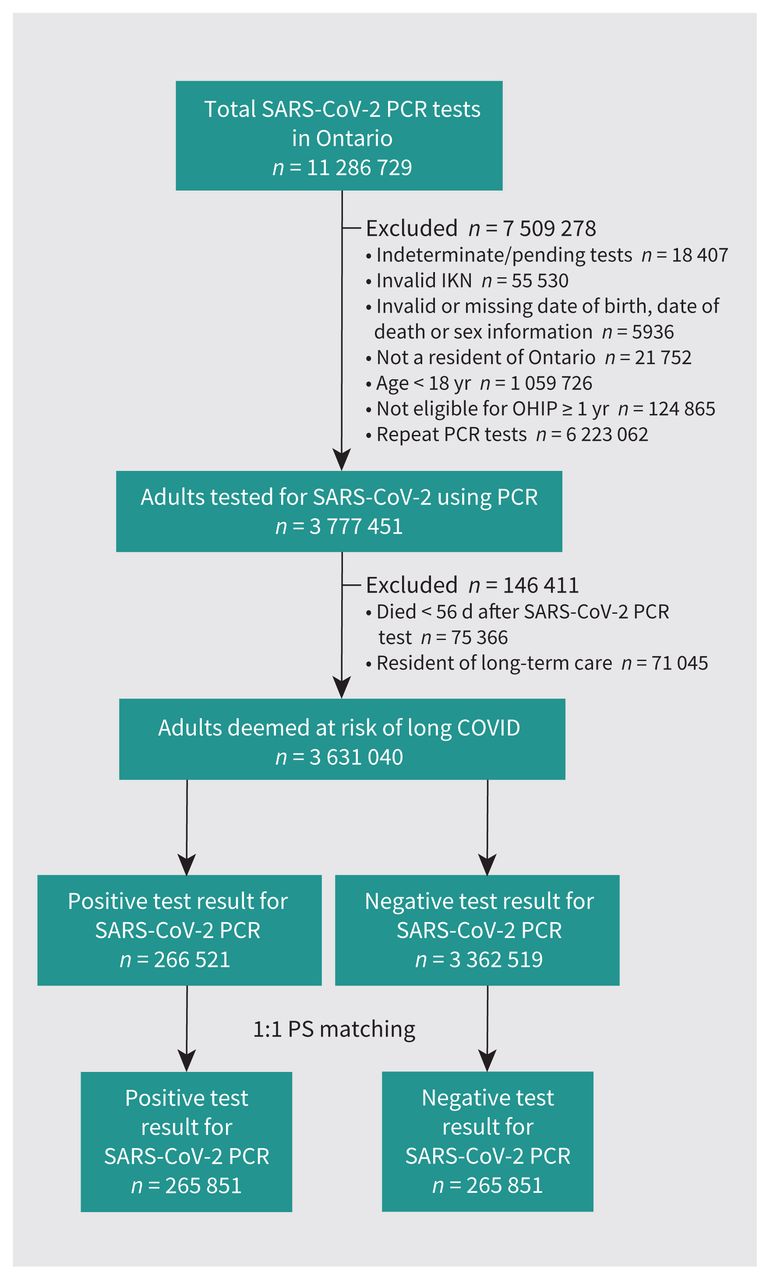
Flow chart of cohort construction. Note: IKN = ICES Key Number, OHIP = Ontario Health Insurance Plan, PCR = polymerase chain reaction, PS = propensity score.
Baseline demographic and clinical characteristics of the matched cohort*
In the matched cohort, mean age was 44 (SD 17) years, 51% were female and 0.6% had received 1 or more doses of SARS-CoV-2 vaccine. Six-month mortality was 0.5%, with no differences by PCR test result or sex.
Females
For the per-person-year rate of each type of health care encounter, we found that the absolute differences in mean person-year rates were significantly higher for test-positive females than for test-negative females for all encounter types, with the exception of emergency department visits (Table 2). The increase was greatest for long-term care days (0.81 d per-person-year), followed by outpatient encounters (0.49), days in hospital (0.36) and home care encounters (0.31). The absolute increase in total health care encounters at the mean was 2.0.
Absolute differences in per-person-year rates of health care encounters 56 days or more after a positive compared with negative polymerase chain reaction test result for SARS-CoV-2, stratified by sex*
At the 99th percentile of the per-person-year rate of each type of health care encounter (Appendix 1, Figure E1), test-positive females had an additional 28.37 more home care encounters perperson-year than their matched test-negative counterparts and had 6.48 additional days in hospital, with no significant difference in outpatient encounters, emergency department visits or long-term care days. The 99th percentile of total health care encounters was 56.7 higher in test-positive than in test-negative females.
In the negative binomial model using the count outcome summary, for test-positive versus test-negative females, we found that the rate ratio of the rate of long-term care days was 2.51 (95% CI 2.18 to 2.91), 1.48 (95% CI 1.37 to 1.58) for days in hospital, 1.07 (95% CI 1.01 to 1.13) for home care encounters and 1.06 (95% CI 1.05 to 1.07) for outpatient encounters. The rate of emergency department visits was not statistically different. For total health care encounters, the rate ratio was 1.14 (95% CI 1.11 to 1.16; Table 3).
Rate ratios for health care encounters 56 days or more after a polymerase chain reaction test for SARS-CoV-2 infection, stratified by sex*
Males
For the per-person-year rate of each type of health care encounter, the absolute differences in the mean per-person-year rate of health care use were significantly higher for test-positive than for test-negative males for all encounter types, with the exception of home care visits, which were lower (−0.43), and emergency department visits, which were not different (Table 2). We found that the increase was greatest for long-term care (0.48 d per-person-year), followed by days in hospital (0.47) and outpatient encounters (0.14). The absolute increase in total health care encounters at the mean was 0.66.
At the 99th percentile of the per-person-year rate of each type of health care encounter (Appendix 1, Figure E1), we determined that test-positive males had an additional 8.69 days in hospital per-person-year than their matched test-negative counterparts, whereas the decrease in home care visits was even greater at the 99th percentile (−27.31). There was no difference in emergency department visits or days in long-term care. The 99th percentile of total health care encounters was 39.27 higher for test-positive than for test-negative males.
In the negative binomial model using the count outcome summary, for test-positive males, we found that the patterns of relative increases in rates of health care use were similar to females (Table 3), with the exception of home care encounters, which were lower for test-positive males (rate ratio 0.89, 95% CI 0.83 to 0.95), despite similar mortality between sexes.
We report the absolute differences in per-person-year rates of health care use and rate ratios not stratified by sex in Appendix 1, Table E4.
Results of sensitivity analyses did not show much difference from the main results (Appendix 1, Table E5 and Table E6).
Interpretation
In our population-wide study of people in Ontario who underwent publicly funded SARS-CoV-2 PCR tests, we found that mean days in hospital per-person-year increased 47% and 53%, respectively, 8 weeks or more after infection for test-positive females and males, after we accounted for sociodemographic factors, comorbidities and pandemic wave. Mean days in long-term care also increased for both test-positive females and males, whereas home care visits increased for females but decreased for males. However, comparison of mean rates does not tell the entire story of how SARS-CoV-2 influences postacute health care use because the greatest increase in health care use occurred among 1% or less of people infected (relative to test negative, top 1% of users of health care resources). Although most of the people with SARS-CoV-2 infection had little-to-no change in health care use, a small but important subset of people experienced large increases in their rate of health care use: at the 99th percentile, test-positive females had about 7 additional days in hospital per-person-year and test-positive males had about 9 more days in hospital than their test-negative counterparts at the 99th percentile. These findings indicate that a subset of people experience substantial burden of morbidity well after a SARS-CoV-2 infection.
Given the number of recent infections, our findings portend substantial health care use by people in Canada.31 An estimated 45% of Canadians had SARS-CoV-2 infection in early 2022.32 In the next year alone, 1% of these people with recent infections will likely be admitted to hospital about 1 week longer than similar people without infection, consuming 6.6% of prepandemic hospital bed-days, when almost 20% of hospitals already averaged more than 100% annual occupancy rates.33 A family physician who had 20 outpatient encounters per day before the COVID-19 pandemic and who had half of their patients recently infected would have to accommodate an additional 100 clinical encounters per year to meet a 5% mean increase in outpatient encounters, along with the associated time and resources for communication, documentation and staffing. Such increases in health care use will occur in the context of greater need for long-term care (further compounding pressure for hospital beds), as well as substantial care backlogs, critical staffing shortages and a shrinking health care workforce.34–41 Although most people with SARS-CoV-2 infection will not need more health care, they will be competing for scarce health care resources with the subset of people whose use increases considerably. Such increased demand will require substantial population-level restructuring and investment of resources.
A study from Korea found that in the 6–12 months after SARS-CoV-2 infection, 16.4% of those admitted to hospital continued to report malaise compared with 10.9% of those who were not admitted to hospital,42 and 5% reported receiving treatment for symptoms a median of 454 days after COVID-19 diagnosis, although no people with asymptomatic infection reported symptoms at 12 months.43 Increased outpatient clinic visits after hospital admission for COVID-19 and increased risk of myocardial infarction and stroke have been identified using health care data from the US Department of Veterans Affairs.44,45 Although numerous studies have addressed the nature and prevalence of long COVID symptoms after varying severities of acute infection,46–50 to the best of our knowledge, no other studies have assessed system-wide health care use after acute infection.
Our findings add to what is known about the differential effects of SARS-CoV-2 by sex.28,51–57 Health care use was greater for females than males and increased more across the distribution of health care use and types of encounters. In contrast, additional health care use for males was highly concentrated among a small subset and home care decreased, which suggests that males may have received unpaid care from family that might have been provided by other means before the COVID-19 pandemic.
Limitations
Health care burden may have been underestimated, as health care encounters decreased during the initial phases of the COVID-19 pandemic owing to public health interventions and changes in patient behaviours.33,58–60 No generally accepted method exists for weighing severity of different types of health care encounters,61,62 although our findings were robust in sensitivity analyses with secondary definitions of health care burden. Our findings may not generalize to populations with substantial barriers to testing, and we were unable to determine whether indication for testing or employment (e.g., health care worker) may modify associations between SARS-CoV-2 infection and type of health care use after acute infection. To address potential changes in testing indications and capacity over time, we hard matched on test date and included it in the propensity score. During the study period, publicly funded testing was widely available for both symptomatic and asymptomatic people, which reduced the risk of selection bias. Our matched cohort ended March 2021, when 4.2% of the population of Ontario had received 1 or more doses of SARS-CoV-2 vaccine, and publicly available outpatient PCR testing ended in December 2021. Reasons why people sought medical care are not known. Finally, our results may not generalize to other variants or immunity levels of individuals and populations.63–65 However, our findings may provide guidance in the conditions of emerging variants, waning immunity and removal of public health interventions.63
Conclusion
The burden of health care use after a positive SARS-CoV-2 PCR test is substantial and has important health policy implications. Although better understanding is needed regarding the causes for and specific areas of increased post-acute health care use after SARS-CoV-2 infection, as well as the impact of novel variants and treatments, stakeholders may use these findings to prepare for health care demand caused by long COVID.
Acknowledgements
The authors acknowledge that the clinical registry data used in this publication is from participating hospitals through CorHealth Ontario, which serves as an advisory body to the Ministry of Health (MOH), which is dedicated to improving the quality, efficiency, access and equity in the delivery of the continuum of adult cardiac, vascular and stroke services in Ontario, Canada. Parts of this report are based on Ontario Registrar General information on deaths, the original source of which is ServiceOntario. The authors thank IQVIA Solutions Canada Inc. for use of their Drug Information File. Parts of this material are based on data or information compiled and provided by the Canadian Institute for Health Information (CIHI) and Cancer Care Ontario (CCO). The analyses, results, conclusions, opinions and statements reported are those of the authors and are independent of the data and funding sources. No endorsements by ICES, the Ontario MOH and Ministry of Long-Term Care, CIHI, Ontario Health Data Platform or its partners, Ontario Registrar General or the Ministry of Government Services, CCO or the Province of Ontario is intended or should be inferred.
Footnotes
Competing interests: None declared.
This article has been peer reviewed.
Contributors: All of the authors made substantial contributions to the conception, design, acquisition, analysis or interpretation of data; contributed to drafting the work or revised it critically for important intellectual content; gave final approval of the version to be published; and agreed to be accountable for all aspects of the work.
Funding: Funders had no direct role in the design, execution or interpretation of this work. This study was supported by ICES, which is funded in part by an annual grant from the Ontario Ministry of Health (MOH) and the Ministry of Long-Term Care (MLTC). Part of this material is based on data or information compiled and provided by the Canadian Institute for Health Information (CIHI). Candace McNaughton is supported by the Sunnybrook Research Institute, the Practice Plan of the Department of Emergency Services at Sunnybrook Health Sciences Centre and the University of Toronto. Peter Austin was supported by a Mid-Career Investigator Award from the Heart and Stroke Foundation. Douglas Lee is the Ted Rogers Chair in Heart Function Outcomes, University Health Network, University of Toronto. Clare Atzema is supported by the Sunnybrook Research Institute, the Practice Plan of the Department of Emergency Services at Sunnybrook Health Sciences Centre and by a Mid-Career Investigator Award from the Heart and Stroke Foundation. Clare Atzema has also received a Sunnybrook Foundation research grant from Sunnybrook Health Sciences Centre. Husam Abdel-Qadir has received grants from the Heart and Stroke Foundation, the Canadian Institutes of Health Research and the Canadian Cardiovascular Society.
Data sharing: The data set from this study is held securely in coded form at ICES. Although legal data-sharing agreements between ICES and data providers prohibit ICES from making the data set publicly available, access may be granted to those who meet prespecified criteria for confidential access, available at https://www.ices.on/ca/DAS (email: das{at}ices.on.ca). The full data set creation plan and underlying analytic code are available from the authors upon request, with the understanding that the computer programs may rely upon coding templates or macros that are unique to ICES and are therefore either inaccessible or may require modification.
- Accepted September 26, 2022.
This is an Open Access article distributed in accordance with the terms of the Creative Commons Attribution (CC BY-NC-ND 4.0) licence, which permits use, distribution and reproduction in any medium, provided that the original publication is properly cited, the use is noncommercial (i.e., research or educational use), and no modifications or adaptations are made. See: https://creativecommons.org/licenses/by-nc-nd/4.0/
References
In this issue

Article tools


Jump to section
Related Articles
Cited By...
- Understanding symptoms suggestive of long COVID syndrome and healthcare use among community-based populations in Manitoba, Canada: an observational cross-sectional survey
- Clinical and Economic impact of updated Fall 2023 COVID-19 vaccines in the Immunocompromised Population in Canada
- Post-acute health care costs following SARS-CoV-2 infection: A retrospective cohort study of among 531,182 matched adults
More in this TOC Section
Similar Articles
Collections

