


Abstract
BACKGROUND: It is unclear whether seasonal changes, school closures or other public health interventions will result in a slowdown of the current coronavirus disease 2019 (COVID-19) pandemic. We aimed to determine whether epidemic growth is globally associated with climate or public health interventions intended to reduce transmission of severe acute respiratory syndrome coronavirus 2 (SARS-CoV-2).
METHODS: We performed a prospective cohort study of all 144 geopolitical areas worldwide (375 609 cases) with at least 10 COVID-19 cases and local transmission by Mar. 20, 2020, excluding China, South Korea, Iran and Italy. Using weighted random-effects regression, we determined the association between epidemic growth (expressed as ratios of rate ratios [RRR] comparing cumulative counts of COVID-19 cases on Mar. 27, 2020, with cumulative counts on Mar. 20, 2020) and latitude, temperature, humidity, school closures, restrictions of mass gatherings, and measures of social distancing during an exposure period 14 days previously (Mar. 7 to 13, 2020).
RESULTS: In univariate analyses, there were no associations of epidemic growth with latitude and temperature, but weak negative associations with relative humidity (RRR per 10% 0.91, 95% confidence interval [CI] 0.85–0.96) and absolute humidity (RRR per 5 g/m3 0.92, 95% CI 0.85–0.99). Strong associations were found for restrictions of mass gatherings (RRR 0.65, 95% CI 0.53–0.79), school closures (RRR 0.63, 95% CI 0.52–0.78) and measures of social distancing (RRR 0.62, 95% CI 0.45–0.85). In a multivariable model, there was a strong association with the number of implemented public health interventions (p for trend = 0.001), whereas the association with absolute humidity was no longer significant.
INTERPRETATION: Epidemic growth of COVID-19 was not associated with latitude and temperature, but may be associated weakly with relative or absolute humidity. Conversely, public health interventions were strongly associated with reduced epidemic growth.
Seasonality and climate dependency of influenza are well established. Suggested mechanisms for the slowdown of influenza epidemics in summer months in temperate climates are related to higher temperature, higher humidity or higher solar radiation.1 These 3 characteristics are all associated with geographic latitude, a measure that can be determined effortlessly and with precision. Another possible explanation for the slowdown of influenza epidemics during summer months is school closures for summer breaks.2–4
To slow the growth of the current coronavirus disease 2019 (COVID-19) pandemic, many countries have mandated school closures5 and other public health interventions, such as restrictions of mass gatherings, social distancing or closure of nonessential businesses. However, it is unclear whether these interventions, or seasonal changes mediated by climate,6 affect the pandemic. We performed an analysis of the current epidemic growth in geopolitical areas affected by COVID-19 to determine whether epidemic growth was associated with climate, school closures or other public health interventions aimed at reducing contact rates in the population and thereby reducing transmission of severe acute respiratory syndrome coronavirus 2 (SARS-CoV-2), the coronavirus driving the pandemic.7–9
Methods
We designed a prospective cohort study of geopolitical areas with documented outbreaks of COVID-19 to determine the association of epidemic growth of COVID-19 during a prespecified follow-up period (Mar. 21 to Mar. 27, 2020) with characteristics ascertained during an exposure period 14 days previously (Mar. 7 to Mar. 13, 2020). The time lag between exposure and follow-up was set to 14 days, to reflect the assumed time between transmission of SARS-CoV-210 and reporting of confirmed COVID-19 cases (Figure 1).11 Analyses were performed according to a prespecified protocol. Results of a preliminary unpublished analysis, conducted according to protocol version 1.0, are summarized in protocol version 1.2 (available in Appendix 1, at www.cmaj.ca/lookup/suppl/doi:10.1503/cmaj.200920/-/DC1). An explanation of protocol changes is provided in the supplementary methods in Appendix 2, available at www.cmaj.ca/lookup/suppl/doi:10.1503/cmaj.200920/-/DC1.

Study design. Δ = difference between day 1 of exposure period and day 1 of follow-up period.
Eligibility
We included all geopolitical areas (states for Australia and the United States, provinces and territories for Canada, countries and overseas territories for the rest of the world) with at least 10 cases as of Mar. 20, 2020 (reference), and documented local transmission according to the World Health Organization’s (WHO) Situation Report 61.12 China was excluded as its epidemic growth had decelerated and the outbreak appeared to be contained. South Korea, Italy and Iran were excluded as their epidemics were fully established, being further ahead on the epidemic curve than the rest of the world, with the possibility of reaching the hyperendemic state during the follow-up period.
Exposure
The exposure period was prespecified to last from Mar. 7 to Mar. 13, 2020 (Figure 1). Geographic latitude was prespecified as the primary exposure variable, with mean temperature, absolute humidity, school closures, restrictions of mass gatherings and measures of social distancing as secondary exposure variables. Data on latitude, mean temperature and mean relative humidity (to derive absolute humidity) were collected for the capital of each geopolitical area, and data on school closures, restrictions of mass gatherings and measures of social distancing were collected at the level of the geopolitical area. Absolute humidity describes the absolute water content in g/m3, and relative humidity describes absolute humidity relative to the maximum possible humidity in percent given the current temperature. We gave precedence to absolute humidity over relative humidity, as it was more strongly associated with influenza than relative humidity1 and showed less variation than relative humidity, but included relative humidity as a post hoc exposure variable. Mean temperature and humidity were calculated for the entire exposure period, deriving arithmetic means across all available measurement time points (median 8 per day, interquartile range [IQR] 8 to 45).13 For school closures, restrictions of mass gatherings and measures of social distancing, we determined whether they were implemented by a prespecified cut-off, in the middle of the workweek of the exposure period (Wednesday Mar. 11, 2020).
Outcome
The analysis of confirmed cases11 is complicated by potentially dramatic differences in detection and reporting of individuals infected with SARS-CoV-2,14 which prevent a meaningful analysis of absolute event rates across different countries. Conversely, an analysis of epidemic growth,15 which can be expressed in relative terms — a rate ratio comparing the current cumulative count of reported cases with the cumulative count of cases reported 1 week earlier — is likely to account for some of the variation in detection and reporting. This approach analyzes the slope of the cumulative frequency rather than absolute rates, using each geopolitical area as its own comparison (Appendix 2, Figure S1). The follow-up period was prespecified to last from Mar. 21 to Mar. 27, 2020 (Figure 1). The prespecified outcome was epidemic growth, defined as the rate ratio comparing the cumulative count of confirmed COVID-19 cases at the end of the follow-up period on Mar. 27, 2020, with the cumulative count 1 week previously, on Mar. 20, 2020 (reference).
Additional covariates
Altitude, gross domestic product (GDP) per capita, health expenditure as percent of GDP, life expectancy, percentage of inhabitants aged 65 years or older, the Infectious Disease Vulnerability Index,16 urban population density, number of flight passengers per capita and closest distance to a country with already established epidemic (city of Wuhan, South Korea, Iran, Italy) were additional prespecified covariates. Table S1 in Appendix 2 provides a justification for the choice of these covariates.
Data collection
Information on data sources is presented in Appendix 2, Table S1. On Mar. 28, 2020, we downloaded data covering the COVID-19 outbreak until Mar. 27, 2020, from the online interactive dashboard hosted by the Center for Systems Science and Engineering at Johns Hopkins University, Baltimore.11 The dashboard reports the cumulative number of cases daily at province level in China; at city or county level in Australia, Canada and the US; and at level of countries and overseas territories elsewhere.11 The case data reported on the dashboard align with the daily WHO situation reports.11,12 The data reported at city or county level for Australia, Canada and the US were aggregated to state or province level. Overseas territories, such as Réunion or Guam, were handled separately from their home country for the purpose of this study.
Temperature in degrees Celsius (°C) and relative humidity were collected for the exposure period of Mar. 7 to Mar. 13, 2020, from a publicly accessible meteorological website,13 with absolute humidity calculated from relative humidity and temperature for each measurement time point.17 Data on school closures were obtained from the United Nations Educational, Scientific and Cultural Organization18 and complemented with information on scheduled school holidays. Data on school holidays, restrictions of mass gatherings and measures of social distancing were obtained by 1 of 4 investigators (P.J., P.B., D.G. and a research assistant) from official school schedules; provisions and press releases of relevant administrative and governmental bodies; and newspaper articles, and checked by at least 1 other investigator (P.J. or P.B.). Data on restrictions of mass gatherings and measures of social distancing were subsequently verified against timelines reported in the online encyclopedia Wikipedia.19 No documents were excluded based on language. Team members were able to read documents in English, German, Czech, Danish, Dutch, French, Greek, Italian, Portuguese, Slovak and Spanish directly. We used Web-based translation services for remaining languages. “Social distancing” was defined as any measure that attempted to prevent small clusters of 10 individuals or fewer, such as strong recommendations or formal requirements of social distancing, closure of sit-in restaurants and bars, or closure of nongrocery stores.
We calculated the number of flight passengers per capita from published passenger statistics of major airports.20–22 Data on the highest urban density in major metropolitan areas of a geopolitical area were obtained from Demographia World Urban Areas23 and complemented with data from the US Census.24 We obtained data on remaining covariates from the World Bank.25 Latitude, altitude, temperature and humidity were collected for the capital of each geopolitical area, and the remaining covariates at the level of the geopolitical area. For Ecuador, we collected data for the de facto capital, Guayaquil.25 The Infectious Disease Vulnerability Index16 was available only at country level; therefore, values of the home country were assigned to states, provinces and overseas territories. To make interpretation of the index more intuitive, we inverted it so that larger values indicate higher vulnerability to infectious diseases. All data were supplemented with publicly available information for overseas territories, states or provinces for the US, Australia and Canada, and — in cases where data were missing or implausible in the databases used — using the latest available information (Appendix 2, Table S1).
Statistical analysis
We used weighted random-effects regression26 to determine the association between the log rate ratio of COVID-19 and exposure variables. Rate ratios were calculated as cumulative count of confirmed cases in a geopolitical area since the beginning of the epidemic as of Mar. 27, divided by the cumulative count of confirmed cases since the beginning of the epidemic as of Mar. 20 (Appendix 2, Figure S1). The observation time was identical across all areas. Because the populations in question were large, they could be considered equal at both time points and cancelled out in calculations of rate ratios. A rate ratio of 2 indicates that the number of cases in a geopolitical area doubled within 1 week. As the exposure period of Mar. 7 to Mar. 13 was near vernal equinox, no transformation was necessary to reflect the association of the log rate ratio of COVID-19 with the square of the latitude. Associations were expressed as ratios of rate ratios (RRRs) per 400 degrees2 increase in latitude, 5°C increase in temperature, 10% increase in relative humidity, 5 g/m3 increase in absolute humidity, and RRR comparing geopolitical areas with versus areas without implementation of school closures, restrictions of mass gatherings or measures of social distancing. The units of analysis were geopolitical areas; log rate ratios of COVID-19 (dependent variable) and exposure variables (independent variables) were defined at the level of geopolitical areas. An RRR less than 1 indicates that an increase in a continuous exposure variable or the presence of a public health intervention is associated with a decrease in epidemic growth, with an RRR of 0.60 corresponding to a 40% relative reduction in epidemic growth.
We determined associations of epidemic growth with exposure variables in univariate analyses, and in different multivariable models and analysis sets to determine robustness of associations as prespecified in the protocol (see Appendices 1 and 2). Then, we developed 2 parsimonious multivariable models. For Model 1, we first prioritized covariates on theoretical grounds and then used unsupervised cluster analysis for variable selection (Appendix 2, Table S2);27 for Model 2, we used stepwise backward selection of covariates based on the adjusted R2 statistic. We prespecified that Model 1 would take precedence over Model 2, as it would not be at risk of overfitting. Cluster analysis indicated clustering of the 3 public health interventions (Appendix 2, Figure S2). We therefore derived a post hoc composite of exposure to any of the 3 interventions. In addition, we prespecified to perform tests for trend according to the number of public health interventions implemented (0, 1, or 2 or more) under the assumption that the RRRs for the association of epidemic growth with school closures, restrictions of mass gatherings or measures of social distancing would have the same direction and a similar magnitude. We forced major geographical regions (Asia, Oceania, Europe, Africa, Americas) into both models to account for the geographic progression of the pandemic. Analyses were performed in Stata, Release 14 (StataCorp, College Station, TX) and R (R Foundation for Statistical Computing, Vienna, Austria).
Ethics approval
This study did not require research ethics approval, as publicly available, anonymized aggregate data were used for all analyses.
Results
We included 144 geopolitical areas with 375 609 cases in our analyses (Appendix 2, Figure S3 and Table S3). The median COVID-19 case count per 1 million inhabitants for the 144 geopolitical areas was 87.6 (IQR 31.9–193.7); the median rate ratio representing epidemic growth was 3.56 (IQR 2.41–4.66, Table 1). Most geopolitical areas were in the northern hemisphere, near sea level, with temperate climates. The median temperature was 12.8°C (IQR 7.3–21.2), the median relative humidity was 69.0% (IQR 60.3–76.6) and the median absolute humidity was 7.1 g/m3 (IQR 5.1–10.8). Temperature was strongly associated with the square of the latitude and, to a lesser extent, so was absolute humidity; relative humidity was not associated (Appendix 2, Figures S4–S6). In 38 geopolitical areas, at least 1 public health intervention had been implemented by Mar. 11, 2020, with 24 areas having 1 implemented (16.7%), and 14 areas having 2 or 3 interventions (9.7%); the remainder had no public health interventions in effect (73.6%). The implementation of public health interventions was correlated (Appendix 2, Figure S2). The median percentage of the population aged 65 years or older was 14.0%; the median life expectancy at birth was 79 years; on average, 9.2% of GDP was spent on health (IQR 6.3%–13.5%); and the median distance to the closest established epidemic was 4300 km (IQR 1300–8000; Table 1).
Characteristics of analyzed geopolitical areas (n = 144)
In univariate analyses (Figure 2), there was no association between epidemic growth and latitude (RRR per 400 degrees2 increase 0.99, 95% CI 0.96–1.03, p = 0.72) or mean temperature (RRR per 5°C increase, 0.97, 95% CI 0.93–1.02). Conversely, there was a negative association with relative humidity (RRR per 10% increase 0.91, 95% CI 0.85–0.96) and with absolute humidity (RRR per 5 g/m3 increase 0.92, 95% CI 0.85–0.99). In Appendix 2, Figures S7–S10 show bubble plots of the rate ratio of COVID-19 on a logarithmic scale against latitude, temperature and relative and absolute humidity.
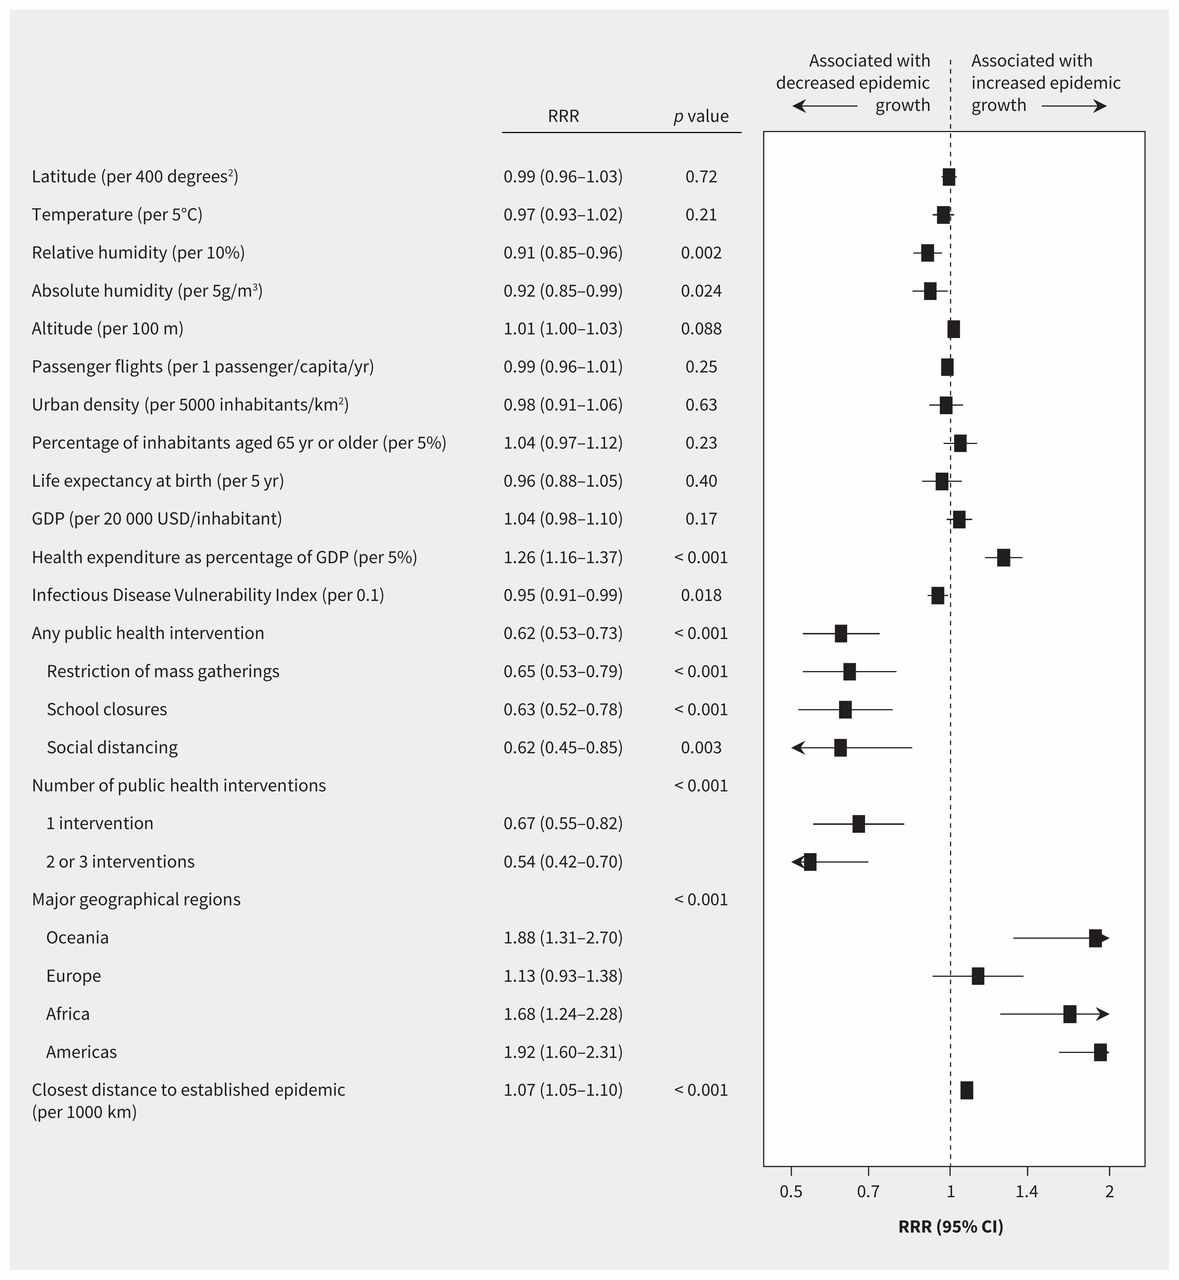
Caterpillar plot presenting results of univariate analyses. Shown are ratios of rate ratios (RRRs) with 95% confidence intervals (CI) and 2-sided p values. The p value for number of public health interventions is a p value for trend. Reference categories are no public health intervention for number of public health interventions, and Asia for major geographical regions. An RRR of 0.62, for example, indicates a 38% relative reduction in epidemic growth. Note: GDP = gross domestic product.
The composite of any public health intervention (RRR 0.62, 95% CI 0.53–0.73) and its components, restrictions of mass gatherings (RRR 0.65, 95% CI 0.53–0.79), school closures (RRR 0.63, 95% CI 0.52–0.78) and measures of social distancing (RRR 0.62, 95% CI 0.45–0.85), all showed strong negative associations with epidemic growth during the follow-up period between Mar. 21 and Mar. 27 (Appendix 2, Figures S11–S13). The negative association was more pronounced in geopolitical areas that had 2 or 3 public health interventions compared with regions that had implemented 1 intervention (p for trend < 0.001; Figure 3). Epidemic growth varied by continent, health expenditure, Infectious Disease Vulnerability Index and distance to closest established epidemic.

Bubble plot of epidemic growth against the number of public health interventions (0, 1, or 2 or more). Each bubble represents a geopolitical area, with the size of the bubble proportional to the weight of the geopolitical area in weighted random-effects regression with inverse-variance weights. Box and whisker plots: the box represents median and interquartile range; whiskers the most extreme values within 1.5 times of the interquartile range beyond the 25th and 75th percentile. The p value for trend is from univariate weighted random-effects regression (see Figure 2). A rate ratio of 2, for example, indicates that the cumulative case count in a geopolitical area doubled within 1 week; a rate ratio of 3 indicates that it tripled.
In prespecified multivariable analyses and restricted analyses, associations with latitude and temperature remained nonsignificant (Appendix 2, Tables S4 and S5). The associations of epidemic growth with relative and absolute humidity attenuated and became mostly nonsignificant (Appendix 2, Tables S6 and S7). Negative associations with public health interventions all remained robust, except for measures of social distancing (Appendix 2, Tables S8–S12).
The main multivariable model (Figure 4) showed a weak, nonsignificant negative association of epidemic growth with absolute humidity (RRR per 5 g/m3 0.92, 95% CI 0.84–1.00, p = 0.064), but a continued strong association with the number of public health interventions implemented (p value for trend = 0.001). A multivariable model based on stepwise backward selection (Appendix 2, Figure S14) showed a weak negative association with absolute humidity (RRR per 5 g/m3 0.87, 95% CI 0.77–0.99) and a strong negative association with the number of implemented public health interventions (p for trend = 0.004), and additionally suggested a negative association of epidemic growth with increased life expectancy at birth, and residual variation by continent. Post hoc analyses based on a different metric to estimate epidemic growth showed more pronounced reductions with public health interventions (Appendix 2, Tables S13 and S14).

Caterpillar plot presenting results of the main parsimonious multivariable model. Shown are ratios of rate ratios (RRRs) with 95% confidence intervals (CIs) and 2-sided p values. The variables presented are those included in the parsimonious model. The p value for number of public health interventions is a p value for trend. Reference categories are no public health intervention for number of public health interventions, and Asia for major geographical regions. An RRR of 0.70, for example, indicates a 30% relative reduction in epidemic growth. Note: GDP = gross domestic product.
Interpretation
In this prospective cohort study of 144 geopolitical areas with 375 609 confirmed cases of COVID-19, epidemic growth of COVID-19 during the follow-up period from Mar. 21 to Mar. 27, 2020, was not associated with geographic latitude, nor with temperature during the exposure period 14 days before, when SARS-CoV-2 transmission was assumed to have occurred. We found associations with relative and absolute humidity, but these were attenuated in multivariable models. The associations of epidemic growth with both dimensions of humidity, despite their low mutual correlation,28 were suggestive of a minor role of humidity in the epidemiology of COVID-19, but this remains hypothetical. On the other hand, it is of considerable importance that we found strong negative associations with 3 public health interventions commonly used to contain the COVID-19 pandemic: restrictions of mass gatherings, school closures and measures of social distancing. Even though we were unable to reliably quantify the independent contribution of the 3 interventions, our results are of immediate relevance, as many countries currently consider the removal of some of the implemented public health interventions.
Our results are concordant with 3 studies from China,29–31 which reported no evidence for an association of epidemic growth with temperature and relative humidity,29 but strong decreases in epidemic growth associated with public health measures.30,31 A recent rapid systematic review concluded that the evidence to support national closure of schools to combat COVID-19 is very weak and that data from influenza outbreaks suggest that school closures could have relatively small effects on SARS-CoV-2 owing to its high transmissibility and apparent low clinical effect on school children.32 Our results suggest that school closures are likely to have a larger effect than suggested in this review, but the clustering of school closures with other public health interventions means that we were unable to reliably estimate the independent effect of this intervention on the COVID-19 pandemic. The effect of restrictions of mass gathering, measures of social distancing and school closures on viral transmission is understudied.32–34 However, mathematical models and limited observational evidence suggest that they can interrupt disease transmissions. Our study provides evidence using global data from the COVID-19 pandemic, that these interventions are strongly associated with reduced epidemic growth.
Limitations
Our study has a number of important limitations. First, because of considerable differences in testing practices between different geopolitical areas, actual rates of COVID-19 could not be reliably estimated. We assumed, however, that rate ratios as measures of epidemic growth could be reliably estimated, as testing practices would affect both counts used to calculate the rate ratio in the same way during the ascertained 1-week follow-up period. We were unable to identify reliable information on the number of SARS-CoV-2 tests per million inhabitants, and on different testing strategies, and therefore could not directly verify this assumption. Health expenditure as percent of GDP and Infectious Disease Vulnerability Index16 may be associated to some extent with a health care system’s capacity to test and could serve as imperfect surrogates. They were indeed both associated with epidemic growth in the univariate analysis, but the main multivariable model did not suggest an association with health expenditure. In addition, the random effects used in the regression model implicitly accounted for residual variation in characteristics of geopolitical areas that remained unexplained, including variation in testing strategies. Second, we assumed that SARS-CoV-2 testing strategies did not vary during the follow-up period. Testing capacity was limited globally in March 2020 and was unlikely to change rapidly during the follow-up period in most geopolitical areas. In addition, we believe that the time window of 1 week was short enough so that reported confirmed cases in each geopolitical area were likely to represent a constant percentage of the true actual cases.
Third, only 38 geopolitical areas had implemented public health interventions by the cut-off date of Mar. 11, 2020, and the implementation of interventions was clustered. We therefore refrained from exploring the individual contributions and potential interactions between these interventions in multivariable models and merely constructed a binary composite variable, and a variable representing the number of interventions implemented. This means that we were unable to reliably estimate the individual contributions of the 3 public health interventions that we analyzed. We therefore consider the magnitude of the association of epidemic growth with the composite of any public health intervention and the linear trend of the association with the number of public health interventions more reliable and relevant for decision-making than the magnitude of associations of epidemic growth with the 3 public health interventions individually. Fourth, there was variation in measures of social distancing reported by different geopolitical areas, including recommendations or requirements regarding social distancing, closure of sit-in restaurants and bars, or closure of nongrocery stores, and the derived average association will not shed light on the specific components of social distancing. Fifth, we analyzed only when restrictions of mass gathering were instituted, irrespective of the size of mass gatherings that were restricted. Sixth, we were unable to quantify compliance of the population with social distancing and restrictions of mass gatherings. Conversely, even though there may be local variations in strategies to implement school closures, we consider a high adherence to this intervention likely.
Seventh, data on latitude, temperature and humidity were collected for the capital of each geopolitical area, which may not have accurately represented area-wide climate patterns. The limited granularity of the available data may therefore have resulted in nondifferential misclassification of exposure, which in turn may have biased estimates of associations toward the null (see Appendix 2, Tables S15–S23 and Figure S15 for details on risks of bias for individual exposure variables). The association between relative and absolute humidity and epidemic growth was suggestive but not consistent. Even if humidity proves important in the epidemiology of COVID-19 in the future, seasonal effects will likely be attenuated by the high levels of susceptibility associated with pandemic diseases.35
Conclusion
Epidemic growth of COVID-19 was not associated with geographic latitude, nor with temperature during the exposure period, in our global analysis. Only area-wide public health interventions were consistently associated with reduced epidemic growth, and the greater the number of co-occurring public health interventions, the larger the reduction in growth. Taken together, these findings suggest that seasonality is likely to play only a minor role in the epidemiology of COVID-19, while public health interventions (school closures, restricting mass gatherings, social distancing) appear to have a major impact. The important effect of public health interventions needs to be weighed carefully against potential economic and psychosocial harms when deciding when and how to lift restrictions.
Acknowledgement
The authors thank Maggie Law for help with data collection on public health interventions.
Footnotes
Competing interests: None declared.
This article has been peer reviewed.
Contributors: Peter Jüni conceived and designed the study, collected, analyzed and interpreted data, wrote the first draft of the article, and contributed to all revisions. Martina Rothenbühler and Bruno da Costa analyzed and interpreted data, and contributed to all revisions. Pavlos Bobos contributed to designing the study, collected and interpreted data, and contributed to all revisions. Kevin Thorpe analyzed and interpreted the data, and contributed to all revisions. David Fisman and Arthur Slutsky contributed to designing the study, interpreted data, and contributed to all revisions. Dionne Gesink contributed to designing the study, collected and interpreted data, wrote the first draft of the article, and contributed to all revisions. All of the authors gave final approval of the version to be published and agreed to be accountable for all aspects of the work.
Funding: Peter Jüni is a Tier 1 Canada Research Chair in Clinical Epidemiology of Chronic Diseases. Pavlos Bobos is a recipient of a Frederick Banting and Charles Best Canada Graduate Scholarships of the Canadian Institutes of Health Research. Arthur S. Slutsky is supported by grants # FDN143285 and 137772 from the Canadian Institutes of Health Research. This research was completed, in part, with funding from the Canada Research Chairs Program and the Canadian Institutes of Health Research.
Data sharing: The authors welcome proposals for joint use of the study data. Proposals for joint use of the study data should be sent to the corresponding author (peter.juni{at}utoronto.ca). Data will be made available with investigator support, with a signed data access agreement, after approval of a proposal by the investigators of the study.
- Accepted May 5, 2020.
References
In this issue

Article tools


Jump to section
Related Articles
Cited By...
- Effectiveness of different types and levels of social distancing measures: a scoping review of global evidence from earlier stage of COVID-19 pandemic
- The Effect of Weather Pattern on the Second Wave of Coronavirus: A cross study between cold and tropical climates of France, Italy, Colombia, and Brazil
- Timing of exposure is critical in a highly sensitive model of SARS-CoV-2 transmission
- Effectiveness of public health measures in reducing the incidence of covid-19, SARS-CoV-2 transmission, and covid-19 mortality: systematic review and meta-analysis
- Do school closures and school reopenings affect community transmission of COVID-19? A systematic review of observational studies
- Data analysis of COVID-19 wave peaks in relation to latitude and temperature for multiple nations
- Assessment of COVID-19 risk and prevention effectiveness among spectators of mass gathering events
- COVID-19-associated school closures and related efforts to sustain education and subsidized meal programs, United States, February 18-June 30, 2020
- Do school closures and school reopenings affect community transmission of COVID-19? A systematic review of observational studies
- Estimation of novel coronavirus (covid-19) reproduction number and case fatality rate: a systematic review and meta-analysis
- Role of Weather Factors in COVID-19 Deaths in Tropical Climate: A Data-Driven Study Focused on Brazil Manuscript
- Beware That COVID-19 Would Be Worse in Winter: A Study of a Global Panel of 1236 Regions
- The mobility gap: estimating mobility levels required to control Canadas winter COVID-19 surge
- Descriptive Epidemiological Assessment of the Relationship between the Global Burden of Influenza from 2017-2019 and COVID-19
- GIS-based spatial modeling to identify factors affecting COVID-19 incidence rates in Bangladesh
- Barriers, facilitators, preferences and expectations of joint protection programmes for patients with hand arthritis: a cross-sectional survey
- Causal analysis of COVID-19 observational data in German districts reveals effects of mobility, awareness, and temperature
- School and community reopening during the COVID-19 pandemic: a mathematical modeling study
- Impact of climatic, demographic and disease control factors on the transmission dynamics of COVID-19 in large cities worldwide
- Spring Weather and COVID-19 Deaths in the U.S.
- Belief of Previous COVID-19 Infection and Unclear Government Policy are Associated with Reduced Willingness to Participate in App-Based Contact Tracing: A UK-Wide Observational Study of 13,000 Patients
- COVID-19 pandemic-related lockdown: response time is more important than its strictness
- The association of UV with rates of COVID-19 transmission and deaths in Mexico: the possible mediating role of vitamin D
- Containment measures limit environmental effects on COVID-19 early outbreak dynamics
- A Net Benefit Approach for the Optimal Allocation of a COVID-19 Vaccine
- COVID-19s U.S. Temperature Response Profile
More in this TOC Section
Similar Articles
Collections

