


Article Figures & Tables
Figures
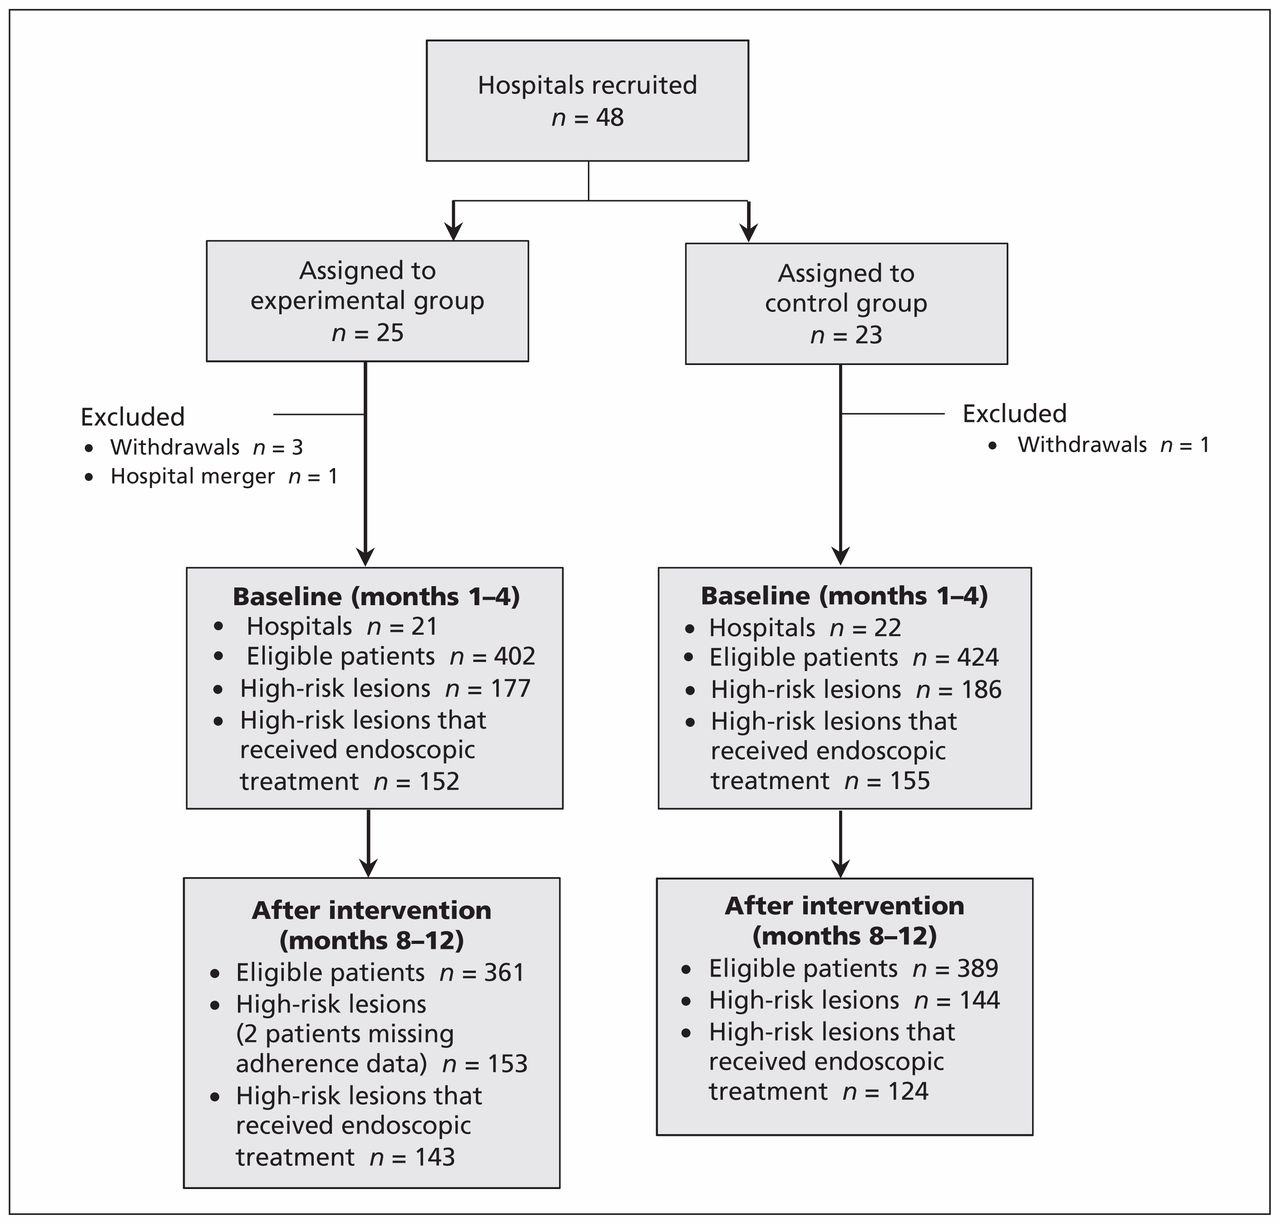
- Figure 1:
Selection of hospitals and patients for inclusion in the trial.
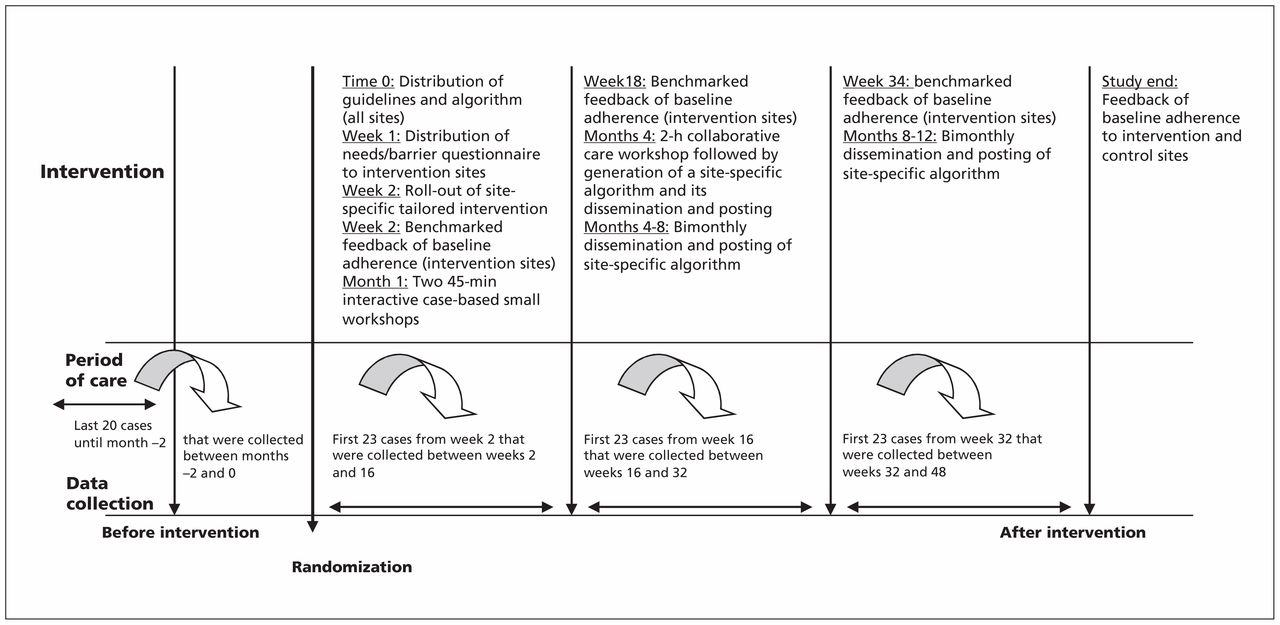
- Figure 2:
Timetable of randomization, intervention, follow-up and data collection. Chart numbers shown do not include an additional 10% duplicate independent data entry for validation purposes. Data collection timelines were tabulated based on conservative estimates (based on pilot testing) of case volumes of 4–5 eligible patients weekly in the period of care and 4–5 charts abstracted weekly in the data collection period. The timelines allowed additional time for data collection (3–5 weeks if a 2-week turn-around was allowed for the preparation of feedback sheets).

Tables
- Table 1:
Patient-level analysis of compliance to guidelines for the management of nonvariceal upper gastrointestinal bleeding
Guideline Before intervention, % (no. of patients) After intervention, % (no. of patients) Intracluster correlation coefficient Percentage difference (95% CI) Experimental group Control group Experimental group Control group Primary outcome Endoscopic hemostasis followed by high-dose IV PPI 13.2 (20/152) 7.1 (11/155) 9.8 (14/143) 4.8 (6/124) 0.04 −5.0 (−12.0 to 2.0) Secondary outcomes Injection and/or thermal coagulation without clips and bolus IV PPI followed by infusion for 72 h for high-risk ulcers 8.6 (13/152) 5.2 (8/155) 6.3 (9/143) 4.8 (6/124) 0.07 −1.5 (−8.1 to 5.2) Injection and/or thermal coagulation with clips and bolus IV PPI followed by 8 mg/h infusion for 72 h and no oral PPI. If the patient received a pre-endoscopy infusion, the absence of bolus IV PPI was ignored 69.1 (105/152) 58.7 (91/155) 57.3 (82/143) 62.9 (78/124) 0.18 5.6 (−12.7 to 23.8) Injection and/or thermal coagulation with clips and pre-endoscopy IV bolus PPI plus 80-mg bolus IV PPI followed by 8 mg/h infusion for 72 h after endoscopy and no oral PPI 1.3 (2/152) 1.9 (3/155) 1.4 (2/143) 0.8 (1/124) −0.05 −0.6 (−2.5 to 1.3) Injection and/or thermal coagulation upon endoscopy for high-risk ulcers with clips alone 81.6 (124/152) 74.8 (116/155) 72.7 (104/143) 72.6 (90/124) 0.35 −0.1 (−20.4 to 20.1) Injection and/or thermal coagulation without clips for high-risk ulcers alone 49.3 (75/152) 56.1 (87/155) 50.4 (72/143) 46.8 (58/124) 0.33 −3.6 (−25.4 to 18.2) 80-mg IV bolus PPI followed by 8 mg/h PPI infusion for 72 h after endoscopy and no oral PPI 15.3 (27/177) 10.0 (17/170) 13.6 (21/155) 15.9 (24/151) 0.27 2.3 (−12.1 to 16.8) 80-mg IV bolus PPI followed by 8 mg/h infusion for 72 h after endoscopy and no oral PPI. If patient received a pre-endoscopy infusion, the absence of bolus IV PPI afterward was ignored 82.5 (146/177) 80.0 (136/170) 81.3 (126/155) 89.4 (135/151) 0.06 8.1 (−1.4 to 17.6) Pre-endoscopy bolus of PPI plus 80-mg bolus IV PPI followed by 8 mg/h infusion for 72 h after endoscopy and no oral PPI 1.1 (2/177) 1.8 (3/170) 1.9 (3/155) 9.3 (14/151) 0.35 7.3 (−2.9 to 17.5) Use of validated scoring system based on a combination of clinical and endoscopic characteristics to stratify patients into low- and high-risk categories 0.0 (0/402) 0.2 (1/424) 1.9 (7/361) 0.0 (0/389) 0.19 −1.9 (−5.0 to 1.1) Early endoscopy (in the first 24 h) with risk classification by clinical/endoscopic criteria 62.9 (253/402) 65.6 (278/424) 57.3 (207/361) 63.1 (245/388) 0.09 5.6 (−5.6 to 16.9) No hemostasis for low risk lesion 88.9 (200/225) 93.7 (223/238) 94.2 (196/208) 89.0 (218/245) 0.13 −5.2 (−13.2 to 2.8) Endoscopic hemostasis for adherent clot 87.9 (29/33) 88.0 (22/25) 80.7 (25/31) 80.8 (21/26) 0.09 0.1 (−22.9 to 23.1) Endoscopic hemostasis for other active bleeding or visible vessel 85.9 (152/177) 83.3 (155/186) 93.5 (143/153) 86.1 (124/144) 0.06 −7.4 (−15.8 to 1.1) Low-risk patients who received treatment 11.1 (25/225) 6.3 (15/238) 5.8 (12/208) 11.0 (27/245) 0.13 5.2 (−2.8 to 13.2) Low-risk patients not given IV PPI bolus or infusion after endoscopy 61.8 (139/225) 59.2 (141/238) 56.3 (117/208) 64.1 (157/245) 0.05 8.0 (−2.9 to 18.9) Note: CI = confidence interval, IV = intravenous, PPI = proton pump inhibitor.
Characteristic No. (%) Experimental group
n = 21Control group
n = 22University hospital 13 (61.9) 18 (81.8) Availability of a nurse on call 17 (81.0) 17 (77.3) Residents assist in care of patients with upper gastrointestinal bleeding 16 (76.2) 16 (72.7) Teaching/education/administrative activities occurred at site that could alter patient management 0 (0.0) 1 (4.6) More than 400 beds 14 (66.7) 15 (68.2) Geographic location East* 10 (47.6) 7 (31.8) Ontario and West† 11 (52.4) 15 (68.2) - Table 3:
Characteristics of patients with available outcome data, before and after intervention
Characteristic Before intervention, % (no. of patients)* After intervention, % (no. of patients)* Experimental group
n = 402Control group
n = 424Experimental group
n = 361Control group
n = 389Age, yr, mean ± SD 68.6 ± 15.3 66.3 ± 15.7 68.0 ± 14.8 67.8 ± 16.4 Sex, male 240 (59.7) 274 (64.6) 218 (60.4) 220 (56.6) No. of comorbid illnesses, median (range) 2.0 (0–10) 2.0 (0–7) 3.0 (0–8) 2.0 (0–9) Inpatient onset of bleeding 106 (26.4) 58 (13.7) 71 (19.7) 69 (17.7) Rockall score recorded 0 (0.0) 0 (0.0) 7 (1.9) 0 (0.0) Blatchford score† 0 (0.0) 1 (0.2) 0 (0.0) 0 (0.0) Presence of initial hemodynamic instability 110 (27.4) 129 (30.4) 134 (37.1) 113 (29.1) Bleeding site: stomach 211 (52.5) 246 (58.0) 191 (52.9) 222 (57.1) Bleeding stigmata identified at endoscopy High-risk lesion 177 (44.0) 186 (43.9) 153 (42.4) 144 (37.0) Active bleeding 75 (18.7) 83 (19.6) 65 (18.0) 63 (16.2) Adherent clot 48 (11.9) 46 (10.9) 42 (11.6) 37 (9.5) Nonbleeding visible vessel 54 (13.4) 57 (13.4) 46 (12.7) 44 (11.3) Low-risk lesion 225 (56.0) 238 (56.1) 208 (57.6) 245 (63.0) Clean base ulcer 176 (43.8) 199 (46.9) 182 (50.4) 208 (53.5) Nonprotuberant pigmented dot 49 (12.2) 39 (9.2) 26 (7.2) 37 (9.5) Characteristic Before intervention, % (no. of patients)* After intervention, % (no. of patients)* Between-group comparison, p value Experimental group Control group Experimental group Control group Unadjusted† Adjusted‡ High-risk patients who received endoscopic therapy 67.8 (152/177) 83.3 (155/186) 94.7 (143/151) 86.1 (124/144) 0.09 0.05 Index endoscopy within 24 h 62.8 (252/401) 65.6 (278/424) 57.5 (207/360) 63.1 (245/388) 0.3 0.1 Time to index endoscopy, h, mean ± SD† 38.0 ± 69.8
n = 40128.1 ± 40.1
n = 42433.5 ±51.6
n = 36128.2 ± 37.2
n = 3880.8 0.6 Targeted irrigation of adherent clot performed 68.8 (33/48) 54.4 (25/46) 73.8 (31/42) 70.3 (26/37) 0.8 – Endoscopic treatment performed 44.0 (177/402) 40.1 (170/424) 42.9 (155/361) 38.8 (151/389) 0.5 0.9 Injection 37.3 (150/402) 31.4 (133/424) 36.0 (130/361) 29.3 (114/389) 0.2 0.9 Epinephrine/saline alone 30.4 (122/402) 30.4 (129/424) 28.5 (103/361) 27.0 (105/389) 0.8 0.9 Other 7.0 (28/402) 0.9 (4/424) 7.5 (27/361) 2.3 (9/389) 0.2 – Thermal 18.4 (74/402) 21.9 (93/424) 19.4 (70/361) 17.7 (69/389) 0.7 0.4 Clips 16.9 (68/402) 9.7 (41/424) 14.4 (52/361) 13.6 (53/389) 0.8 0.3 Other (ligation) 0.0 (0/402) 0.7 (3/424) 1.1 (4/361) 0.3 (1/389) 0.1 – Pre initial endoscopy, total daily dose of PPI, mg, mean ± SD Oral 66.4 ± 46.4
n = 4568.3 ± 69.4
n = 4880.0 ± 46.4
n = 3768.6 ± 49.5
n = 490.4 0.3 Intravenous bolus 80.0 ± 24.3
n = 27781.4 ± 25.8
n = 28881.4 ± 23.1
n = 25481.5 ± 21.5
n = 2880.95 0.9 Intravenous constant infusion 145.0 ± 150.1
n = 273124.1 ± 129.3
n = 289124.2 ± 126.6
n = 254120.1 ± 113.8
n = 2880.7 0.7 Post initial endoscopy, total daily dose of PPI, mg, mean ± SD Oral 91.7 ± 64.1
n = 19698.8 ± 77.7
n = 246116.8 ± 74.9
n = 206116.1 ± 69.0
n = 1810.95 0.3 Intravenous bolus 102.1 ± 53.6
n = 7697.4 ± 68.6
n = 62104.5 ± 80.8
n = 62100.4 ± 57.3
n = 510.7 0.7 Intravenous constant infusion 380.4 ± 245.9
n = 285380.5 ±233.3
n = 306430.7 ± 258.8
n = 252402.6 ± 264.5
n = 2880.3 0.6 Intensive care unit admission 15.7 (63/402) 14.9 (63/424) 15.5 (56/361) 13.1 (51/389) 0.6 0.5 Intensive care unit duration of stay, d, mean ± SD† 6.0 ± 8.1
n = 634.4 ± 5.0
n = 634.7 ± 3.7
n = 566.5 ± 8.4
n = 510.4 0.4 Re-bleeding, need for surgery or angiography to stop bleeding 9.2 (37/402) 9.0 (38/424) 11.9 (43/361) 8.2 (32/389) 0.1 – Re-bleeding 8.0 (32/402) 8.0 (34/424) 11.1 (40/361) 7.2 (28/389) 0.1 – Need for surgery to stop bleeding 2.5 (10/402) 1.7 (7/424) 1.9 (7/361) 2.1 (8/389) 0.9 – Need for angiographic procedure to stop bleeding 2.5 (7/280) 2.0 (6/300) 2.8 (10/361) 2.1 (8/389) 0.5 – Deaths 6.0 (24/402) 6.4 (27/424) 6.4 (23/361) 5.7 (22/389) 0.7 – Bleeding-related death 1.5 (6/402) 0.7 (3/424) 2.2 (8/361) 2.3 (9/389) 0.9 – Length of stay, d, mean ± SD§ 10.6 ± 15.4
n = 3629.6 ± 15.7
n = 3819.1 ± 10.1
n = 3319.4 ± 12.1
n = 3510.8 0.7 Hospital stay less than 3 d¶ 20.0 (77/386) 26.7 (109/408) 20.1 (71/354) 22.3 (83/373) 0.7 0.9 High-risk patients with hospital stay less than 3 d 6.9 (12/174) 14.6 (27/185) 8.5 (13/153) 11.8 (17/144) 0.4 0.2 Note: PPI = proton pump inhibitors, SD = standard deviation.
↵* Unless otherwise indicated.
↵† χ2 for categorical variables or t-tests for continuous variables.
↵‡ Adjusted for baseline, hospital size (≤ 400 v. > 400 beds), Ontario (yes v. no) and interaction of hospital size and Ontario location. Adjustment for site was made for p values using the generalized estimating equations for dichotomous outcomes and mixed models for continuous outcomes.
↵§ Time to index endoscopy, ICU length of stay and hospital length of stay were log-transformed to improve normality.
↵¶ Unless patient died during hospital stay.
In this issue
Article tools


Jump to section
Related Articles
Cited By...
- Inappropriate use of clinical practices in Canada: a systematic review
- ABC score: a new risk score that accurately predicts mortality in acute upper and lower gastrointestinal bleeding: an international multicentre study
- Implementation of effective practices in health facilities: a systematic review of cluster randomised trials
More in this TOC Section
Similar Articles
Collections

