

Abstract
BACKGROUND: Recent epidemiologic findings suggest that socioeconomic inequalities in health may be widening over time. We examined trends in socioeconomic inequalities in premature and avoidable mortality in Canada.
METHODS: We conducted a population-based repeated cohort study using the 1991, 1996, 2001, 2006 and 2011 Canadian Census Health and Environment Cohorts. We linked individual-level Census records for adults aged 25–74 years to register-based mortality data. We defined premature mortality as death before age 75 years. For each census cohort, we estimated age-standardized rates, risk differences and risk ratios for premature and avoidable mortality by level of household income and education.
RESULTS: We identified 16 284 045 Census records. Between 1991 and 2016, premature mortality rates declined in all socioeconomic groups except for women without a high school diploma. Absolute income-related inequalities narrowed among men (from 2478 to 1915 deaths per 100 000) and widened among women (from 1008 to 1085 deaths per 100 000). Absolute education-related inequalities widened among men and women. Relative socioeconomic inequalities in premature mortality widened progressively over the study period. For example, the relative risk of premature mortality associated with the lowest income quintile increased from 2.10 (95% confidence interval [CI] 2.02–2.17) to 2.79 (95% CI 2.66–2.91) among men and from 1.72 (95% CI 1.63– 1.81) to 2.50 (95% CI 2.36–2.64) among women. Similar overall trends were observed for avoidable mortality.
INTERPRETATION: Socioeconomically disadvantaged groups have not benefited equally from recent declines in premature and avoidable mortality in Canada. Efforts to reduce socioeconomic inequalities and associated patterns of disadvantage are necessary to prevent this pattern of widening health inequalities from persisting or worsening over time.
Adecade after the release of the World Health Organization’s final report on the social determinants of health,1 governments around the world appear to have made relatively little progress toward the goal of reducing health inequalities. In fact, recent epidemiologic findings suggest that socioeconomic inequalities in mortality and related indicators of population health are widening over time.2–7 Such trends are well established in the United States and Europe, yet analogous trends in Canada remain poorly characterized. Efforts to monitor the evolution of socioeconomic inequalities in mortality in Canada have been hampered by the fact that official death records lack information on the socioeconomic status of deceased people. 8 In the absence of this information, some investigators relied on area-based measures of socioeconomic deprivation to monitor change in mortality inequalities in Canada.9–13 More recently, however, researchers have overcome this methodologic barrier by linking vital statistics records to individual Census data that contain relevant indicators of socioeconomic status.14,15
Notably, existing analyses of individual-level trends in the mortality gradient in Canada have focused on the adult population as a whole and, in so doing, have obscured from view an important source of survivorship bias.14,15 Prior research has shown that those who survive into older adulthood represent a highly selected group and that positive selection for the most robust people is particularly strong at the lower end of the socioeconomic spectrum.16–20 This pattern of selective survival leads to the gradual convergence of average health levels over time, which, in turn, attenuates the association between socioeconomic status and mortality in older age groups. A common approach to dealing with this form of downward selection bias involves excluding the “oldest old” and focusing attention on socioeconomic inequalities in premature and avoidable mortality among adults younger than age 75 years.21–25
In the present study, we aimed to examine trends in socioeconomic inequalities in premature and avoidable mortality between 1991 and 2016 in Canada using linked Census and vital registration data.
Methods
Data and sample
We conducted a population-based repeated cohort study using data from the 1991, 1996, 2001, 2006 and 2011 Canadian Census Health and Environment Cohorts.26 Each cohort consists of adults among the 20% of Canadian households selected to complete the mandatory long-form Census or, in the case of the 2011 cohort, the 30% of Canadian households invited to complete the voluntary National Household Survey.27 Census records were probabilistically linked to the Canadian Mortality Database covering the period 1991–2016. Our population of interest consisted of community-dwelling adults aged 25–74. We did not include adults younger than 25 owing to their exclusion from the sampling frame of the 1991 Canadian Census Health and Environment Cohort. We identified a relevant analytic sample of 16 284 045 Census records that were successfully linked to the Canadian Mortality Database.
Measures
Our exposure of interest was socioeconomic status, measured in terms of household income and education. We included both indicators as they capture different dimensions of socioeconomic inequality.2,28–33 We constructed household income by calculating the sum of all self-reported sources of income during the preceding calendar year. Following recent Statistics Canada and Organisation for Economic Co-operation and Development reports,34–38 we adjusted for household size by dividing total household income by the square root of the number of household members. Respondents were grouped into 5 equivalized household income quintiles. Education was measured by means of a series of questions asking respondents to identify their highest level of educational attainment. Respondents were grouped into 1 of the following 4 categories: postsecondary degree, some postsecondary education, high school diploma or less than high school. A complete list of survey questions used to create these variables is included in Appendix 1 (available at www.cmaj.ca/lookup/doi/10.1503/cmaj.191723/tab-related-content).
Our primary outcome of interest was premature mortality, defined as death before age 75 years.39 We also examined 2 components of avoidable mortality: preventable mortality, referring to causes of premature death that are potentially avoidable through primary prevention efforts (e.g., lung cancer, suicide and unintentional injuries); and amenable mortality, referring to causes of premature death that are potentially avoidable through secondary and tertiary prevention efforts (e.g., breast cancer, respiratory infections and neurologic disorders).39 We coded preventable and amenable causes of death according to an established classification scheme.39 We measured mortality over the 5-year period between Censuses, resulting in 5 nonoverlapping periods: June 1991–May 1996, June 1996–May 2001, June 2001–May 2006, June 2006–May 2011 and June 2011–May 2016.
Statistical analysis
We calculated age-standardized mortality rates for each socioeconomic group, stratified by sex and cohort. We used the direct method of standardization using 5-year age groups, taking the 1991 Canadian population as the reference. We quantified change in mortality rates, measured in both absolute and relative terms, by comparing the first and last time periods. We evaluated trends in the magnitude of absolute and relative inequalities in mortality across socioeconomic groups by calculating risk differences and risk ratios (RRs). We estimated RRs and corresponding 95% confidence intervals (CIs) by fitting Poisson regression models, with death as a dependent variable, socioeconomic status (i.e., household income quintile or level of educational attainment) as a categoric independent variable, and age measured in continuous years as an adjustment variable. In each model, we treated the highest socioeconomic category as the reference group.
Census respondents whose records were successfully integrated with the Canadian Mortality Database tended to be younger and more socioeconomically advantaged than the larger pool of eligible respondents. To adjust for any resulting error and account for the complex survey design, we applied sampling weights and bootstrap replicate weights provided by Statistics Canada.
We conducted all statistical analyses using Stata 16.0 (StataCorp).
Ethics approval
Data accessed through the Statistics Canada Research Data Centre Program are subject to strict confidentiality and disclosure protocols, as set out in the Statistics Act of Canada. These data are exempt from formal ethics review and approval, as stipulated in Article 2.2(a) of the Tri-Council Policy Statement: Ethical Conduct for Research Involving Humans.40
Results
A description of the study population is provided in Table 1. Trends in premature and avoidable (preventable and amenable) mortality rates are presented in Table 2, Table 3 and Table 4. The figures show trends in premature (Figure 1 and Figure 2), preventable (Figure 3 and Figure 4) and amenable (Figure 5 and Figure 6) mortality inequalities by income and educational levels, respectively. Supporting data for the figures are presented in Appendix 1, Supplementary Tables S1–S6.
Descriptive characteristics of the Canadian Census Health and Environment Cohorts
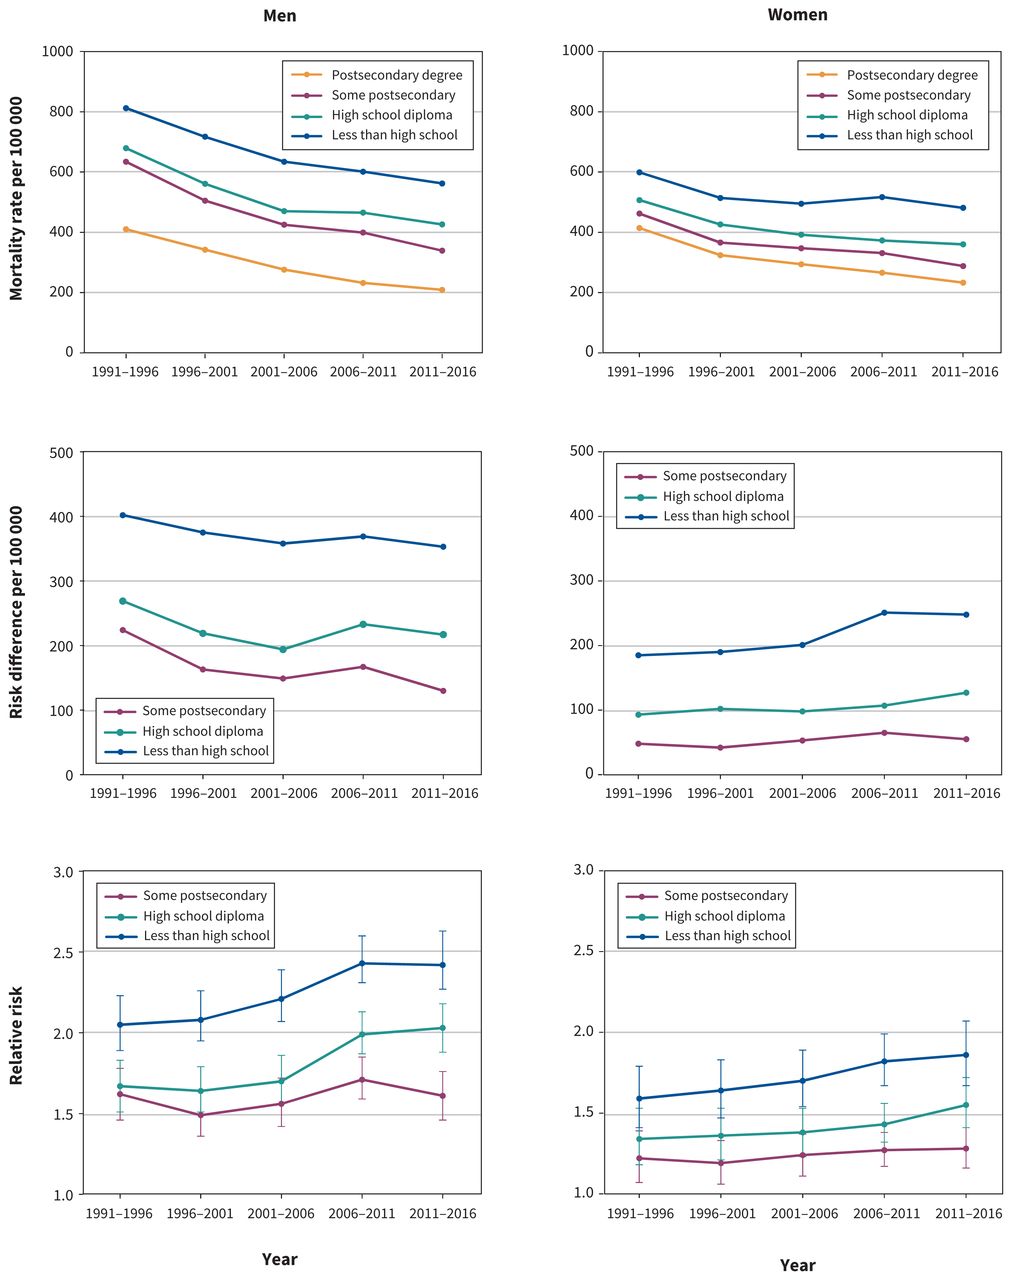
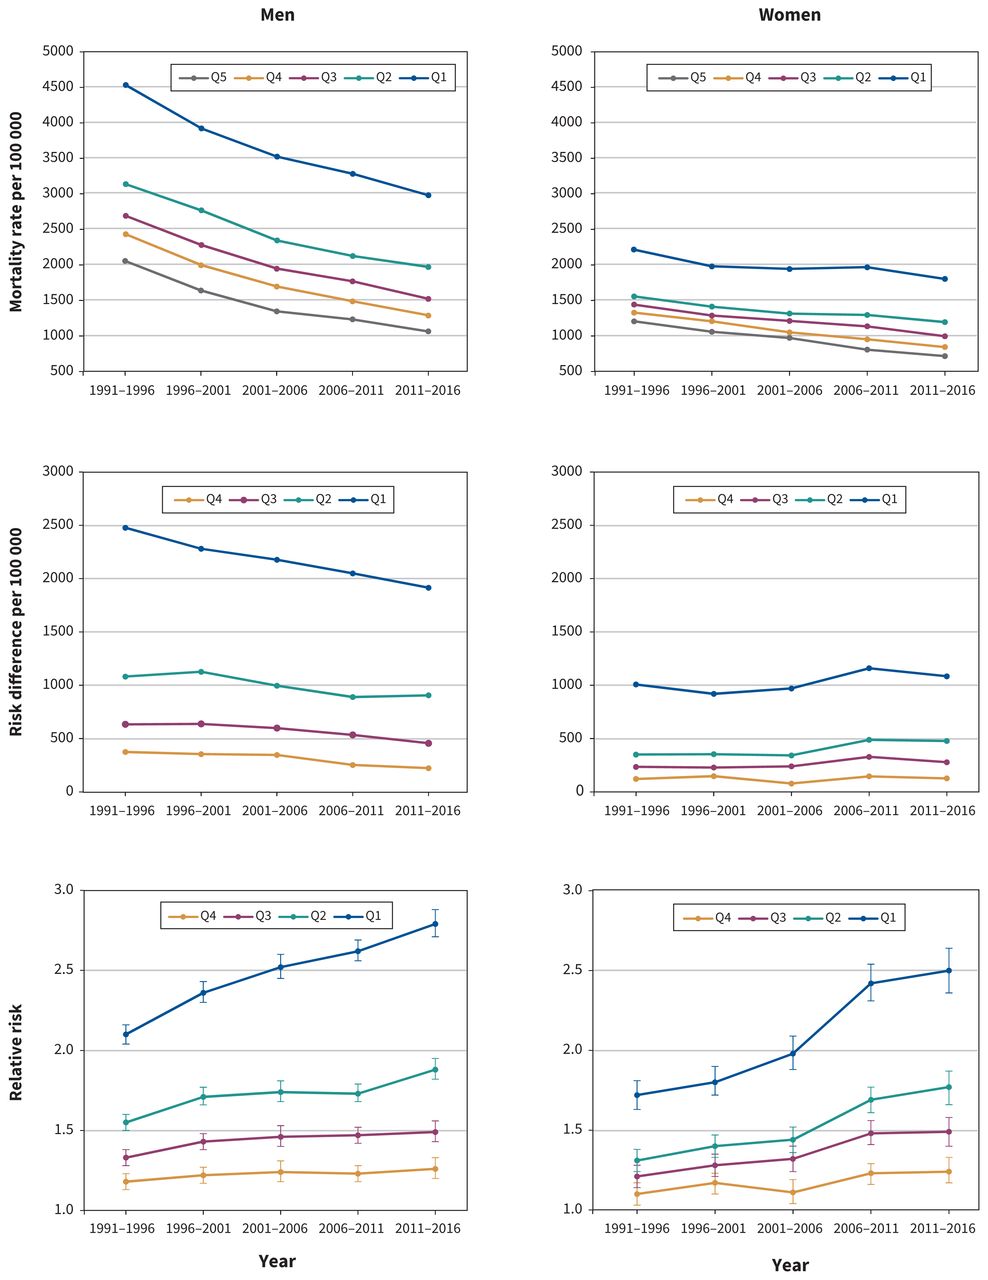
Trends in premature mortality across socioeconomic groups in Canada, 1991–2016
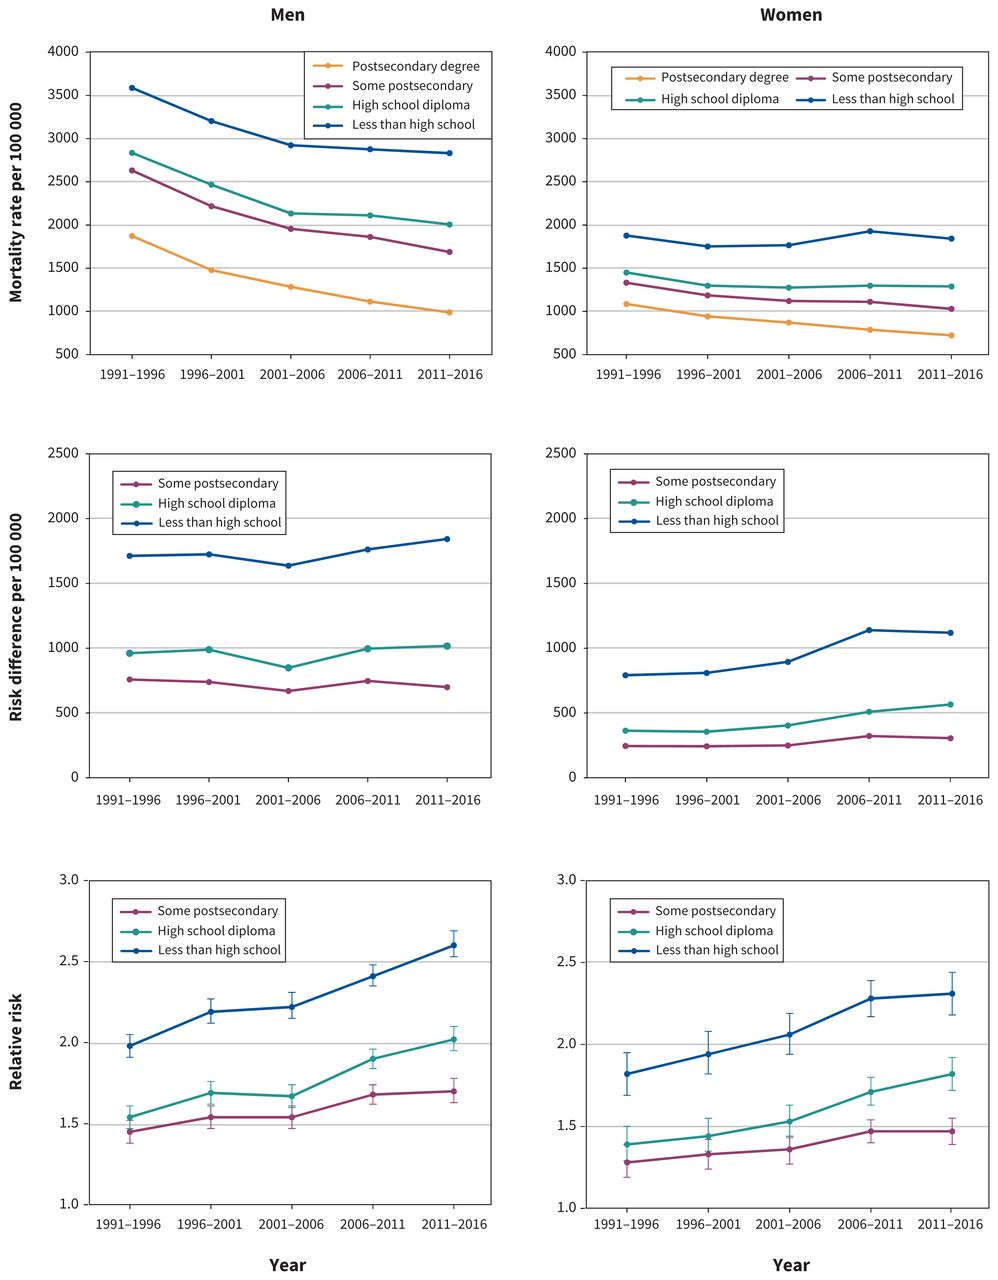
Trends in preventable (avoidable) mortality across socioeconomic groups in Canada, 1991–2016
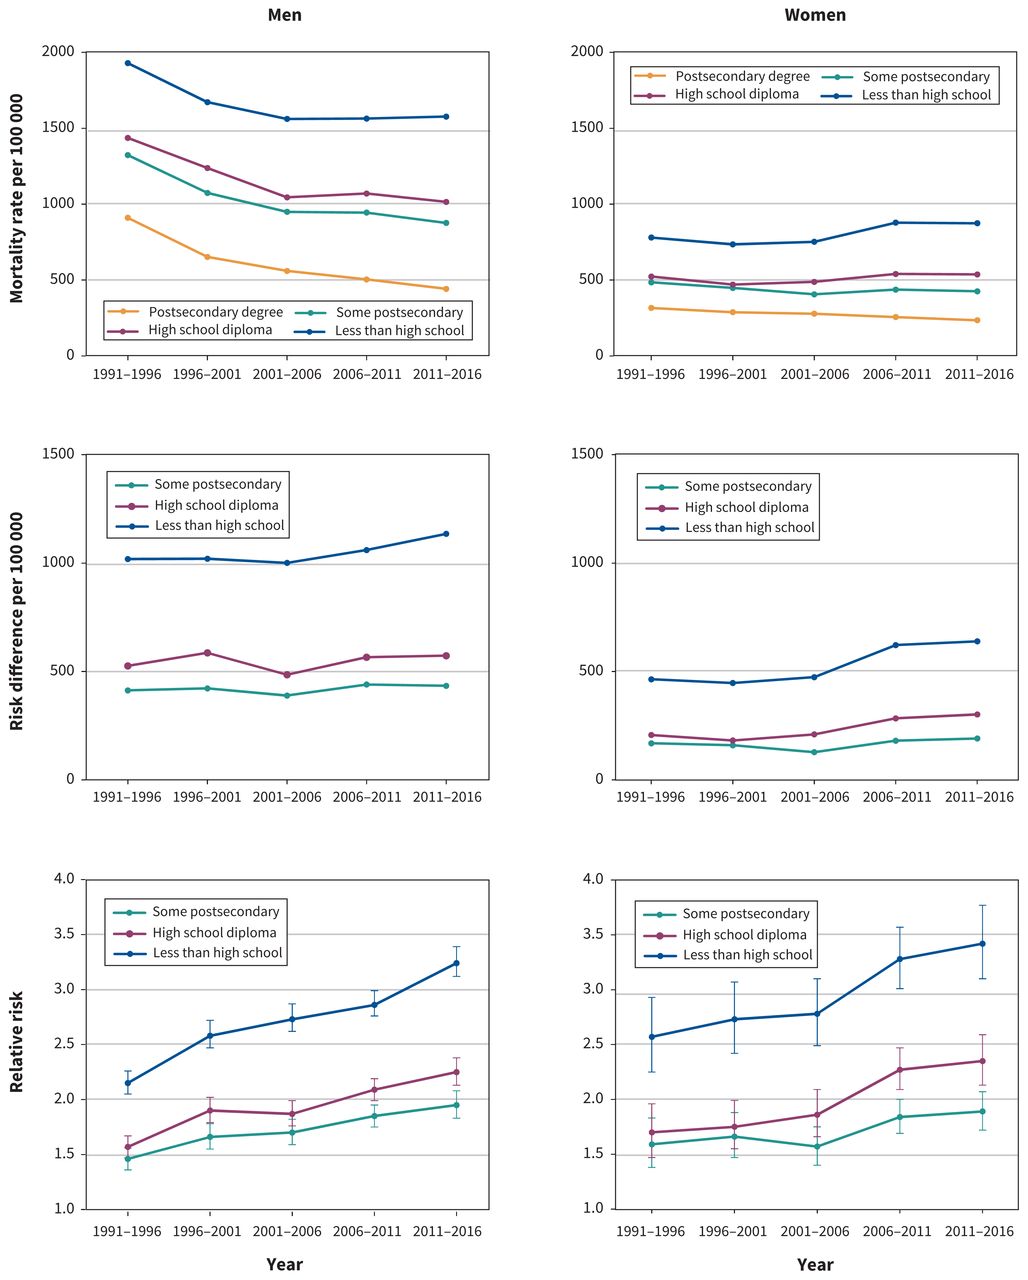
Trends in amenable (avoidable) mortality across socioeconomic groups in Canada, 1991–2016

Trends in inequalities in premature mortality by income quintile in Canada, 1991–2016. Q5 = highest quintile, Q1 = lowest quintile. Q1 to Q4 were compared to Q5. Error bars represent 95% confidence interval.

Trends in inequalities in premature mortality by education level in Canada, 1991–2016. The comparator was postsecondary degree. Error bars represent 95% confidence interval.

Trends in inequalities in preventable (avoidable) mortality by income quintile in Canada, 1991–2016. Q5 = highest quintile, Q1 = lowest quintile. Q1 to Q4 were compared to Q5. Error bars represent 95% confidence interval.

Trends in inequalities in preventable (avoidable) mortality by education level in Canada, 1991–2016. The comparator was postsecondary degree. Error bars represent 95% confidence interval.

Trends in inequalities in amenable (avoidable) mortality by income quintile in Canada, 1991–2016. Q5 = highest quintile, Q1 = lowest quintile. Q1 to Q4 were compared to Q5. Error bars represent 95% confidence interval.
Trends in inequalities in amenable (avoidable) mortality by education level in Canada, 1991–2016. The comparator was postsecondary degree. Error bars represent 95% confidence interval.
Premature mortality rates declined progressively over the study period in all socioeconomic groups, except for women without a high school diploma. Among men, premature mortality rates declined more steeply at the lower end of the income distribution than at the higher end. Consequently, absolute inequalities between higher-and lower-income men decreased over time. For example, the absolute risk difference (per 100 000) between men in the highest and lowest income quintiles decreased considerably over the study period, from 2478 deaths to 1915 deaths (Figure 1). This favourable pattern was somewhat reversed across levels of educational attainment, with the absolute gap between the most- and least-educated men increasing over the study period, from 1713 deaths to 1843 deaths (Figure 2). Among women, absolute inequalities widened more consistently. Absolute risk differences (per 100 000) between women in the highest and lowest income quintiles increased over time, from 1008 deaths to 1085 deaths. The absolute gap between the most- and least-educated women widened over the study period, from 792 deaths to 1119 deaths per 100 000.
Among both men and women, we observed a secular increase in relative inequalities in premature mortality by income. The Q1/Q5 RR grew progressively larger over the study period, from 2.10 (95% CI 2.02–2.17) to 2.79 (95% CI 2.66–2.91) among men and from 1.72 (95% CI 1.63–1.81) to 2.50 (95% CI 2.36–2.64) among women (Figure 1). Risk ratios associated with the remaining quintiles of the income distribution showed similar, though less pronounced, trends over time. Relative educational inequalities in premature mortality also widened gradually over the study period. For example, among men and women without a high school diploma, the relative risk of premature mortality increased from 1.98 (95% CI 1.90–2.07) to 2.60 (95% CI 2.48–2.72) and from 1.82 (95% CI 1.69–1.95) to 2.31 (95% CI 2.18–2.44), respectively (Figure 2).
Similar overall trends were observed for avoidable (i.e., preventable and amenable) mortality. We observed some distinguishable cause-specific trends, however, and these trends were patterned by sex. For example, in contrast to large secular declines among men in all socioeconomic groups, women with a high school diploma or less experienced little to no improvements in preventable mortality over the study period. Among men, there were larger absolute reductions in preventable mortality inequalities over time. In contrast, women experienced larger absolute reductions in amenable mortality inequalities over the study period. Relative inequalities in preventable and amenable mortality increased at a comparable pace among men, whereas relative inequalities in preventable mortality rose more steeply than corresponding inequalities in amenable mortality among women.
Interpretation
We found that premature and avoidable mortality rates declined in most socioeconomic groups in Canada between 1991 and 2016. However, socioeconomically disadvantaged groups did not benefit equally from these overall decreases in mortality. Among women without a high school diploma, premature mortality rates persisted, and, more strikingly, avoidable mortality attributable to preventable causes of death increased. Owing to the uneven distribution patterning of recent decreases in mortality, relative socioeconomic inequalities in premature and avoidable mortality increased substantially among men and women between 1991 and 2016. Absolute education-related inequalities also widened consistently over the study period, whereas absolute income-related inequalities narrowed among men and widened among women.
Our results are similar to those reported in previous studies examining trends in socioeconomic inequalities in mortality in Canada.9–15 However, our findings indicate that socioeconomic inequalities in premature and avoidable mortality are substantially wider than corresponding inequalities in overall mortality. More important, perhaps, they show that recent adverse trends in the relative magnitude of premature and avoidable mortality inequalities are also more pronounced. For example, whereas a previous study using the same data to examine trends in overall mortality showed that relative inequalities between the highest and lowest income quintiles increased by 12% among men and by 21% among women between 1991 and 2011,15 we found that, over the same period, relative inequalities in premature mortality increased by 33% among men and by 47% among women. Our findings are also consistent with the broader international literature on this topic. For example, recent studies have shown that relative socioeconomic inequalities in overall and premature mortality have widened substantially in most European countries, whereas absolute inequalities have declined in some cases and increased in others.3,24,41,42 Widening overall and premature mortality inequalities have also been reported in the US, where, in absolute terms at least, adverse trends have been more pronounced.2,4–6,43–45 Indeed, after several decades of secular gains in life expectancy among all socioeconomic groups in the US, mortality rates have started to rise among the lowest-earning and least-educated Americans. Similarly, in the present study, we observed a startling lack of decline in mortality rates among women with lower educational attainment, particularly for causes of death that are potentially avoidable through primary intervention strategies. In fact, contrary to the generally declining mortality rates observed in all other socioeconomic groups, our results suggest that preventable mortality has increased among women without a high school diploma. Thus, although our results suggest that mortality rates have evolved more favourably among socioeconomically disadvantaged groups in Canada than among their counterparts in the US, the fact that declines in premature mortality have stalled or, for some causes, even reversed among the most socioeconomically disadvantaged women raises pressing concerns with respect to the pursuit of health and gender equity in Canada.47
There are numerous possible explanations for our findings. First, and perhaps most important, inequalities in mortality may be widening owing to contemporaneous trends in social determinants of health.48–51 Over the past 3 decades, large-scale policy shifts in Canada have contributed to rising levels of income inequality and a weakened social safety net (e.g., as indicated by the declining generosity and coverage of key social programs, such as employment insurance and social assistance).52–54 These societal trends are not unique to Canada and may, in turn, explain why the health of socioeconomically disadvantaged groups is lagging further and further behind that of their more advantaged counterparts in numerous jurisdictions, including the US and peer countries in Europe.4,55–60 Changing social and economic conditions may also explain why mortality rates have stalled or increased among women with lower levels of education. Evidence suggests, for example, that women rely more heavily than men on government transfers as a source of income and that declines in the generosity and coverage of these programs have disproportionately affected the most socioeconomically disadvantaged women.61,62 Furthermore, although participation in the labour market has increased substantially among women with lower education levels, they face major barriers to gainful and secure employment — barriers that are potentially compounded by persisting gender inequities in caregiving responsibilities.63,64
Second, socioeconomic lags in the diffusion of new technologies (e.g., in medical care) and interventions (e.g., in health promotion) are well established.65–67 In Canada, for example, higher socioeconomic groups have benefited more from the implementation of routine public health interventions aimed at reducing risk factors such as smoking and physical inactivity.68,69 Differential access and uptake between socioeconomic groups may, in turn, give rise to increasing mortality inequalities over time. Given that, historically, the prevalence of these risk factors has been higher among men, it is perhaps not surprising to find, as we have in this study, that recent improvements in preventable and avoidable mortality are also more heavily concentrated in men, particularly at the lower end of the socioeconomic spectrum. This finding is consistent, for example, with evidence that lower-educated men have experienced larger absolute and relative declines in smoking prevalence than lower-educated women over the last several decades.69,70
Third, as socioeconomic circumstances improve within a population (e.g., owing to increasing levels of educational attainment), those who fall in the lowest categories of socioeconomic status may represent a more negatively selected group of people. 71,72 For example, the composition of these groups may change over time such that they are more heavily composed of people with chronic diseases and disabilities.73,74 Given that educational expansion has progressed more rapidly for women than men,75 resulting selection effects may also be stronger among women, and, accordingly, this may be an important factor contributing to the overall more negative mortality trends observed among lower-educated women in Canada.76–78
Finally, research has shown that relative inequalities in mortality have a tendency to increase as absolute mortality rates decrease.79–81 Larger absolute reductions in mortality among men may also explain why the absolute income-related gradient narrowed in men but not in women. Indeed, our findings suggest that improvements in public health and health care have contributed substantially toward mitigating premature mortality among men, particularly at the lower end of the socioeconomic spectrum, but much less so among women.
Limitations
We relied on self-reported measures of income and education, which may have been subject to response biases. Second, although we attempted to correct for differential probabilities of Census response and record linkage using sampling weights provided by Statistics Canada, we have no way of evaluating the extent to which our analyses are affected by any resulting selection bias. Third, owing to the voluntary nature of the National Household Survey, it is likely that estimates based on the 2011 survey (response rate 68.6%) are less representative than findings from the earlier cohorts, which were based on the mandatory long-form Census. However, to assess the resulting impact on data quality, Statistics Canada conducted extensive sensitivity analyses and determined that the National Household Survey data are of sufficient high quality to produce precise and comparable estimates in population-based studies.82 Fourth, our study did not consider the impact of the changing demographic composition of the Canadian population (e.g., due to urbanization and immigration) on differential mortality trends across socioeconomic groups, and future research could explore this. Finally, our study provides only a broad view of trends in cause-specific (i.e., preventable and amenable) inequalities in mortality. Further research involving a deeper analysis of specific causes of death — and for men and women separately — may be useful for highlighting where Canada has made the most (and the least) progress toward health equity. Such work may also reveal the underlying mechanisms contributing to the trends observed in this study, including the discernible differences between men and women.83 In particular, more detailed cause-specific analyses are needed to better understand why premature mortality rates have stalled (and for some causes even risen) among lower-educated women.
Conclusion
Our findings indicate that Canada has made no overall progress toward the goal of reducing socioeconomic inequalities in premature and avoidable mortality. In fact, the strength of the association between socioeconomic status and mortality appears to have increased substantially between 1991 and 2016. Efforts to reduce socioeconomic inequalities and associated patterns of disadvantage are necessary to prevent this pattern of widening health inequalities from persisting or worsening over time.
Footnotes
Competing interests: None declared.
This article has been peer reviewed.
Contributors: Faraz Shahidi and Abtin Parnia acquired and analyzed the data. All of the authors conceptualized and designed the study, interpreted the data, drafted the manuscript and revised it critically for important intellectual context, approved the final version to be published and agreed to be accountable for all aspects of the work.
Funding: Faraz Shahidi is supported by the Canadian Institutes of Health Research and the Institute for Work & Health. Arjumand Siddiqi is supported by the Canada Research Chair in Population Health Equity.
Disclaimer: The funders played no role in the study design, data collection and analysis, decision to publish or preparation of the manuscript.
Data sharing: The data used in this study are held securely by Statistics Canada. As the Canadian Census Health and Environment Cohorts contain potentially identifiable information, Statistics Canada is prohibited by law from making the data available to the general public. Researchers may request access to the data by submitting an application to the Canadian Research Data Centre Network: info{at}crdcn.org or nancy.hofmann{at}canada.ca (director, Microdata Access Division). Information about the application procedure can be found at the following link: https://crdcn.org/research.
- Accepted June 2, 2020.