


Article Figures & Tables
Figures
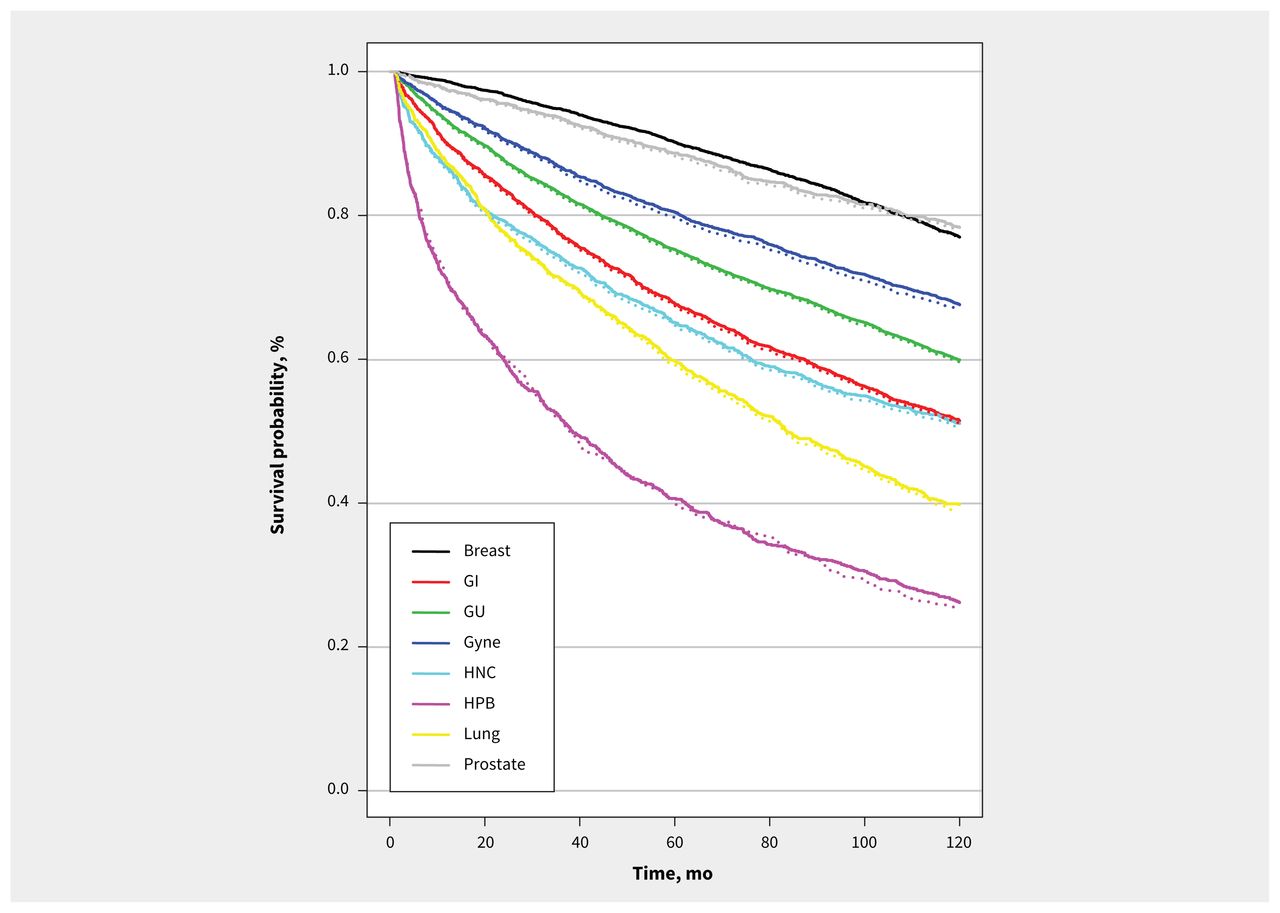
- Figure 1:
Modelled survival outcomes from base-case analysis of simulated prepandemic (solid line) and pandemic (dotted line) populations, by cancer disease site. Note: GI = gastrointestinal, GU = genitourinary, Gyne = gynecological, HNC = head and neck, HPB = hepatobiliary.
Tables
Variable Cancer site Breast GI GU Gyne HN HPB Lung Prostate No. of patients awaiting cancer surgery on day 1 of pandemic* 922 390 1619 444 288 158 263 555 Daily no. of new patients awaiting cancer surgery† 36 18 36 16 11 6 10 7 Time on wait-list for day 1 patients, d‡ 55 63 55 37 62 71 20 70 Operating room capacity during pandemic§ Month 1 60 60 60 60 60 60 60 60 Month 2 70 70 70 70 70 70 70 70 Months 3–6 85 85 85 85 85 85 85 85 Risk of progression¶ Low Mod. Mod. Mod. High High Mod. Low Daily HR applied for risk of death associated with increase in wait time 1.0030 1.0056 1.0056 1.0056 1.0056 1.0056 1.0056 1.0030 WM-1 1.0027 1.0052 1.0052 1.0052 1.0052 1.0052 1.0052 1.0027 WM-2 1.0032 1.0060 1.0060 1.0060 1.0060 1.0060 1.0060 1.0032 WM-3 1.0030 1.0056 1.0056 1.0056 1.0105 1.0105 1.0056 1.0030 Note: GI = gastrointestinal, GU = genitourinary, Gyne = gynecological, HN = head and neck, HPB = hepatobiliary, HR = hazard ratio, Mod. = moderate; OH-CCO = Ontario Health – Cancer Care Ontario, SE = standard error, WM = wait time mortality, WTIS = Wait Time Information System.
↵* Number of patients on day 1 represents the estimate for patients already on the wait-list for cancer surgery as of the first day of the pandemic, as derived from OH-CCO WTIS data from 2019.
↵† Daily number of new patients awaiting cancer surgery estimated from the total volume of patients waiting for cancer surgery over a 3-month time period in 2019, derived from OH-CCO WTIS data.
↵‡ Time on waitlist for patients on wait-list as of the first day of the pandemic initially estimated from the mean, cancer-specific wait time in July 2019, with further calibration to target total model wait time to real-world wait times in the base-case analysis. This estimate represents the wait time that patients waiting for cancer surgery had already waited as of the start of the model.
↵§ The provincial operating room capacity within the first 6 months of the initial pandemic declaration was derived from OH-CCO data. This was characterized as the operating room capacity within the first month (month 1), operating room capacity within the second month (month 2) and operating capacity in the third through sixth month (months 3–6).
↵¶ A cancer’s risk of progression to death is based upon its historical 5-year survival estimates, classified as low risk of progression (5-yr survival > 90%), moderate risk of progression (5-yr survival 50%–90%) or high risk of progression (5-yr survival < 50%). (9) To account for the uncertainty in the daily HR for risk of death applied with increases in wait time, scenario analyses were conducted using alternative HRs to depict lower risk of death owing to longer wait times for all cancers (WM-1), higher risk of death owing to longer wait times for all cancers (WM-2), and higher risk of death owing to longer wait times for cancers classified at a high risk of progression (WM-3).
- Table 2:
Results from the base-case analysis for wait time, life-years lost and 10-year survival in the prepandemic and pandemic simulation models*
Cancer site Prepandemic Pandemic No. of patients Wait time, d 10-year survival, % No. of patients Wait time, d Incremental increase in wait time, d 10-year survival, % Life-years lost (95% CrI) per patient Life-years lost (95% CrI) per population All patients 22 799 25 61.7 20 177 32 7 61.3 – 843 (646–950) Breast 5566 18 77.2 4497 22 4 76.9 0.01 (0–0.01) 44 (0–44) GI 2812 21 51.4 2351 26 5 51.1 0.05 (0.05–0.06) 117 (117–141) GU 6263 30 59.9 5924 36 6 59.6 0.07 (0.06–0.07) 414 (355–414) Gyne 2508 26 67.6 2508 34 8 66.8 0.04 (0.02–0.05) 100 (50–125) HN 1707 28 51.1 1572 37 9 50.5 0.05 (0.03–0.06) 78 (47–94) HPB 932 23 26.0 782 28 5 25.1 0.02 (0.02–0.04) 15 (15–31) Lung 1553 22 39.8 1242 29 7 39.1 0.04 (0.04–0.05) 49 (49–62) Prostate 1458 52 78.3 1301 64 12 77.9 0.02 (0.01–0.03) 26 (13–39) Note: CrI = credible interval, GI = gastrointestinal, GU = genitourinary, Gyne = gynecological, HN = head and neck, HPB = hepatobiliary.
↵* Model output for the base-case analysis depicting the mean wait time and survival outcomes of patients with cancer by disease site, in the prepandemic (i.e., with full operating room resources) and pandemic (i.e., with an initial slow-down of 60% operating room resources for month 1, 70% for month 2 and 85% for months 3–6) periods. The volume of simulated patients excludes those who may have undergone mitigation strategies with either systemic therapy or radiation therapy (Appendix 1, Supplemental data, available at www.cmaj.ca/lookup/doi/10.1503/cmaj.202380/tab-related-content).
- Table 3:
Results of pandemic surgical slowdown scenario analyses modelling alternative, hypothetical reductions in operating room resources
Scenario Mean wait time, d Incremental increase in wait time,* d Life-years lost per patient (95% CrI) Life-years lost per population† (95% CrI) 10-year survival, % Difference in 10-year survival,* % All patients PSS-1 40 15 – 1539 (1349–1765) 60.9 −0.8 PSS-2 37 12 – 1306 (1111–1425) 61.0 −0.7 Breast PSS-1 28 10 0.01 (0–0.02) 44 (0–89) 76.9 −0.3 PSS-2 26 8 0.01 (0–0.01) 44 (0–44) 76.9 −0.3 GI PSS-1 33 12 0.07 (0.07–0.08) 164 (164–188) 50.8 −0.6 PSS-2 30 9 0.05 (0.04–0.06) 117 (94–141) 50.9 −0.5 GU PSS-1 43 13 0.11 (0.10–0.12) 651 (592–710) 58.8 −1.1 PSS-2 41 11 0.10 (0.09–0.10) 592 (533–592) 59.2 −0.7 Gyne PSS-1 43 17 0.09 (0.08–0.10) 225 (200–250) 66.2 −1.4 PSS-2 40 14 0.07 (0.06–0.08) 175 (150–200) 66.5 −1.1 HN PSS-1 45 17 0.10 (0.09–0.12) 157 (141–188) 50.0 −1.1 PSS-2 42 14 0.08 (0.07–0.09) 125 (110–141) 50.2 −0.9 HPB PSS-1 36 13 0.09 (0.08–0.11) 70 (62–86) 24.7 −1.3 PSS-2 33 10 0.08 (0.06–0.10) 62 (46–78) 24.8 −1.2 Lung PSS-1 38 16 0.09 (0.07–0.10) 111 (86–124) 38.2 −1.6 PSS-2 35 13 0.06 (0.06–0.08) 74 (74–99) 39.0 −0.8 Prostate PSS-1 73 21 0.09 (0.08–0.10) 117 (104–130) 77.5 −0.8 PSS-2 71 19 0.09 (0.08–0.10) 117 (104–130) 77.6 −0.7 Note: CrI = credible interval, GI = gastrointestinal, GU = genitourinary, Gyne = gynecological, HN = head and neck, HPB = hepatobiliary, PSS-1 = pandemic surgical slowdown scenario of 60% operating room resources for first 6 months of pandemic; PSS-2 = pandemic surgical slowdown scenario of 60% operating room resources for the first 2 months of the pandemic and 75% resources for the next 4 months.
↵* Compared with modelled prepandemic population with full operating room resources.
↵† Life-years lost per population represented as the life-years lost per affected Ontario population.
In this issue

Article tools


Jump to section
Related Articles
Cited By...
- No citing articles found.
More in this TOC Section
Similar Articles
Collections

