


Abstract
BACKGROUND: New case-mix tools from the Canadian Institute for Health Information offer a novel way of exploring the prevalence of chronic disease and multimorbidity using diagnostic data. We took a comprehensive approach to determine whether the prevalence of chronic disease and multimorbidity has been rising in Ontario, Canada.
METHODS: In this observational study, we applied case-mix methodology to a population-based cohort. We used 10 years of patient-level data (fiscal years 2008/09 to 2017/18) from multiple care settings to compute the rolling 5-year prevalence of 85 chronic diseases and multimorbidity (i.e., the co-occurrence of 2 or more diagnoses). Diseases were further classified based on type and severity. We report both crude and age- and sex-standardized trends.
RESULTS: The number of patients with chronic disease increased by 11.0% over the 10-year study period to 9.8 million in 2017/18, and the number with multimorbidity increased 12.2% to 6.5 million. Overall increases from 2008/09 to 2017/18 in the crude prevalence of chronic conditions and multimorbidity were driven by population aging. After adjustments for age and sex, the prevalence of patients with ≥ 1 chronic conditions decreased from 70.2% to 69.1%, and the prevalence of multimorbidity decreased from 47.1% to 45.6%. This downward trend was concentrated in minor and moderate diseases, whereas the prevalence of many major chronic diseases rose, along with instances of extreme multimorbidity (≥ 8 conditions). Age- and sex-standardized resource intensity weights, which reflect relative expected costs associated with patient diagnostic profiles, increased 4.6%.
INTERPRETATION: Evidence of an upward trend in the prevalence of chronic disease was mixed. However, the change in case mix toward more serious conditions, along with increasing patient resource intensity weights overall, may portend a future need for population health management and increased health system spending above that predicted by population aging.
Multimorbidity exists when a patient is diagnosed with 2 or more chronic diseases. Patients with multimorbidity present challenges for physicians managing their care and, as the proportion of these patients in the population increases, for health care system planning. The prevalence of multimorbidity and chronic disease has been strongly associated with primary care use, specialist consultations, number and intensity of inpatient hospital admissions and other types of care.1–7 Among beneficiaries of fee-for-service Medicare in the United States, expenditures for those with 4 or more chronic diseases were reported to be 66 times higher than for those with none.8 One study found that most health spending growth (77.6%) in the US between 1987 and 2011 could be attributed to patients with 4 or more diseases.9
Several recent studies have estimated the prevalence of chronic disease and multimorbidity in Canada.3,10–13 Rates of multimorbidity ranged from 10% to 25%, owing to differences in classification systems used to identify chronic disease, including the choice of conditions, and variations in study population. Lack of standardization in measures of chronic disease prevalence and multimorbidity has hampered the evaluation of trends over time and across settings.
Ontario provides an ideal setting to evaluate trends in the prevalence of chronic disease because patients have access to a comprehensive set of publicly funded services. The Canadian Institute for Health Information (CIHI) has created a system that maps patient diagnosis data from all health care settings to a set of 226 clinically meaningful health conditions, covering the full spectrum of acute and chronic morbidity (Jeffrey Hatcher, Canadian Institute for Health Information, Ottawa: personal communication, 2017). CIHI’s system has been independently compared with the Johns Hopkins ACG System; CIHI’s system was deemed to be more specific and less sensitive in classifying diagnoses, making it more conservative in identifying health conditions (S. Cheng, ICES, unpublished data, 2016). The purpose of this study was to evaluate trends in the prevalence of chronic disease and multimorbidity in Ontario using CIHI’s comprehensive disease classification system.
Methods
Study design and data sources
We evaluated population trends in the prevalence of chronic disease, multimorbidity and overall patient resource intensity in Ontario, Canada, from fiscal years 2008/09 to 2017/18. We obtained individual-level health care data from the Ontario Ministry of Health and we used CIHI’s Population Grouping Methodology (version 1.1) software under a licence agreement.
We used the Registered Persons Database (RPDB) to assess eligibility for inclusion in the study population. We then linked the study population to the following Ontario health care administrative databases at the individual level, using unique encrypted identifiers: CIHI’s Discharge Abstract Database (DAD), which contains records from hospital discharges; CIHI’s National Ambulatory Care Reporting System (NACRS), which includes data from day surgeries, outpatient and community-based clinics and emergency departments; and the Ontario Health Insurance Plan (OHIP) claims database, which consists of physician billing records. Each data source contains diagnostic information that is used by CIHI’s Population Grouping Methodology.
Study population
Beginning with people listed in the RPDB, we limited the study population to those who were eligible for OHIP coverage in 1 or more of the fiscal years (FYs), from 2008/09 (FY 2008) to 2017/18 (FY 2017). We excluded people older than 105 years at the end of a given fiscal year. Individuals were required to have had at least 1 health system contact within the previous 5 fiscal years, except for children younger than 2 years. These provisions limited the likelihood of including patients who had moved out of province or died during the study period without their change in status being recorded in the RPDB. Births, deaths and attritions were permitted across years (Appendix 1, available at www.cmaj.ca/lookup/doi/10.1503/cmaj.201473/tab-related-content). We were unable to link between 0.2% (FY 2008) and 0.3% (FY 2017) of patients with DAD records, and about 0.02% of those with NACRS records, to a valid RPDB record; we linked nearly 100% of patients in the OHIP database.
Because we excluded people with no health care contacts in the previous 5 years from our analysis, the study population did not represent the full population of Ontario, particularly for young adults. At the same time, it is possible that we failed to exclude some unrecorded deaths and other exits, such that some groups may have been overrepresented, particularly older adults. To address these issues, we scaled our analysis to the actual population of Ontario by age group and sex using Census data from Statistics Canada; all prevalence statistics refer to the population of Ontario.14
Outcomes
CIHI’s case-mix methodology translates diagnostic data into 226 clinically meaningful health condition codes. At the patient level, health condition codes are grouped into 164 health profile group branches, which map onto 16 clinical categories based on condition type and seriousness. We treated individual health conditions as chronic if the corresponding health profile group defined them as falling into 1 of the 7 following CIHI clinical categories: major chronic, moderate chronic, minor chronic, major mental health, other mental health, major cancer and other cancer. For reporting purposes, we combined both cancer categories in a single category: any cancer. Patients could have conditions in multiple categories. Using CIHI’s methodology, we applied system overrides to avoid double counting chronic conditions that are part of the same disease pathway. Using this process, we identified a total of 85 unique chronic health conditions (Appendix 2, available at www.cmaj.ca/lookup/doi/10.1503/cmaj.201473/tab-related-content).15 We applied CIHI’s tagging rules, which require a confirmatory diagnosis for conditions reported in physician billing data, to minimize false-positive results.
We tracked the prevalence of chronic diseases and multimorbidity by fiscal year, 2008 through 2017, using diagnoses recorded during a rolling 5-year lookback window. For example, conditions flagged as prevalent in FY 2008 were those identified from Apr. 1, 2004, through Mar. 31, 2009. We reported the 5-year prevalence (v. 1- or 2-year prevalence) to reduce false-negative results (i.e., unobserved chronic diseases) for patients receiving sporadic care. We expected this to increase the sensitivity of the model, consistent with other studies identifying chronic conditions from administrative data in Ontario.10 We did not look back further as previous research has found decreasing returns with each additional year of lookback.16,17
We also used the CIHI methodology to produce resource intensity weights (RIWs), based on each patient’s complete health condition code profile. An RIW is an indicator of relative expected resource use, calculated in the concurrent period using a 5-year lookback. A concurrent RIW of 1.5, for example, shows that a patient’s expected resource use in that period is 1.5 times greater than for an average patient. The risk model, which is part of the CIHI case-mix methodology (Appendix 3, available at www.cmaj.ca/lookup/doi/10.1503/cmaj.201473/tab-related-content), has been validated for use in Ontario.15,18
Statistical analysis
We counted the number of chronic diseases recorded during the 5-year lookback period to determine the percentage of individuals with 1, 2 and 3 or more chronic conditions. Condition severity categories (major, moderate, minor) provide context for the types of diseases driving overall trends. We report time trends both as crude and age- and sex-standardized rates. Crude rates were meant to measure the overall change in observed chronic disease caseload, and standardized rates accounted for aging of the population. We weighted age- and sex-standardized estimates to match the age group and sex characteristics of the 2017 Census population of Ontario. Controlling for the changing population structure allowed for a more meaningful comparison of trends over time.
We tested all trends over the study period for statistical significance by performing Student t tests on linear slope coefficients. We conducted sensitivity analysis using different age restrictions, data source restrictions, lookback periods and an alternative chronic disease classification system that included only those conditions that have been commonly studied. All analyses were descriptive and were conducted using SAS software version 9.4 (SAS Institute), STATA 15 (Statacorp LLC) and Tableau Desktop Professional Edition version 10.4.1 (Tableau Software).
Ethics approval
Formal ethics approval was not required because this study used deidentified administrative health care data that were obtained from the Ontario Ministry of Health under an agreement with the Ontario Medical Association.
Results
The study population ranged from 12 770 341 in FY 2008 to 13 821 055 in FY 2017. Patients were excluded on an annual basis; on average, sample restrictions resulted in the removal of about 8.8% of person-observations, with only slight variation by year.
The number of people living with a chronic disease in Ontario exhibited substantial and statistically significant increases (p < 0.001) over the study period (Figure 1) (for statistical test results, see Appendix 4, available at www.cmaj.ca/lookup/doi/10.1503/cmaj.201473/tab-related-content). As of FY 2017, the number of patients with at least 1 of the 85 chronic diseases was estimated to be 9.8 million, an increase of 11.0% from FY 2008. Multimorbidity also increased during this period. The number of patients with 2 or more chronic diseases increased by 12.2%, and those with 3 or more increased by 13.5% (Appendix 5, available at www.cmaj.ca/lookup/doi/10.1503/cmaj.201473/tab-related-content).

Number of patients with chronic conditions in Ontario from fiscal years 2008 to 2017. Note: M = millions.
Age- and sex-standardized prevalence of chronic disease declined slightly over the study period, as 70.2% had 1 or more chronic conditions in FY 2008 compared with 69.1% in FY 2017 (p < 0.01). Overall, multimorbidity also declined modestly. The prevalence of 2 or more chronic diseases in the standardized population decreased from 47.1% in FY 2008 to 45.6% in FY 2017; for 3 or more chronic diseases, the prevalence decreased from 31.3% in FY 2008 to 29.9% in FY 2017 (p < 0.001). However, the trend varied by age. We noted small standardized increases in single disease prevalence and multimorbidity (p < 0.05) in adolescent and young adult populations (i.e., 15–24 yr), and small decreases in both (p < 0.05) among the older adult population (i.e., 45–89 yr) (Figure 2). Further, more extreme multimorbidity (≥ 8 to upwards of ≥ 15 co-occurring diseases) increased slightly on an age- and sex-standardized basis during the study period (p < 0.05) for the full population (Table 1).

Five-year prevalence of 85 chronic conditions (fiscal year 2008 v. 2017) by age group. Note: Prevalence in both fiscal years was standardized to the 2017 population.
Age- and sex-standardized prevalence of number of chronic disease conditions in Ontario, fiscal year 2008 versus 2017
Figure 3 shows statistically significant increases in the age-and sex-standardized prevalence of 1 or more major mental health disorders and cancer (0.5 and 0.9 percentage points, respectively), although the prevalence of minor and moderate physical chronic disease declined (2.7 and 2.0 percentage points, respectively). Changes in the prevalence of patients with ≥ 1 major chronic conditions and ≥ 1 other mental health conditions were not statistically significant.

Age- and sex-standardized 5-year prevalence of ≥ 1 chronic conditions by category (fiscal year 2008 v. 2017). Note: Eighty-five conditions were classified based on type and severity into existing Canadian Institute for Health Information clinical categories (Appendix 2, available at www.cmaj.ca/lookup/doi/10.1503/cmaj.201473/tab-related-content). Prevalence in both fiscal years was standardized to the 2017 population.
Of the 85 chronic conditions, 51 showed a statistically significant increase in standardized prevalence from FY 2008 to 2017, and 23 showed declining prevalence (Appendix 6, available at www.cmaj.ca/lookup/doi/10.1503/cmaj.201473/tab-related-content). The conditions with the largest declines tended to be minor or moderate. Only 3 of 21 major chronic conditions, and 1 of 6 major mental health conditions, showed statistically significant declines in standardized prevalence over the study period. Figure 4 highlights the increase in standardized prevalence of many major chronic and mental health conditions between 2008 and 2017.

Change in age- and sex-standardized 5-year prevalence of major chronic and major mental health conditions (fiscal year 2008 v. 2017). The change is expressed as the relative prevalence in 2017 compared with 2008, where the prevalence in 2008 is equal to 100%. DM = diabetes mellitus, Dx = diagnosis, HCC = health condition code, PVD = peripheral vascular disease. Note: “No DM” indicates diabetes mellitus and hypoglycemia have not been diagnosed.
The average concurrent RIW for the age- and sex-standardized population increased by 4.6% over the study period. The growth in expected resource use among patients in the top 10%, 5% and 1% of RIWs in each year exceeded that of the overall standard population, and trends were statistically significant. For the top 1% of cases specifically, the average RIW in FY 2017 was 115% of the FY 2008 value (Figure 5).
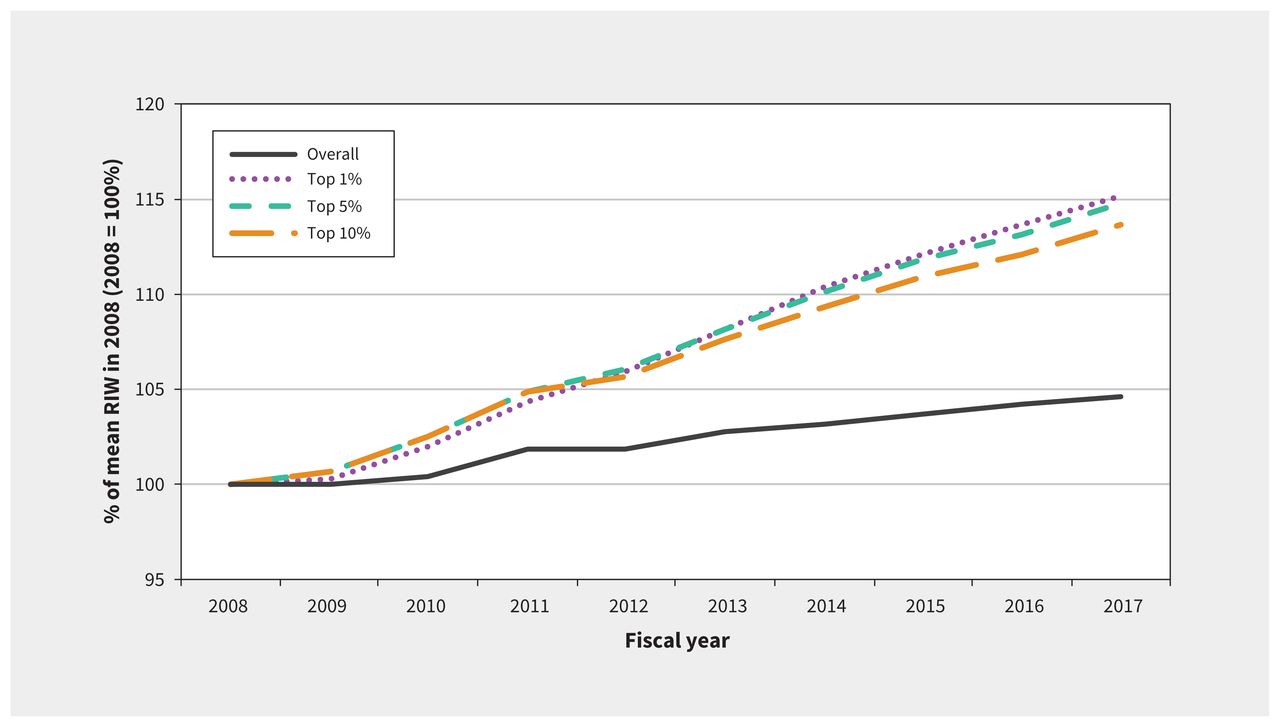
Age- and sex-standardized concurrent resource intensity weights (RIWs) from 2008 to 2017, by risk threshold (i.e., expected resource use percentiles selected to highlight patients in the top 10%, 5% and 1% of RIWs). Note: RIW is a measure of expected relative resource utilization based on a patient’s diagnostic history and is an output of the Canadian Institute for Health Information’s Population Grouping Methodology (Appendix 3, available at www.cmaj.ca/lookup/doi/10.1503/cmaj.201473/tab-related-content).
Sensitivity analysis
Several sample restrictions were imposed to test the robustness of our results. First, our analysis was reproduced using only DAD and NACRS, removing the possibility that physician billing data were driving our results. Overall, we found that the prevalence was lower. Although the slight downward trend in chronic disease prevalence over time remained, multimorbidity exhibited slight increases with this database restriction. Second, conducting the same analysis on separate age groups and removing those aged 85 years and older had little to no impact on our overall findings. Third, restricting the number of included conditions from 85 to 11 conditions that are more commonly studied — considering 5 Canadian studies on chronic disease — resulted in similar trends, albeit with lower levels of estimated comorbidity.3,10–13 Slight differences in the grouping of International Classification of Diseases, 10th Revision codes prevented exact replication. (Appendix 7, available at www.cmaj.ca/lookup/doi/10.1503/cmaj.201473/tab-related-content). Lastly, as with some previous studies,16,17 we compared the 5-year lookback with a 2-year lookback period. This resulted in lower estimates of chronic disease prevalence (Appendix 8, available at www.cmaj.ca/lookup/doi/10.1503/cmaj.201473/tab-related-content).
Interpretation
The number of patients with chronic diseases increased in Ontario between 2008 and 2017. Although age- and sex-standardized chronic disease prevalence and multimorbidity (≥ 2 and ≥ 3 conditions) fell slightly over this period, the decline was observed predominantly in minor or moderate conditions. Standardized rates of extreme multimorbidity (≥ 8 conditions) rose over this period. We also found that chronic disease prevalence increased for adolescents and young adults, which may portend an even greater future health risk for this cohort as it ages. Rising RIWs in the age- and sex-standardized patient population show that the mix of health conditions in Ontario requires increasing amounts of health system resources, beyond what would be expected from population aging alone.
Our study showed a much higher prevalence of chronic disease than previous reports.3,10–13 However, we did not find the same sharp increase in chronic disease in recent years that was noted in previous studies from Ontario. For example, one study found that rates of patients with ≥ 2 conditions increased from 22.2% in 2001 to 27.8% in 2011, adjusted for age and sex.11 Another found that the prevalence of patients with ≥ 2 conditions rose from 17.4% in 2003 to 24.3% in 2009.12
The comparatively high prevalence of chronic disease reported in our study can be attributed to the comprehensiveness of the diagnostic tools used. Although efforts have been made to move toward a more standardized methodology for reporting the prevalence of multimorbidity in Canada,19 the focus has been on improving tools for patient self-report, which is limited to a small number of common conditions.20 Studies employing administrative data have relied on subsets of between 10 and 20 chronic conditions, which reduces comparability and greatly underestimates the overall prevalence of chronic disease.21
Limitations
The utility of CIHI’s Population Grouping methodology depends on the completeness and accuracy of the diagnosis codes included in the model. Although previous studies have validated the use of diagnosis codes to capture disease prevalence in Ontario,22–24 coding practices may have changed over time. Furthermore, the CIHI model attempts to minimize false-positive results by requiring at least 2 instances of a code to be recorded in physician billing records. Hence, the CIHI model may underestimate the prevalence of some conditions. The exclusion criteria removed patients with unreliable data and those with no health system contacts, which may be related to a patient’s chronic disease status. Population characteristics like socioeconomic status, race, ethnicity and geography influence health care resource use, but were not considered. Finally, our inability to access the Ontario Mental Health Reporting System for inpatient mental health data and data from the Ontario Cancer Registry may bias our estimates for these conditions. However, diagnoses recorded in more than 1 setting contribute to establishing a patient’s diagnostic record, mitigating the impact of missing data from any 1 source.
Conclusion
This study evaluates the prevalence of chronic disease and multimorbidity by estimating patient complexity using the CIHI Population Grouping Methodology. A strength of this approach is that the CIHI system uses diagnosis codes from all available health care settings to populate a complete set of clinically meaningful conditions at the patient level, which permits a fuller accounting of chronic disease prevalence than many existing approaches and allows for a richer characterization of trends over time. Consequently, we found evidence of much higher rates of chronic disease prevalence and multimorbidity than other studies have reported. A broader notion of patient complexity should be accounted for in health system planning in Canada and beyond; the CIHI Population Grouping Methodology is one tool to support this aim.
The CIHI Population Grouping Methodology has future applications for research in needs-based health resource planning, in chronic disease surveillance and in understanding the relation between patient illness and cost. Future research using this tool may compare the prevalence of chronic conditions between or within Canadian provinces to better understand geographic factors influencing health and health human resource needs.
Footnotes
Competing interests: All authors are or were paid employees of the Ontario Medical Association.
This article has been peer reviewed.
Contributors: Mitch Steffler, Sharada Weir and Jasmin Kantarevic conceived the study and developed the analysis plan. Jasmin Kantarevic acquired the data. Mitch Steffler, Sharada Weir, Yin Li and Farshad Murtada analyzed the data. Mitch Steffler drafted the manuscript. All authors contributed to the interpretation of the data, revised the manuscript for important intellectual content, approved the final version to be published and agreed to be accountable for the work
Funding: No funding was received for this study.
Data sharing: Data for this study were used under a data sharing agreement and may not be made available.
Disclaimer: The Population Grouping Methodology is owned by the Canadian Institute for Health Information (CIHI) and used under license. Individual-level health care data were obtained from the Ontario Ministry of Health (MOH) under an agreement with the Ontario Medical Association. Both CIHI and the MOH had no involvement in or control over the design and conduct of the study; the collection, analysis, and interpretation of the data; the preparation of the data; the decision to publish; or the preparation, review, and approval of the manuscript. Interpretation and opinions expressed are those of the authors and do not necessarily reflect the views of the Ontario Medical Association.
- Accepted December 1, 2020.
This is an Open Access article distributed in accordance with the terms of the Creative Commons Attribution (CC BY-NC-ND 4.0) licence, which permits use, distribution and reproduction in any medium, provided that the original publication is properly cited, the use is noncommercial (i.e., research or educational use), and no modifications or adaptations are made. See: https://creativecommons.org/licenses/by-nc-nd/4.0/
References
In this issue

Article tools


Jump to section
Related Articles
Cited By...
- Young carers perspectives on navigating the healthcare system and co-designing support for their caring roles: a mixed-methods qualitative study
- Association of clinically significant obstructive sleep apnoea with risks of contracting COVID-19 and serious COVID-19 complications: a retrospective population-based study of health administrative data
- Effect of a multimorbidity intervention on health care utilization and costs in Ontario: randomized controlled trial and propensity-matched analyses
- Formulating Knee Osteoarthritis Management Plans Taking Type 2 Diabetes Into Account: Qualitative Study of Arthritis Therapists Using Theoretical Domains Framework
More in this TOC Section
Similar Articles

