


Article Figures & Tables
Figures
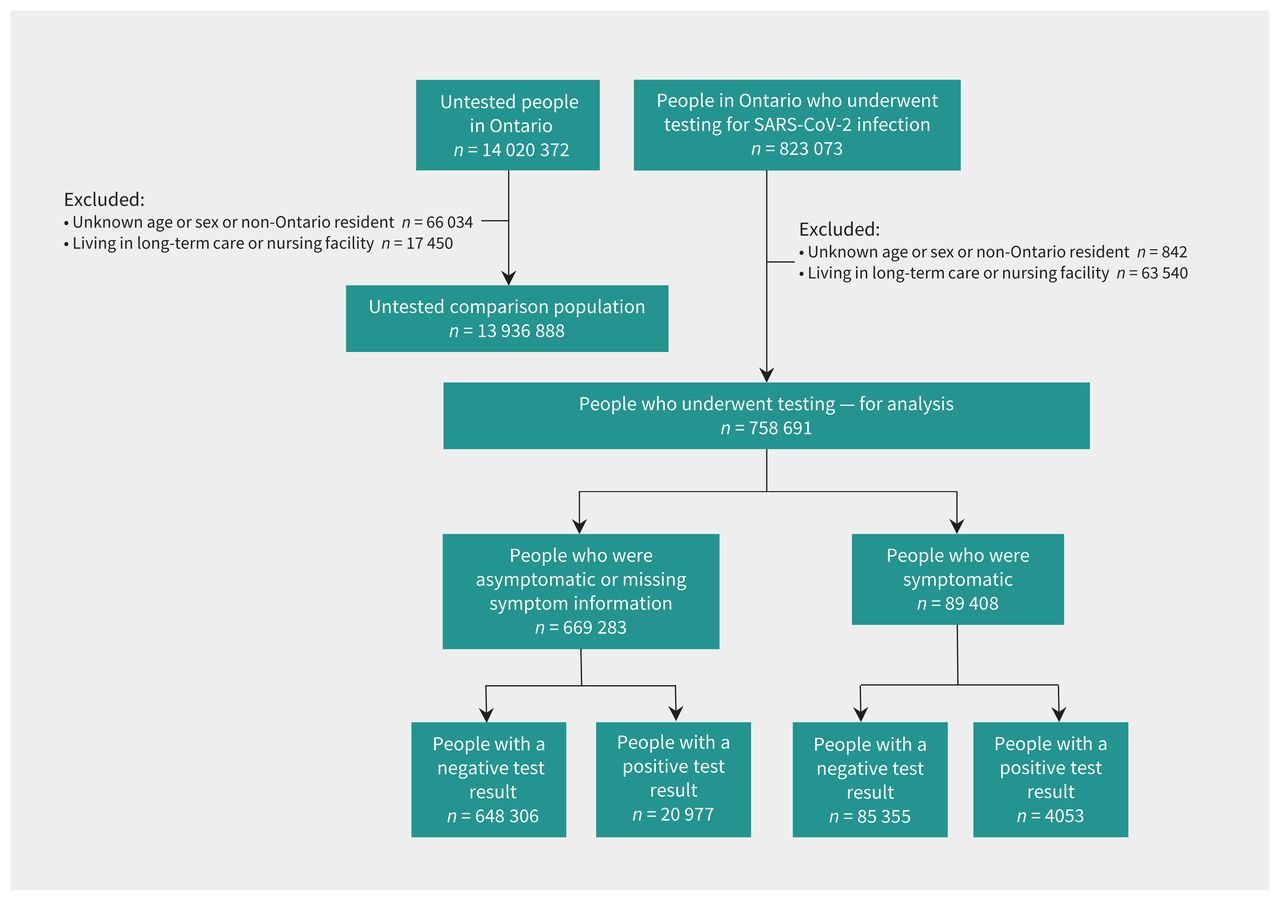
- Figure 1:
Flow chart showing inclusion and exclusion criteria and resulting analytic data sets.
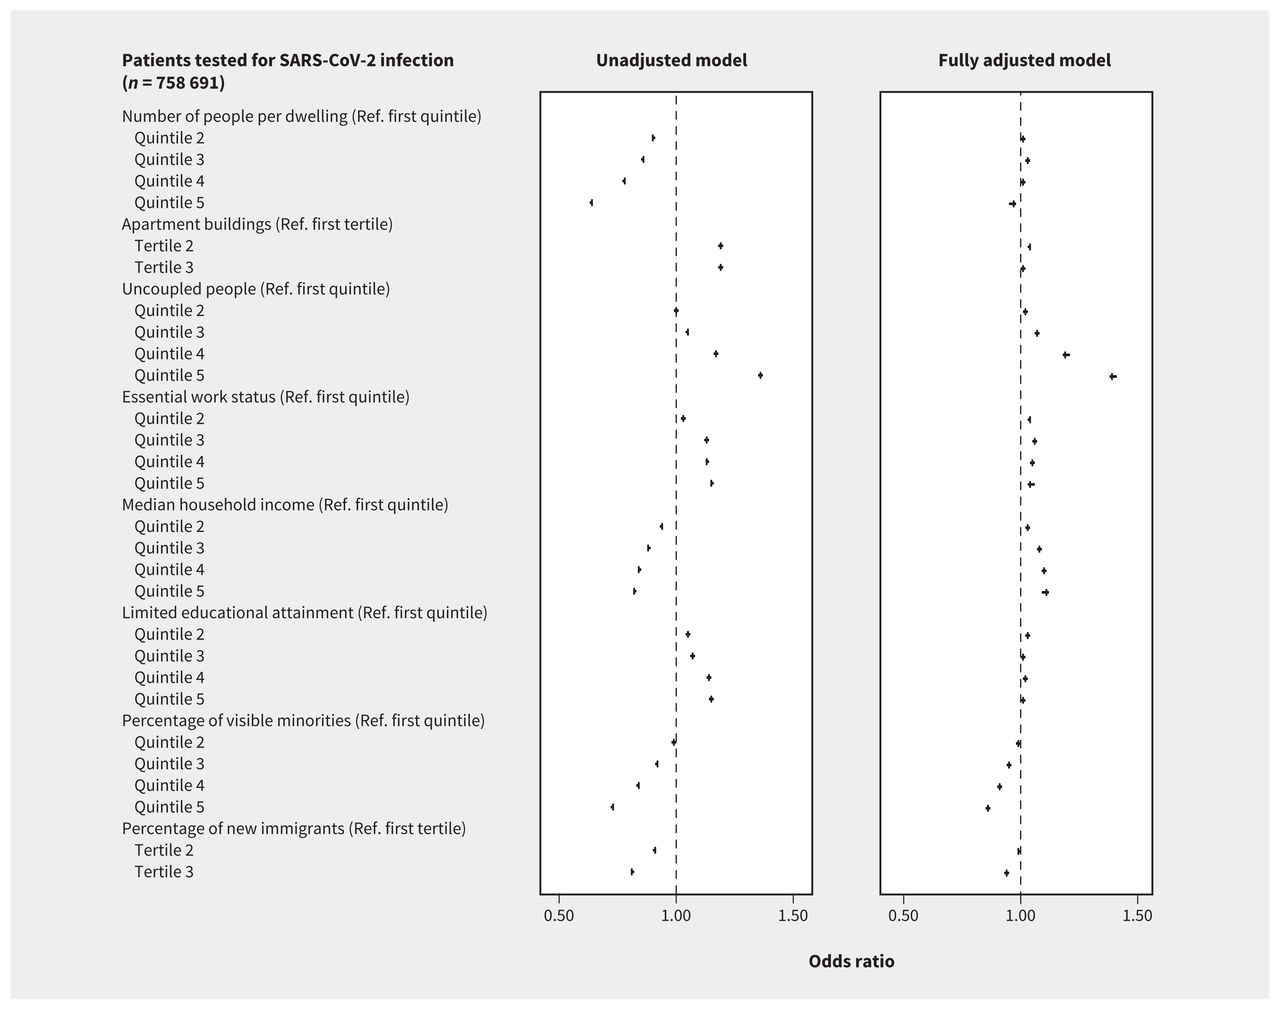
- Figure 2:
Unadjusted and fully adjusted association between social determinants of health and SARS-CoV-2 testing in Ontario (Mar. 1 to June 20, 2020) using the case–control design. Variables in this figure are listed as covariates and described in Table 2. Note: Ref. = reference category.
- Figure 3:
Unadjusted and fully adjusted association between social determinants of health and testing positive for SARS-CoV-2 in Ontario (Mar. 1 to June 20, 2020) using the case–control design. Variables in this figure are listed as covariates and described in Table 2. Note: Ref. = reference category.


Tables
- Table 1:
Characteristics of the study population tested and not tested for SARS-CoV-2 in Ontario (Mar. 1 to June 20, 2020)
Characteristic No. (%) of people who were tested* No. (%) of population of Ontario* Negative test result
n = 733 661Positive test result
n = 25 030Untested control group
n = 13 936 888Tested
n = 758 691Demographic Age, yr; mean ± SD 49.52 ± 20.99 47.45 ± 19.77 40.31 ± 22.91 49.45 ± 20.95 Male sex 289 769 (39.5) 11 627 (46.5) 6 930 233 (49.7) 301 396 (39.7) Living in rural area or small town† 82 034 (11.2) 887 (3.5) 1 390 426 (10.0) 82 921 (10.9) Chronic health condition Asthma 136 556 (18.6) 3887 (15.5) 2 085 118 (15.0) 140 443 (18.5) COPD 34 261 (4.7) 715 (2.9) 249 636 (1.8) 34 976 (4.6) Hypertension 226 111 (30.8) 7488 (29.9) 2 836 790 (20.4) 233 599 (30.8) Diabetes 108 758 (14.8) 4268 (17.1) 1 363 667 (9.8) 113 026 (14.9) Congestive heart failure 35 947 (4.9) 983 (3.9) 225 153 (1.6) 36 930 (4.9) Dementia or frailty 31 804 (4.3) 1106 (4.4) 124 295 (0.9) 32 910 (4.3) Cancer† 24 333 (3.3) 484 (1.9) 213 036 (1.5) 24 817 (3.3) Chronic kidney disease‡ 37 630 (5.1) 1122 (4.5) 254 541 (1.8) 38 752 (5.1) Immunocompromised§ 13 325 (1.8) 319 (1.3) 107 824 (0.8) 13 644 (1.8) Advanced liver disease 9020 (1.2) 212 (0.8) 78 747 (0.6) 9232 (1.2) Ischemic heart disease 33 855 (4.6) 880 (3.5) 324 682 (2.3) 34 735 (4.6) Ischemic stroke or TIA¶ 13 777 (1.9) 411 (1.6) 99 503 (0.7) 14 188 (1.9) Schizophrenia** 7526 (1.0) 220 (0.9) 64 494 (0.5) 7746 (1.0) Substance abuse** 22 238 (3.0) 478 (1.9) 216 156 (1.6) 22 716 (3.0) Health care use Adjusted Diagnostic Group (ADG) quintile 1 (0 ADGs) 31 959 (4.4) 1571 (6.3) 1 616 852 (11.6) 33 530 (4.4) 2 (1–2 ADGs) 101 895 (13.9) 3601 (14.4) 3 150 969 (22.6) 105 496 (13.9) 3 (3–4 ADGs) 149 173 (20.3) 5101 (20.4) 3 385 602 (24.3) 154 274 (20.3) 4 (5–6 ADGs) 150 394 (20.5) 5115 (20.4) 2 626 403 (18.8) 155 509 (20.5) 5 (7–27 ADGs) 300 240 (40.9) 9642 (38.5) 3 157 062 (22.7) 309 882 (40.8) Hospital admissions in the past 3 yr, mean ± SD 0.44 ± 1.34 0.33 ± 1.21 0.19 ± 0.60 0.44 ± 1.34 Outpatient physician visits in the past year, mean ± SD 7.35 ± 8.68 7.06 ± 8.33 4.67 ± 6.05 7.34 ± 8.67 Influenza vaccination (2019–2020 season) 213 722 (29.1) 5547 (22.2) 2 978 472 (21.4) 219 269 (28.9) Environmental determinant†† PM2.5 (μg/m3 per yr) 2 to < 6 161 300 (22.0) 1831 (7.3) 2 481 201 (17.8) 163 131 (21.5) 6 to < 7 91 134 (12.4) 1766 (7.1) 1 555 790 (11.2) 92 900 (12.2) 7 to < 8 207 966 (28.3) 8476 (33.9) 4 450 218 (31.9) 216 442 (28.5) 8 to < 9 211 861 (28.9) 11 127 (44.5) 4 258 069 (30.6) 222 988 (29.4) ≥ 9 59 674 (8.1) 1747 (7.0) 1 073 665 (7.7) 61 421 (8.1) NO2 (ppb per yr) 0 to 6 328 613 (44.8) 5237 (20.9) 5 505 976 (39.5) 333 850 (44.0) 6 to 8 170 693 (23.3) 5599 (22.4) 3 409 506 (24.5) 176 292 (23.2) ≥ 8 232 629 (31.7) 14 111 (56.4) 4 903 460 (35.2) 246 740 (32.5) Social determinant of health‡‡ (area level) Household density quintile§§ 1 (0–2.1) 162 623 (22.2) 3639 (14.5) 2 474 391 (17.8) 166 262 (21.9) 2 (2.2–2.4) 140 653 (19.2) 3104 (12.4) 2 368 013 (17.0) 143 757 (18.9) 3 (2.5–2.6) 104 896 (14.3) 2721 (10.9) 1 866 317 (13.4) 107 617 (14.2) 4 (2.7–3.0) 166 089 (22.6) 6321 (25.3) 3 291 097 (23.6) 172 410 (22.7) 5 (3.1–5.7) 152 578 (20.8) 8929 (35.7) 3 775 489 (27.1) 161 507 (21.3) Apartment building density category¶¶ 1 (0%–7.3%) 391 477 (53.4) 12 377 (49.4) 7 994 323 (57.4) 403 854 (53.2) 2 (7.4%–37.7%) 145 108 (19.8) 3874 (15.5) 2 478 855 (17.8) 148 982 (19.6) 3 (37.7%–104%) 190 244 (25.9) 8463 (33.8) 3 301 839 (23.7) 198 707 (26.2) Uncoupled quintile*** 1 (11.2%–33.7%) 150 044 (20.5) 3539 (14.1) 3 130 907 (22.5) 153 583 (20.2) 2 (33.7%–38.4%) 128 561 (17.5) 3915 (15.6) 2 698 847 (19.4) 132 476 (17.5) 3 (38.5%–43.6%) 127 689 (17.4) 4632 (18.5) 2 579 005 (18.5) 132 321 (17.4) 4 (43.6%–51.0%) 145 560 (19.8) 5591 (22.3) 2 633 710 (18.9) 151 151 (19.9) 5 (51.0%–94.6%) 174 985 (23.9) 7037 (28.1) 2 732 838 (19.6) 182 022 (24.0) Essential worker status††† 1 (0%–32.5%) 145 517 (19.8) 3941 (15.7) 2 969 492 (21.3) 149 458 (19.7) 2 (32.5%–42.3%) 155 189 (21.2) 5077 (20.3) 3 084 781 (22.1) 160 266 (21.1) 3 (42.3%–49.8%) 149 589 (20.4) 4686 (18.7) 2 717 510 (19.5) 154 275 (20.3) 4 (50.0%–57.5%) 143 965 (19.6) 5236 (20.9) 2 615 078 (18.8) 149 201 (19.7) 5 (57.5%–114.3%) 133 601 (18.2) 5816 (23.2) 2 399 120 (17.2) 139 417 (18.4) Household income quintile‡‡‡ 1 (lowest income) 156 320 (21.3) 7000 (28.0) 2 679 780 (19.2) 163 320 (21.5) 2 148 687 (20.3) 5288 (21.1) 2 698 807 (19.4) 153 975 (20.3) 3 145 317 (19.8) 5084 (20.3) 2 791 340 (20.0) 150 401 (19.8) 4 140 352 (19.1) 4019 (16.1) 2 809 529 (20.2) 144 371 (19.0) 5 (highest income) 138 103 (18.8) 3419 (13.7) 2 815 238 (20.2) 141 522 (18.7) Limited educational attainment quintile§§§ 1 (0.0%–4.1%) 144 457 (19.7) 3903 (15.6) 2 926 432 (21.0) 148 360 (19.6) 2 (4.1%–7.5%) 154 215 (21.0) 4477 (17.9) 2 978 444 (21.4) 158 692 (20.9) 3 (7.5%–11.4%) 151 457 (20.6) 5052 (20.2) 2 888 525 (20.7) 156 509 (20.6) 4 (11.4%–17.1%) 148 159 (20.2) 5314 (21.2) 2 659 544 (19.1) 153 473 (20.2) 5 (17.1%–94.3%) 129 580 (17.7) 6010 (24.0) 2 333 134 (16.7) 135 590 (17.9) Visible minority quintile¶¶¶ 1 (0.0%–2.2%) 130 912 (17.8) 1716 (6.9) 2 115 641 (15.2) 132 628 (17.5) 2 (2.2%–7.5%) 137 826 (18.8) 2233 (8.9) 2 255 245 (16.2) 140 059 (18.5) 3 (7.5%–18.7%) 137 744 (18.8) 3201 (12.8) 2 451 335 (17.6) 140 945 (18.6) 4 (18.7%–43.5%) 153 503 (20.9) 5466 (21.8) 3 023 752 (21.7) 158 969 (21.0) 5 (43.5%–102%) 167 893 (22.9) 12 140 (48.5) 3 940 245 (28.3) 180 033 (23.7) Recent immigration category**** 1 (0.0%–2.1%) 401 300 (54.7) 8271 (33.0) 6 967 468 (50.0) 409 571 (54.0) 2 (2.1%–4.7%) 146 772 (20.0) 5409 (21.6) 2 858 064 (20.5) 152 181 (20.1) 3 (4.7%–41.2%) 174 829 (23.8) 11 018 (44.0) 3 898 463 (28.0) 185 847 (24.5) Note: ADG = Aggregated Diagnostic Group, COPD = chronic obstructive pulmonary disease, DA = dissemination area, PM2.5 = fine particulate matter, SD = standard deviation, TIA = transient ischemic attack.
↵* Unless stated otherwise.
↵† We defined rural as being located outside the commuting zone of a city with a population greater than 10 000.
↵‡ We counted people if they had a diagnosis in the last 5 years.
↵§ We considered people to be immunocompromised if they were HIV positive, had an organ or bone marrow transplant, or had another immunodeficient condition.
↵¶ This category includes people with ischemic stroke or TIA in the last 20 years.
↵** This category includes people with a diagnosis in the last 2 years.
↵†† Values of PM2.5 > 12 μg/m3 or NO2 > 53 ppb per year has been found to be associated with increased risk of other respiratory illnesses. (52) Values of PM2.5 and NO2 are provided at the postal code, not the DA, level.
↵‡‡ All variables in this category are area-level variables at the level of the 2016 Canada Census DA.
↵§§ Range of persons per dwelling.
↵¶¶ The Census counts are randomly rounded up or down to the nearest number divisible by 5, which causes some minor imprecision: 7.3% represents the 60th percentile.
↵*** Uncoupled people are those never married (people who have never legally married and are not living with a person as a couple); separated (people who are married but who are no longer living with their spouse [for reasons other than, e.g., illness, work or school], have not obtained a divorce and are not living with a person as a couple; divorced (people who have obtained a legal divorce, have not remarried and are not living with a person as a couple); and widowed (people who have lost their married spouse through death, have not remarried and are not living with a person as a couple).
↵††† Percentage of people in the area working in the following occupations: sales and service occupations; trades, transport and equipment operators and related occupations; natural resources, agriculture and related production occupations; and occupations in manufacturing and utilities. Census counts for people are randomly rounded up or down to the nearest number divisible by 5, which causes some minor imprecision.
↵‡‡‡ Income quintile has variable cut-off values in each city or Census area, to take cost of living into account. A DA being in quintile 1 means it is among the lowest 20% of DAs in its city by income.
↵§§§ Percentage of adults aged 25–64 yr in the area who have not received any type of diploma.
↵¶¶¶ Percentage of people in the area who self-identified as a visible minority. Census counts for people are randomly rounded up or down to the nearest number divisible by 5, which causes some minor imprecision.
↵**** Percentage of people in the area who are recent immigrants; 2.1% represents the 60th percentile.
- Table 2:
Odds of ever being tested for SARS-CoV-2 and of COVID-19 diagnosis in Ontario between Mar. 1 and June 20, 2020, in fully adjusted analyses using 2 analytic designs
Determinant People tested for SARS-CoV-2 People with a diagnosis of COVID-19* Tested v. not tested adjusted OR (95% CI) Test-positive v. test-negative among all people tested† adjusted OR (95% CI) Test-positive v. not test-positive‡§ adjusted OR (95% CI) Sample size 14 695 579 758 691 14 695 579 Individual determinant Age group, yr (Ref. 0–4) 5–19 1.15 (1.13–1.18) 1.93 (1.66–2.24) 1.72 (1.49–1.99) 20–34 4.13 (4.05–4.22) 2.00 (1.75–2.30) 7.03 (6.13–8.05) 35–49 4.13 (4.05–4.21) 1.98 (1.73–2.27) 6.74 (5.88–7.73) 50–64 4.21 (4.12–4.29) 2.02 (1.76–2.32) 7.01 (6.11–8.03) 65–74 3.04 (2.98–3.11) 1.62 (1.40–1.87) 3.99 (3.46–4.60) 75–84 3.01 (2.95–3.08) 1.64 (1.41–1.90) 3.94 (3.39–4.57) ≥ 85 5.60 (5.47–5.73) 1.76 (1.51–2.06) 7.26 (6.23–8.46) Male sex 0.76 (0.76–0.76) 1.26 (1.23–1.30) 1.00 (0.98–1.03) Living in rural area or small town¶ 0.97 (0.96–0.98) 0.81 (0.74–0.88) 0.76 (0.70–0.82) Underlying chronic health condition Asthma 1.09 (1.09–1.10) 0.86 (0.83–0.89) 0.92 (0.89–0.96) COPD 1.23 (1.21–1.24) 0.89 (0.82–0.96) 1.04 (0.96–1.13) Hypertension 0.98 (0.98–0.99) 1.12 (1.08–1.16) 1.13 (1.09–1.17) Diabetes 0.98 (0.97–0.99) 1.26 (1.21–1.31) 1.19 (1.14–1.23) Congestive heart failure 1.26 (1.24–1.28) 0.99 (0.92–1.07) 1.25 (1.16–1.35) Dementia or frailty score > 15 2.12 (2.09–2.15) 1.39 (1.29–1.49) 2.60 (2.42–2.80) Cancer‡ 1.13 (1.12–1.15) 0.72 (0.66–0.80) 0.86 (0.78–0.94) Chronic kidney disease** 1.31 (1.29–1.32) 0.86 (0.80–0.93) 1.16 (1.08–1.24) Immunocompromised†† 1.30 (1.28–1.33) 0.79 (0.70–0.89) 1.02 (0.91–1.14) Advanced liver disease 1.14 (1.11–1.16) 0.79 (0.68–0.90) 0.87 (0.76–1.00) Ischemic heart disease 1.02 (1.01–1.03) 0.88 (0.82–0.95) 0.90 (0.84–0.97) Ischemic stroke or TIA‡‡ 1.15 (1.13–1.17) 1.05 (0.95–1.17) 1.18 (1.06–1.31) Schizophrenia§§ 1.24 (1.21–1.27) 0.84 (0.73–0.97) 0.99 (0.87–1.13) Substance abuse§§ 1.17 (1.16–1.19) 0.72 (0.66–0.79) 0.86 (0.79–0.95) Health care use Aggregated Diagnostic Group (ADG) quintile (Ref. = 0 ADGs) 2 (1–2 ADGs) 1.64 (1.62–1.66) 0.78 (0.73–0.84) 1.24 (1.17–1.32) 3 (3–4 ADGs) 2.07 (2.04–2.10) 0.75 (0.70–0.80) 1.46 (1.37–1.56) 4 (5–6 ADGs) 2.44 (2.41–2.48) 0.74 (0.69–0.79) 1.69 (1.57–1.81) 5 (7–27 ADGs) 3.11 (3.06–3.15) 0.75 (0.69–0.80) 2.12 (1.97–2.28) Hospital admissions in the past 3 yr (Ref. = 0 admissions) 1 0.99 (0.98–1.00) 0.93 (0.89–0.97) 0.92 (0.88–0.96) 2 1.16 (1.14–1.17) 0.86 (0.79–0.93) 1.01 (0.94–1.09) ≥ 3 1.75 (1.73–1.78) 0.82 (0.76–0.90) 1.38 (1.27–1.50) Outpatient physician visits in the past yr (Ref. = 0–1 visits) 2–4 1.08 (1.07–1.09) 1.02 (0.98–1.07) 1.12 (1.08–1.18) 5–8 1.11 (1.10–1.12) 1.03 (0.98–1.08) 1.17 (1.11–1.23) 9–14 1.17 (1.16–1.18) 0.98 (0.93–1.04) 1.17 (1.10–1.24) ≥ 15 1.36 (1.34–1.37) 0.91 (0.85–0.97) 1.22 (1.14–1.30) Influenza vaccination (2019–2020 season) 1.08 (1.08–1.09) 0.81 (0.78–0.83) 0.87 (0.85–0.90) Environmental determinants¶¶ PM2.5 category (μg/m3) (Ref. = 2–6) 6–7 0.97 (0.97–0.98) 0.91 (0.85–0.99) 0.92 (0.85–0.99) 7–8 0.92 (0.90–0.93) 1.10 (0.99–1.21) 1.00 (0.91–1.10) 8–9 0.91 (0.90–0.93) 1.29 (1.16–1.43) 1.19 (1.08–1.32) ≥ 10 0.90 (0.89–0.92) 1.45 (1.29–1.63) 1.31 (1.16–1.47) NO2 category (ppb) (Ref. = 0–6) 6–8 0.95 (0.95–0.96) 1.05 (1.00–1.11) 1.00 (0.96–1.06) ≥ 8 0.94 (0.93–0.95) 1.13 (1.06–1.21) 1.05 (0.98–1.12) Social determinant of health*** (area level) Household density quintile††† (Ref. = first quintile) 2 1.01 (1.00–1.02) 1.21 (1.14–1.27) 1.19 (1.13–1.26) 3 1.03 (1.02–1.04) 1.39 (1.31–1.48) 1.42 (1.34–1.50) 4 1.01 (1.00–1.02) 1.70 (1.61–1.79) 1.70 (1.61–1.80) 5 0.97 (0.95–0.98) 1.94 (1.82–2.07) 1.86 (1.75–1.98) Apartment building density category‡‡‡ (Ref. = first category) 2 1.04 (1.03–1.04) 1.00 (0.95–1.04) 1.02 (0.98–1.06) 3 1.01 (1.00–1.02) 1.15 (1.09–1.21) 1.18 (1.12–1.24) Uncoupled quintile§§§ (Ref. = first quintile) 2 1.02 (1.01–1.03) 0.96 (0.91–1.01) 0.97 (0.92–1.02) 3 1.07 (1.06–1.08) 0.95 (0.90–1.00) 0.99 (0.94–1.04) 4 1.19 (1.18–1.21) 0.96 (0.91–1.02) 1.11 (1.05–1.17) 5 1.39 (1.38–1.41) 1.07 (1.01–1.15) 1.41 (1.32–1.51) Essential work quintile¶¶¶ (Ref. = first category) 2 1.04 (1.03–1.04) 1.25 (1.19–1.32) 1.30 (1.24–1.37) 3 1.06 (1.05–1.07) 1.28 (1.21–1.35) 1.37 (1.30–1.45) 4 1.05 (1.04–1.06) 1.37 (1.29–1.45) 1.51 (1.42–1.60) 5 1.04 (1.03–1.06) 1.42 (1.32–1.51) 1.58 (1.48–1.69) Household income quintile (Ref. = first quintile, lowest income)**** 2 1.03 (1.02–1.04) 0.96 (0.91–1.00) 1.00 (0.96–1.05) 3 1.08 (1.07–1.09) 1.02 (0.97–1.08) 1.12 (1.06–1.18) 4 1.10 (1.09–1.11) 0.97 (0.90–1.03) 1.06 (1.00–1.13) 5 1.11 (1.09–1.12) 0.97 (0.90–1.04) 1.07 (0.99–1.15) Limited educational attainment quintile†††† (Ref. = first quintile) 2 1.03 (1.02–1.04) 1.07 (1.02–1.12) 1.09 (1.04–1.15) 3 1.01 (1.00–1.02) 1.15 (1.09–1.21) 1.15 (1.09–1.21) 4 1.02 (1.01–1.03) 1.23 (1.17–1.30) 1.21 (1.15–1.28) 5 1.01 (1.00–1.02) 1.37 (1.29–1.46) 1.33 (1.26–1.41) Visible minority quintile‡‡‡‡ (Ref. = first category) 2 0.99 (0.98–1.00) 0.96 (0.89–1.02) 0.95 (0.89–1.02) 3 0.95 (0.94–0.96) 0.97 (0.91–1.05) 0.93 (0.87–1.00) 4 0.91 (0.90–0.92) 1.07 (0.99–1.15) 0.98 (0.91–1.06) 5 0.86 (0.85–0.87) 1.27 (1.17–1.38) 1.09 (1.00–1.19) Recent immigration category§§§§ (Ref. = first category) 2 0.99 (0.99–1.00) 1.04 (1.00–1.09) 1.04 (1.00–1.08) 3 0.94 (0.93–0.95) 1.16 (1.11–1.22) 1.10 (1.05–1.15) Note: ADG = Aggregated Diagnostic Group, COPD = chronic obstructive pulmonary disease, OR = odds ratio, PM2.5 = fine particulate matter, Ref. = reference category, TIA = transient ischemic attack.
↵* All presented models are fully adjusted and contain all variables listed in this table as covariates.
↵† Pseudo-test-negative design.
↵‡ That is, all negative tests and all untested people.
↵§ Case–control design.
↵¶ We defined rural as being located outside the commuting zone of a city with population greater than 10 000.
↵** We counted people if they had a diagnosis in the last 5 years.
↵†† We considered people to be immunocompromised if they were HIV positive, had an organ or bone marrow transplant, or had another immunodeficient condition.
↵‡‡ This category includes people with ischemic stroke or TIA in the last 20 years.
↵§§ This category includes people with a diagnosis in the last 2 years.
↵¶¶ Values of PM2.5 > 12 μg/m3 or NO2 > 53 ppb per year have been found to be associated with increased risk of other respiratory illnesses. (52)
↵*** All variables in this category are area-level variables at the level of the 2016 Canada Census dissemination area (DA).
↵††† First quintile represents 0–2.1 people/dwelling; second quintile, 2.2–2.4 people/dwelling; third quintile, 2.5–2.6 people/dwelling; fourth quintile, 2.7–3 people/dwelling; and fifth quintile, 3.1–5.7 people/dwelling.
↵‡‡‡ First category, 0%–7.3% of buildings in the area are apartment buildings; second category, 7.4%–37.7% are apartment buildings; and third category, 37.7%–100% are apartment buildings.
↵§§§ First quintile, 11.2%–33.7% of people are uncoupled; second quintile, 33.7%–38.4% of people; third quintile, 38.5%–43.6% of people; fourth quintile, 43.6%–51.0% of people; and fifth quintile, 51.0%–94.6% of people.
↵¶¶¶ First quintile represents 0%–32.5% of working people in the area who self-identified as working in an essential job; second quintile, 32.5%–42.3% of people; third quintile, 42.3%–49.8% of people; fourth quintile, 50.0%–57.5% of people; and fifth quintile, 57.5%–114.3% of people.
↵**** Income quintile has variable cut-off values in each city or Census area to take cost of living into account. A DA being in quintile 1 means it is among the lowest 20% of DAs in its city by income.
↵†††† First quintile represents 0%–4.1% of people aged 25–64 years without a diploma; second quintile, 4.1%–7.5% of people; third quintile, 7.5%–11.4% of people; fourth quintile, 11.4%–17.1% of people; and fifth quintile, 17.1%–94.3% of people.
↵‡‡‡‡ First quintile represents 0%–2.2% of people in the area who self-identified as a visible minority; second quintile, 2.2%–7.5% of people; third quintile: 7.5%–18.7% of people; fourth quintile, 18.7%–43.5% of people; and fifth quintile, 43.5%–100% of people.
↵§§§§ First category represents 0%–2.1% of people in a DA being recent immigrants; second category, 2.1%–4.7% of people; and third category, 4.7%–41.2% of people.
In this issue

Article tools


Jump to section
Related Articles
Cited By...
- Effects of school-level and area-level socio-economic factors on elementary school student COVID-19 infections: a population-based observational study
- Particulate matter air pollution and COVID-19 infection, severity, and mortality: A systematic review
- Association between long-term exposure to ambient air pollution and COVID-19 severity: a prospective cohort study
- Post-acute health care burden after SARS-CoV-2 infection: A retrospective cohort study of long COVID among 530,892 adults
- Area-level social and structural inequalities determine mortality related to COVID-19 diagnosis in Ontario, Canada: a population-based explanatory modeling study of 11.8 million people
- Geographic concentration of SARS-CoV-2 cases by social determinants of health in metropolitan areas in Canada: a cross-sectional study
- Effects of socio-economic factors on elementary school student COVID-19 infections in Ontario, Canada
- Risk stratification for COVID-19 hospitalization: a multivariable model based on gradient-boosting decision trees
- Effectiveness of mRNA and ChAdOx1 COVID-19 vaccines against symptomatic SARS-CoV-2 infection and severe outcomes with variants of concern in Ontario
- Intention to receive a COVID-19 vaccine by HIV status among a population-based sample of women and gender diverse individuals in British Columbia, Canada
- Effectiveness of BNT162b2 and mRNA-1273 covid-19 vaccines against symptomatic SARS-CoV-2 infection and severe covid-19 outcomes in Ontario, Canada: test negative design study
- Effectiveness of BNT162b2 and mRNA-1273 COVID-19 vaccines against symptomatic SARS-CoV-2 infection and severe COVID-19 outcomes in Ontario, Canada: a test-negative design study
More in this TOC Section
Similar Articles

