


Article Figures & Tables
Figures
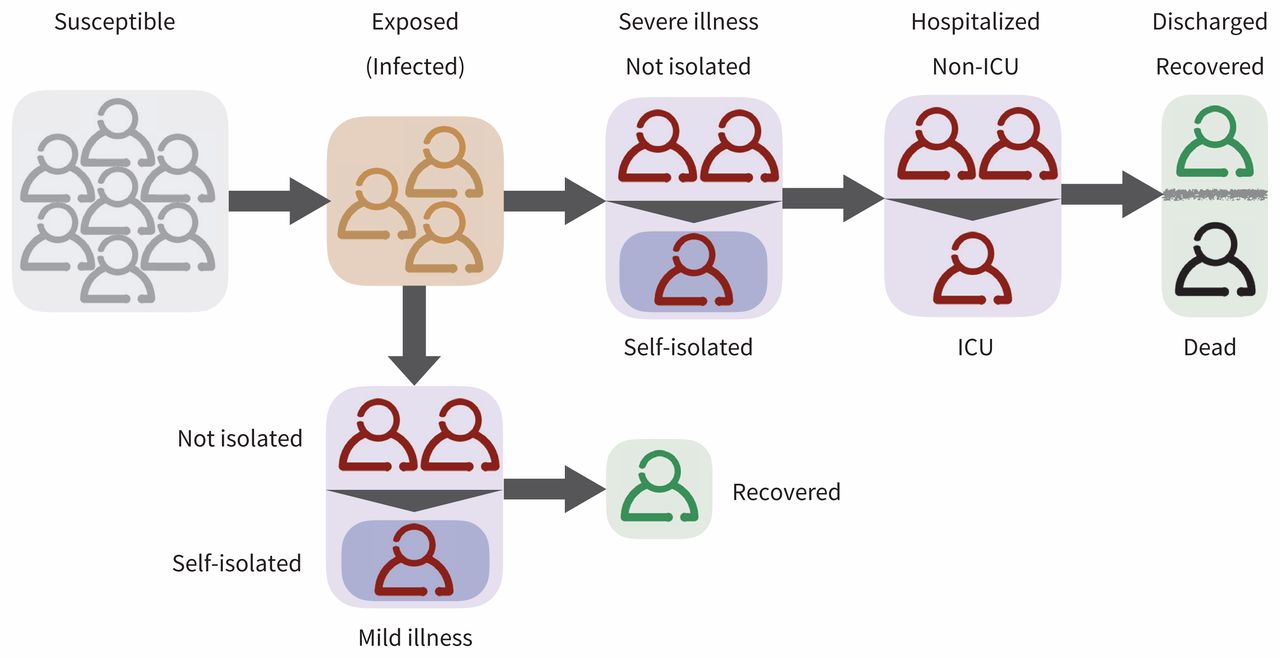
- Figure 1:
Schematic diagram of the model for natural history of the disease and implementation of self-isolation and hospital admission. Note: ICU = intensive care unit.
- Figure 2:
Distribution of the cumulative intensive care unit (ICU) bed days per 10 000 population during the coronavirus disease 2019 (COVID-19) outbreaks in different provinces. Box plots correspond to the level of self-isolation (SI) among mild symptomatic cases: SI = 0% (orange), SI = 20% (blue) and SI = 40% (red). Circles on box plots indicate medians; bars indicate interquartile range (IQR); horizontal lines are extended range from minimum (25th percentile – 1.5 IQR) to maximum (75th percentile + 1.5 IQR). Vertical dashed lines correspond to the average ICU bed days in all provinces without self-isolation (orange line = 569), 20% self-isolation (blue line = 435) and 40% self-isolation (red line = 264). These distributions are based on 500 independent simulations in each scenario.
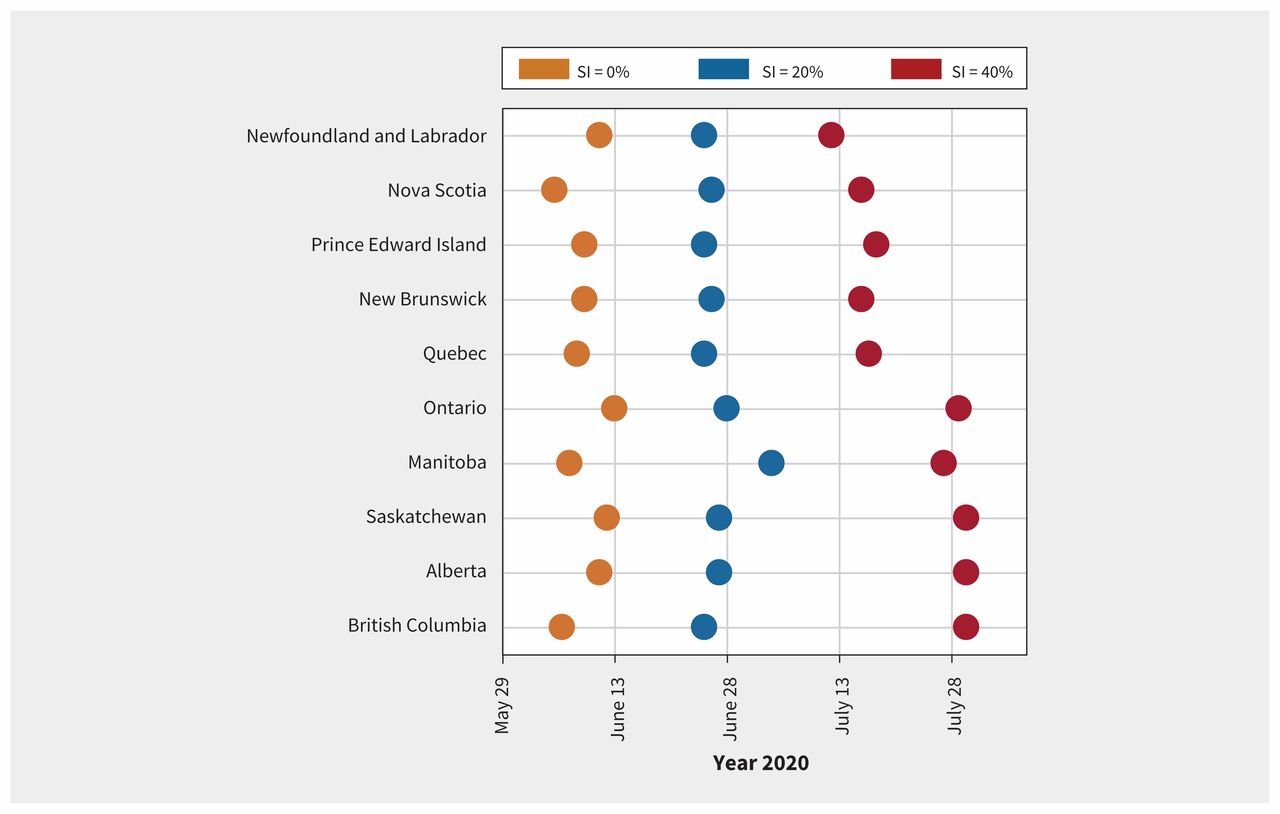
- Figure 3:
Projected week of the outbreak peak (based on the highest daily incidence of new infections) in different provinces. Coloured circles correspond to the level of self-isolation (SI) among mild symptomatic cases.

Tables
Description Age group References 0–19 yr 20–49 yr 50–64 yr ≥ 65 yr Transmission probability per contact, calibrated to R0 = 2, 2.5 R0 = 2 0.0356 0.0356 0.0356 0.0356 Li et al., (13) Wu et al. (14) R0 = 2.5 0.0455 0.0455 0.0455 0.0455 Relative infectivity of mild illness compared with severe and critical illness 0.5 0.5 0.5 0.5 Li et al. (17) Average duration of incubation period, d LogN (5.2, 0.1) LogN (5.2, 0.1) LogN (5.2, 0.1) LogN (5.2, 0.1) Li et al., (13) Lauer et al. (18) Proportion of cases who exhibit mild symptoms (based on reported cases in different age groups) 0.80 0.80 0.40 0.20 Moghadas et al., (7) WHO (19) Average infectious period, d 4.6 4.6 4.6 4.6 Estimated Probability of self-isolation after symptom onset for severe and critical cases 0.80 0.80 0.80 0.80 Assumed Probability of self-isolation after symptom onset for mild cases 0–0.8 0–0.8 0–0.80 0–0.80 Varied Time from symptom onset to self-isolation, d 1 1 1 1 Assumed Average time from symptom onset to hospital admission, d Unif (2, 5) Unif (2, 5) Unif (2, 5) Unif (2, 5) Moghadas et al., (7) Sanche et al. (20) Proportion of symptomatic patients with severe and critical illness requiring hospital care or ICU Unif (0.02, 0.03) Unif (0.28, 0.34) Unif (0.28, 0.34) Unif (0.60, 0.68) Estimated from WHO, (19) MIDAS (21) Proportion of cases admitted to hospital who require ICU Unif (0.01, 0.013) Unif (0.03, 0.05) Unif (0.05, 0.2) Unif (0.05, 0.15) Estimated from MIDAS (21) Length of hospital stay before recovery, d Gamma (4.5, 2.75) truncated between 8 and 17 Moghadas et al., (7) Sanche et al. (20) Length of ICU stay before recovery, d Gamma (4.5, 2.75) truncated between 10 and 19 Moghadas et al., (7) Sanche et al. (20) Note: Gamma(a, b) = gamma distribution with shape parameter a and scale parameter b, ICU = intensive care unit, LogN(a,b) = log normal distribution with shape parameter a and scale parameter b, Unif (a, b) = uniform distribution with mean a and standard deviation b.
- Table 2:
Projected peak capacity requirements for ICU and non-ICU hospital beds per 10 000 population, across a range of self-isolation scenarios by mildly symptomatic cases in different provinces*
Variables Hospital bed requirements at the peak ICU beds per 10 000 population Non-ICU beds ICU beds Self-isolation, % 0 20 40 0 20 40 Province British Columbia Mean: 80.2 Mean: 46.6 Mean: 18.6 Mean: 7.5 Mean: 4.2 Mean: 1.6 Existing: 0.63 Median: 83 (IQR 72–92) Median: 48 (IQR 38–55) Median: 19 (IQR 12–25) Median: 7 (IQR 6–10) Median: 4 (IQR 2–6) Median: 1 (IQR 0–3) Unoccupied: 0.13 Alberta Mean: 81 Mean: 46.9 Mean: 18.9 Mean: 7.5 Mean: 4.3 Mean: 1.6 Existing: 0.68 Median: 82 (IQR 73–93) Median: 48 (IQR 39–56) Median: 19 (IQR 14–25) Median: 7 (IQR 6–9.5) Median: 4 (IQR 3–6) Median: 1 (IQR 0–2) Unoccupied: 0.14 Saskatchewan Mean: 81.1 Mean: 47.0 Mean: 18.9 Mean: 7.6 Mean: 4.3 Mean: 1.8 Existing: 0.93 Median: 83 (IQR 72–92) Median: 48 (IQR 39–56) Median: 19 (IQR 13–25) Median: 7 (IQR 5–10) Median: 4 (IQR 3–6) Median: 1 (IQR 0.5–3) Unoccupied: 0.19 Manitoba Mean: 81 Mean: 46.9 Mean: 18.8 Mean: 7.6 Mean: 4.2 Mean: 1.8 Existing: 0.69 Median: 82 (IQR 73–95) Median: 48 (IQR 39–56) Median: 19 (IQR 13–25) Median: 7 (IQR 5–10) Median: 4 (IQR 2–6) Median: 1 (IQR 0–3) Unoccupied: 0.14 Ontario Mean: 80.7 Mean: 47.0 Mean: 18.9 Mean: 7.5 Mean: 4.2 Mean: 1.7 Existing: 0.79 Median: 83 (IQR 72–92) Median: 48 (IQR 39–65) Median: 19 (IQR 14–25) Median: 7 (IQR 5–9.5) Median: 4 (IQR 2–6) Median: 1 (IQR 1–3) Unoccupied: 0.16 Quebec Mean: 81.1 Mean: 47.0 Mean: 18.3 Mean: 7.5 Mean: 4.2 Mean: 1.7 Existing: 1.05 Median: 83 (IQR 72–92) Median: 48 (IQR 40–56) Median: 19 (IQR 11–26) Median: 7 (IQR 5–9) Median: 4 (IQR 2–6) Median: 1 (IQR 1–2) Unoccupied: 0.21 New Brunswick Mean: 80.2 Mean: 46.6 Mean: 18.7 Mean: 7.6 Mean: 4.2 Mean: 1.7 Existing: 1.36 Median: 82 (IQR 72–93) Median: 48 (IQR 39–55) Median: 19 (IQR 12–25) Median: 8 (IQR 5.5–9) Median: 4 (IQR 2–4) Median: 1 (IQR 1–3) Unoccupied: 0.27 Prince Edward Island Mean: 81.1 Mean: 47.0 Mean: 18.3 Mean: 7.5 Mean: 4.2 Mean: 1.6 Existing: 1.84 Median: 83 (IQR 72–92) Median: 48 (IQR 40–56) Median: 19 (IQR 11–26) Median: 7 (IQR 5–9) Median: 4 (IQR 2–6) Median: 1 (IQR 0–3) Unoccupied: 0.24 Nova Scotia Mean: 80.7 Mean: 47.0 Mean: 18.4 Mean: 7.5 Mean: 4.2 Mean: 1.7 Existing: 1.48 Median: 83 (IQR 72–92) Median: 48 (IQR 38–56) Median: 19 (IQR 11–25) Median: 7 (IQR 5–9) Median: 4 (IQR 2–6) Median: 1 (IQR 1–3) Unoccupied: 0.30 Newfoundland and Labrador Mean: 81 Mean: 46.7 Mean: 18.9 Mean: 7.6 Mean: 4.2 Mean: 1.7 Existing: 1.85 Median: 83 (IQR 73–93) Median: 47 (IQR 40–56) Median: 19 (IQR 12–25) Median: 7 (IQR 5–10) Median: 4 (IQR 3–6) Median: 2 (IQR 1–2) Unoccupied: 0.37 Note: COVID-19 = coronavirus disease 19, ICU = intensive care unit, IQR = interquartile range.
↵* Reported estimates are mean and IQR. We assumed an occupancy rate of 80% for existing ICU beds to calculate the number of ICU beds available for treatment of COVID-19 patients.
In this issue

Article tools


Jump to section
Related Articles
Cited By...
- No citing articles found.
More in this TOC Section
Similar Articles
Collections

