


Abstract
BACKGROUND: Previous studies have found that predicted fat mass and lean body mass may act differently on adverse events. However, the cardiovascular prognostic value of lean body mass and fat mass in patients with type 2 diabetes mellitus (T2DM) has not yet been investigated. We sought to investigate the relation between predicted lean body mass or fat mass and the risk of cardiovascular disease in patients with T2DM.
METHODS: We conducted a post hoc analysis of data from the Action to Control Cardiovascular Risk in Diabetes (ACCORD) study to investigate the relation between the predicted lean body mass or fat mass and major adverse cardiovascular events in patients with T2DM. We used sex-specific quartiles of predicted lean body mass index (BMI; kg/m2) and fat mass index (kg/m2). We defined a major adverse cardiovascular event as a composite of nonfatal myocardial infarction, nonfatal stroke or death from cardiovascular causes.
RESULTS: After a mean follow-up period of 8.8 years, we found that a major cardiovascular event occurred in 1801 of 10 251 patients (17.8%). Predicted lean BMI was not associated with major cardiovascular events (p = 0.34). Compared with patients in the first quartile (incidence rate 16.4%; 17.2%, 17.5% and 19.8% for the second, third and four quartiles, respectively) of predicted fat mass index, those in the fourth quartile had a hazard ratio of 1.53 (95% confidence interval 1.23–1.91).
INTERPRETATION: In patients with T2DM, we found that predicted fat mass had a strong positive association with a higher risk of a major adverse cardiovascular event. Increasing lean body mass did not have a protective role. Trial registration: ClinicalTrials.gov., no. NCT00000620
Cardiovascular disease (CVD) is the leading cause of mortality in the United States and worldwide.1,2 Among several modifiable risk factors for CVD, obesity is recognized as a major risk factor. Body mass index (BMI) is a good measure of obesity; many epidemiologic studies have found that obesity, evaluated by BMI, is associated with increased risk of CVD.3,4 However, recent studies have found that BMI is an imperfect measure of obesity and it does not discriminate between lean body mass and fat mass.5,6 Lean body mass (mainly skeletal muscles) has a protective role, whereas fat mass is detrimental.7,8 People with the same BMI may have different body compositions. Furthermore, patients with type 2 diabetes mellitus (T2DM) tend to be overweight and obese compared with those who do not have the disease.9 Type 2 diabetes mellitus has been shown to be associated with lower lean body mass.10 The factors (e.g., dietary habit, exercise and age) that may affect lean body mass and fat mass are completely different in these 2 populations. Therefore, lean body mass and fat mass may play different roles in these groups. Conclusions reached in previous studies may not be applicable in patients who have T2DM with CVD or high-risk factors for CVD.6–8 Therefore, understanding the role of lean body mass and fat mass in patients with T2DM may yield new insights for clinical practice.
Direct measurement of lean body mass and fat mass is impractical in large cohort studies because it requires dual-energy radiographic examination and experienced surveyors. Lee and colleagues11 developed validated anthropometric prediction equations for lean body mass and fat mass using large population samples from the National Health and Nutrition Examination Survey (NHANES), which is a cross-sectional survey of the health and nutritional status of adults and children who are not institutionalized in the United States, conducted by the National Center for Health Statistics and Centers for Disease Control and Prevention.11 The prediction equations allow investigation of lean body mass and fat mass without dual-energy radiographic examination or experienced surveyors. We conducted a post hoc analysis using data from the Action to Control Cardiovascular Risk in Diabetes (ACCORD) study, which involved patients with T2DM with CVD or high-risk factors for CVD, to investigate the relation between predicted lean body mass or fat mass and the risk of CVD in patients with T2DM.
Methods
Study participants and data collection
We performed a post hoc analysis of data from the ACCORD study (data obtained from the Biologic Specimen and Data Repository Information Coordinating Center, National Heart, Lung and Blood Institute, U.S. Department of Health & Human Services), a randomized controlled trial that enrolled 10 251 patients with high-risk factors for CVD or with CVD, to evaluate whether intensive control of blood glucose, blood pressure or lipids could reduce the incidence of CVD. The design and main results of the ACCORD study have been published previously. 9,12–14 Included patients had a mean age of 62 years, had a mean 10-year history of T2DM and had a mean glycated hemoglobin A1c level of 8.3%.12 However, intensified glycemic control did not reduce death or nonfatal cardiovascular events but did increase cardiac death (intensified control of blood glucose was stopped after a mean follow-up of 3.7 years because it increased the risk of cardiac death). Follow-up continued for the remaining participants in the ACCORD trial, with a total follow-up period of 8.8 years.
Exposure variables and study outcome
We calculated lean body mass and fat mass using prediction equations developed by the NHANES survey, which included 7531 men and 6534 women who underwent dual-energy radiographic examination.11 We used multivariable linear regressions to predict lean body mass and fat mass measured by dual-energy radiography as dependent variables in relation to the following anthropometric measures as predictor variables: age, sex, ethnicity, height (cm), weight (kg), BMI (kg/m2) and waist circumference (cm). The prediction equations showed high predictive ability for lean body mass (R2 = 0.90, standard error of estimate [SEE] = 2.6 kg for men; R2 = 0.85, SEE = 2.38 kg for women) and fat mass (R2 = 0.90, SEE = 2.6 kg for men; R2 = 0.93, SEE = 2.60 kg for women). Furthermore, these prediction equations performed well in different subgroups (according to age, BMI or disease) without an obvious bias. The equations for predicted lean body mass and fat mass in male and female participants are presented in Supplementary Table 1, Appendix 1, available at www.cmaj.ca/lookup/suppl/doi:10.1503/cmaj.190124/-/DC1. As lean body mass and fat mass are correlated with height and may differ greatly in different body habitus, we used lean BMI or fat mass index instead of lean body mass or fat mass in our statistical analysis. We calculated lean BMI and fat mass index using lean body mass and fat mass, respectively, in kilograms divided by the square of height in metres. Our outcome was assessed as major adverse cardiovascular events, defined as a composite of nonfatal myocardial infarction (MI), nonfatal stroke or death from cardiovascular causes.14,15
Statistical analysis
The baseline characteristics of patients are presented as frequencies and percentages for categorical variables, and as means and standard deviations (SDs) or interquartile ranges (IQRs) for continuous variables, depending on whether the data distribution was normal (assessed using normal Q–Q plots). We compared categorical variables using χ2 analysis and continuous variables using analysis of variance or the Mann–Whitney U test, according to distribution type. We evaluated the relations between predicted lean body mass or fat mass and major adverse cardiovascular events using the predicted lean BMI or fat mass index as both continuous and categorical variables. We treated predicted lean BMI and fat mass index as sex-specific quartiles because our evaluation showed that the relations with major adverse cardiovascular events were not completely linear.
To account for predicted lean BMI or fat mass index as categorical variables, we constructed a Cox proportional hazards regression model in which lean BMI or fat mass index was entered to calculate the hazard ratio (HR) among quartiles. We used the first quartile as the reference. We chose covariates to estimate the baseline severity of the diabetes, related complications and comorbidities because of their expected influence on prediction of lean body mass and fat mass on our outcome.
We used 4 models in total, including model 1, unadjusted; model 2, adjusted for age, sex and ethnicity; and model 3, adjusted model 2 for height, treatment (intensive blood control or standard blood control), hypertension, hyperlipidemia, previous heart failure, smoking, previous CVD and fasting blood glucose. We performed tests for linear trend by entering the median value of each category of predicted lean BMI or fat mass index as a continuous variable in models 1–3.16 To evaluate the independent association of predicted lean BMI or fat mass index with major adverse cardiovascular events, we used an additional model (model 4) with lean BMI or fat mass index added to model 3 for mutual adjustment. We also accounted for lean BMI and fat mass index as continuous variables; therefore, we constructed a Cox proportional hazards regression model adjusting for model 4, in which predicted lean BMI or fat mass index was entered to calculate the HR for major adverse cardiovascular events per 1 SD increase in predicted lean BMI or fat mass index.
We used restricted cubic spline analysis to visualize the relation between predicted lean BMI or fat mass index and major adverse cardiovascular events in participants with T2DM.
We used a cubic spline smoothing technique to examine the relation between predicted lean BMI or fat mass index and the logarithm of the relative risk of major adverse cardiovascular events adjusted for model 4. We also used a 2-piecewise linear regression model to examine the threshold effect of the predicted lean BMI or fat mass index on major adverse cardiovascular events by using a smoothing function. We determined the threshold value using a trial method by moving the trial turning point along a predefined interval and selecting the value that gave the maximum model likelihood. We then conducted a log-likelihood ratio analysis comparing the 1-line linear regression model with the 2-piecewise linear model. We conducted the interaction and stratified analyses by age (< 60 and ≥ 60 yr), sex, ethnicity, treatment, current smoking status, history of CVD, hypertension and hyperlipidemia. We also performed several sensitivity analyses by excluding any major adverse cardiovascular event that occurred in the first 2 years of follow-up and by using right-censoring criteria for participants aged more than 75 years. We also used different categories for predicted lean BMI and fat mass index (third or fifth quartiles).
All statistical analyses were 2-sided, and we considered a p value of less than 0.05 to be statistically significant. All analyses were performed using Empower(R) (www.empowerstats.com) and R (www.R-project.org).
Ethics approval
We conducted a post hoc analysis of the ACCORD trial. No ethics approval or consent to participate were required.
Results
Of the 10 251 participants who were included in the ACCORD trial, 105 were excluded because predicted lean body mass or predicted fat mass was not available. Mean age was 62.8 (SD 6.65) years, and 61.5% of the participants were men. Men had higher lean BMIs and lower fat mass indexes than women: in men, mean lean BMI was 21.0 (SD 2.60) kg/m2 and mean fat mass index was 9.97 (SD 2.68) kg/m2; in women, 17.5 ± 2.05 kg/m2 and 15.2 ± 3.69 kg/m2, respectively. During the follow-up period, major adverse cardiovascular events occurred in 1801 participants (17.8%) (i.e., cardiac death in 661 participants [6.5%], nonfatal MI in 928 participants [9.1%] and nonfatal stroke in 479 participants [4.7%]). Women were more likely to develop depression, and to have higher cholesterol and high-density lipoprotein levels. Men tended to smoke and to have more previous cardiovascular events. Baseline characteristics of the included participants with T2DM are presented in Table 1.
Baseline characteristics of included participants with type 2 diabetes mellitus
When we used predicted lean BMI as a continuous covariate in the fully adjusted Cox proportional hazards model (model 4), each 1 SD increase in the predicted lean BMI did not increase the risk of major adverse cardiovascular events (HR 1.00, 95% confidence interval [CI] 0.95–1.06). When predicted fat mass index was used as a continuous covariate in model 4, each 1 SD increase in the predicted lean BMI increased the risk of a major adverse cardiovascular event (HR 1.16, 95% CI 1.03–1.31).
Table 2 shows the association between the predicted lean BMI and major adverse cardiovascular events. We found no independent relation between lean BMI and major adverse cardiovascular events (HR 0.92, 95% CI 0.72–1.17; model 4).
Hazard ratios for major adverse cardiovascular events, by predicted lean body mass index quartiles
Table 3 shows the association between predicted fat mass index and major adverse cardiovascular events. We found that predicted fat mass index was positively associated with major adverse cardiovascular events. The risk of a major adverse cardiovascular event increased with each higher quartile of the predicted fat mass index. Compared with participants in the first quartile, those in the fourth quartile had an HR of 1.53 (95% CI 1.23–1.91; model 4).
Hazard ratios for major adverse cardiovascular events, by predicted fat mass index quartiles
In the restricted cubic spline analysis, the event rate decreased sharply with increasing lean BMI, which suggested that an extremely low lean BMI (< 16.7 kg/m2) might be associated with major adverse cardiovascular events. With increasing lean BMI, the curve began to flatten (Supplementary Figure 1A, Appendix 2, available at www.cmaj.ca/lookup/suppl/doi:10.1503/cmaj.190124/-/DC1). We found a strong positive association between fat mass index and major adverse cardiovascular events. With increasing fat mass index, the risk of major adverse cardiovascular events increased greatly (Supplementary Figure 1B, Appendix 2). However, the curve flattened when fat mass index was greater than 19.5 kg/m2.
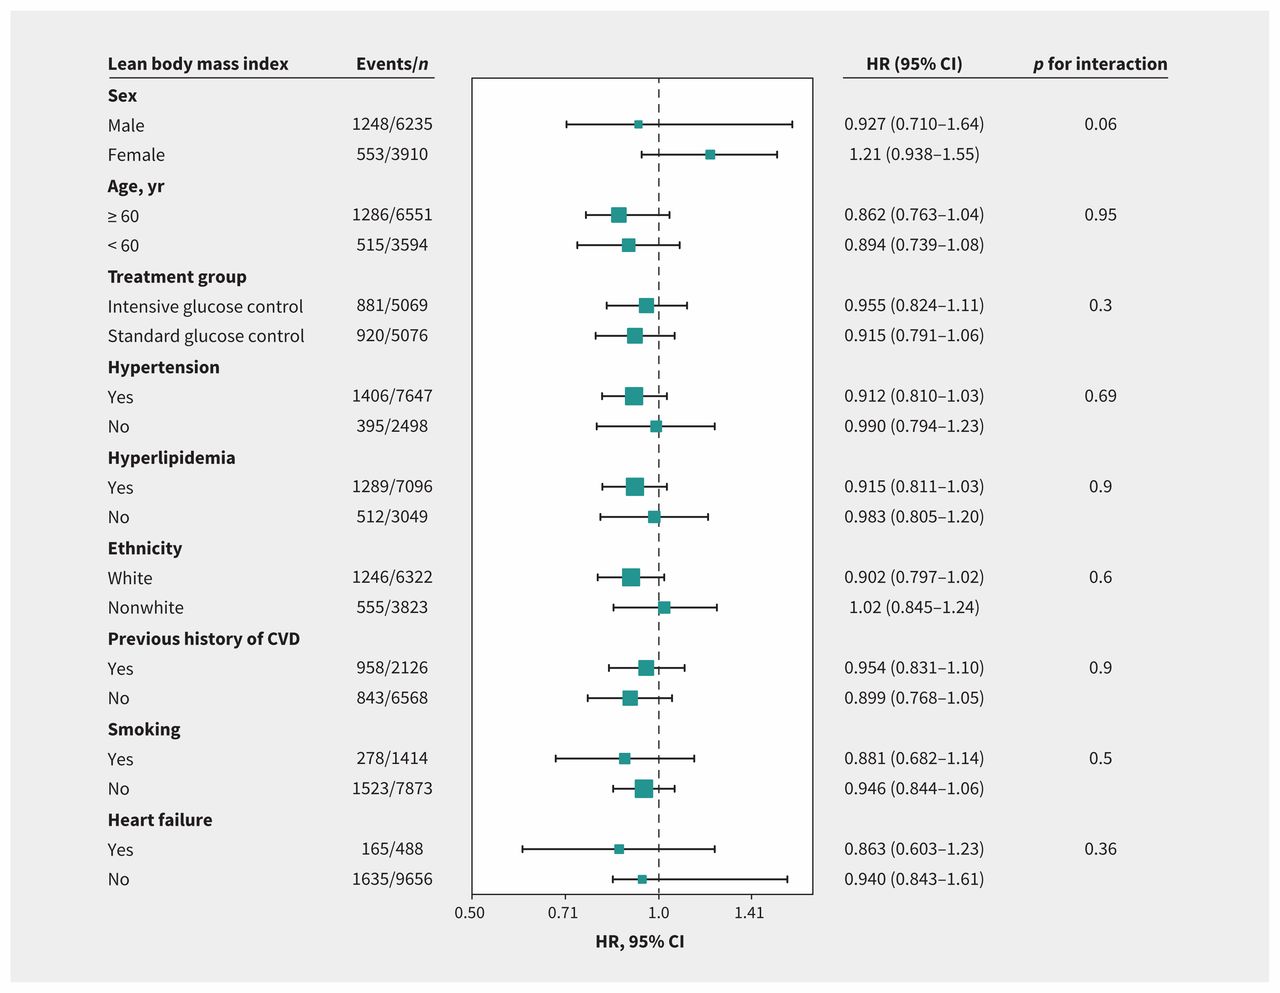
Figures 1 and 2 provide the results of our interaction and stratified analyses. No factor played an interactive role in the association between lean BMI or fat mass index and major adverse cardiovascular events. We found no significant correlation between lean BMI and major adverse cardiovascular events. However, we found that fat mass index was an independent risk factor for major adverse cardiovascular events across most subgroups.

Hazard ratios per 1 standard deviation–increase in predicted lean body mass index for major adverse cardiovascular events. Each stratification was adjusted for all factors in model 4 (i.e., age, ethnicity, sex, treatment group, hypertension, hyperlipidemia, smoking, previous cardiovascular disease, previous heart failure, height and fasting blood glucose) except for the stratification factor itself. Note: CI = confidence interval, CVD = cardiovascular disease, HR = hazard ratio.

Hazard ratios per 1 standard deviation–increase in predicted fat mass index for major adverse cardiovascular events. Each stratification was adjusted for all factors in model 4 (i.e., age, ethnicity, sex, treatment group, hypertension, hyperlipidemia, smoking, previous cardiovascular disease, previous heart failure, height and fasting blood glucose) except for the stratification factor itself. Note: CI = confidence interval, CVD = cardiovascular disease, HR = hazard ratio.
Our results remained robust in sensitivity analyses with the exclusion of major adverse cardiovascular events in the first 2 years of follow-up or in patients older than 75 years, as well as using different categories for lean BMI and fat mass index (thirds or fifths) (Supplementary Tables 2–9, Appendices 3–10, available at www.cmaj.ca/lookup/suppl/doi:10.1503/cmaj.190124/-/DC1).
Interpretation
Our post hoc analysis of data from trial participants with T2DM with CVD or a high risk of CVD showed that those with T2DM and more fat mass had a higher risk of major adverse cardiovascular events than those with less fat mass. Although there was a trend showing that high lean body mass was associated with less major adverse cardiovascular events, we did not find statistical significance between groups.
Previous epidemiologic studies (including our previous studies) 17,18 have examined the relation between BMI and CVD in patients with T2DM, but confusion exists regarding the unexplained inverse or U-shaped relation that has been observed.17–21 The nadirs of these U-shaped curves were around a BMI of 26–32 kg/m2. If a study included few individuals with class 2 or 3 obesity (BMI ≥ 35 kg/m2), an inverse relation between BMI and CVD may have been observed. Fat mass may be a better indicator of obesity than BMI in patients with T2DM. Older adults tend to have more fat mass and less muscle mass (lean body mass), and BMI may remain relatively stable.8,22,23 Therefore, patients with T2DM with the same BMI may have different body compositions and, therefore, different risks of CVD. The inability of BMI to discriminate among obesity-related conditions may be the reason for the obesity paradox in patients with T2DM.
The inverse or U-shaped relation between BMI and CVD may be explained using lean body mass and fat mass. We found that the protective effect of lean body mass was observed in participants with a lean BMI of less than 16.7 kg/m2. The increased risk of CVD in T2DM patients with lower BMI may be attributed to the adverse effect of lower lean body mass that overrides the positive effect of lower fat mass. If the protective effects of lean body mass overrode the detrimental effects of fat mass, an inverse relation between BMI and CVD would be observed. Simply measuring the BMI for a specific patient will not enable a prediction as to what sort of body mass reduction will be effective for that patient.
Lean body mass and fat mass appear to have distinct effects in patients with T2DM across differing BMIs. Increased risk of CVD in patients with T2DM and obesity may be attributed to more fat mass, whereas the protective effect of lean body mass no longer increases when lean BMI is more than 16.7 kg/m2. Thus, patients with T2DM should have sufficient lean body mass and less fat mass to reduce the risk of CVD.
A limited number of studies have examined the relation between lean body mass and CVD, with inconsistent conclusions. 6,7 Lee and colleagues did not find an independent relation between lean body mass and CVD in their analysis using data from NHANES, which included 38 006 healthy men during a mean 21.4 years of follow-up.6
Medina-Inojosa and colleagues used air displacement plethysmography to assess the relation between fat percentage or lean body mass and CVD in patients with coronary artery disease. 7 They found that increased body fat had deleterious effects and that lean body mass had protective effects. In our study, we found no independent relation between lean body mass and CVD. However, we did find that lower lean body mass (< 16.7 kg/m2) was associated with a higher risk of CVD. Compared with their study, our included participants tended to be more obese. Fat mass and CVD may be linked to each other by obesity-related conditions, such as hypertension or hyperlipidemia. Patients with more fat mass are more likely to develop hypertension or hyperlipidemia, which increases the risk of CVD.11 This link may be partially explained by our subgroup analyses. We found no relation between fat mass and CVD in patients without hyperlipidemia or hypertension. Furthermore, a study published in 2017 that used NHANES data to develop and validate practical anthropometric prediction equations for lean body mass, fat mass and percent fat in adults found that predicted fat mass showed significantly stronger associations with obesity-related biomarkers (triglycerides, total cholesterol, and high- and low-density lipoprotein [HDL and LDL, respectively] cholesterol) than BMI.11 Elevated levels of triglycerides and LDL cholesterol and reduced levels of HDL increased the risk of CVD.11
Limitations
Our study has some limitations. First, the predicted lean body mass and fat mass were not ideal measurements of actual lean body mass and fat mass. However, the prediction equations including age, sex, height, weight and waist circumference showed high predictive ability for lean body mass. Second, weight and waist circumference were measured on inception without being reevaluated during the follow-up period. Nevertheless, the change in weight was small,24 and changes in waist circumference were not significantly associated with adverse events.25 Third, all included patients were from the US and Canada, and these results may not be applicable to other populations that exhibit different body habitus.
Conclusion
In patients with a mean 10-year history of T2DM, higher predicted fat mass is associated with a higher risk of major adverse cardiovascular events.
Footnotes
Competing interests: None declared.
This article has been peer reviewed.
Contributors: Xinqun Hu and Shenghua Zhou designed the study and provided methodologic expertise. Zhenhua Xing, Liang Tang and Junyu Pei drafted the manuscript. Jian Chen, Pengfei Chen and Zhenfei Fang drafted the tables and figures. All of the authors revised the manuscript critically for important intellectual content, gave final approval for the version to be published and agreed to be accountable for all aspects of the work.
Data sharing: Data are available from the Biologic Specimen and Data Repository Information Coordinating Center (BioLINCC), National Heart, Lung and Blood Institute, U.S. Department of Health & Human Services.
- Accepted July 9, 2019.
References
In this issue

Article tools


Jump to section
Related Articles
Cited By...
- Association of predicted fat mass, predicted lean mass and predicted percent fat with diabetes mellitus in Chinese population: a 15-year prospective cohort
- Association between body mass index and short-term mortality in patients with intra-abdominal infections: a retrospective, single-centre cohort study using the Medical Information Mart for Intensive Care database
More in this TOC Section
Similar Articles
Collections

