


Abstract
BACKGROUND: C-reactive protein (CRP) is increasingly being included in the diagnostic work-up for community-acquired pneumonia in primary care. Its added diagnostic value beyond signs and symptoms, however, remains unclear. We conducted a meta-analysis of individual patient data to quantify the added value of CRP measurement.
METHODS: We included studies of the diagnostic accuracy of CRP in adult outpatients with suspected lower respiratory tract infection. We contacted authors of eligible studies for inclusion of data and for additional data as needed. The value of adding CRP measurement to a basic signs-and-symptoms prediction model was assessed. Outcome measures were improvement in discrimination between patients with and without pneumonia in primary care and improvement in risk classification, both within the individual studies and across studies.
RESULTS: Authors of 8 eligible studies (n = 5308) provided their data sets. In all of the data sets, discrimination between patients with and without pneumonia improved after CRP measurement was added to the prediction model (extended model), with a mean improvement in the area under the curve of 0.075 (range 0.02–0.18). In a hypothetical cohort of 1000 patients, the proportion of patients without pneumonia correctly classified at low risk increased from 28% to 36% in the extended model, and the proportion with pneumonia correctly classified at high risk increased from 63% to 70%. The number of patients with pneumonia classified at low risk did not change (n = 4). Overall, the proportion of patients assigned to the intermediate-risk category decreased from 56% to 51%.
INTERPRETATION: Adding CRP measurement to the diagnostic work-up for suspected pneumonia in primary care improved the discrimination and risk classification of patients. However, it still left a substantial group of patients classified at intermediate risk, in which clinical decision-making remains challenging.
C-reactive protein (CRP) is an acute phase protein synthesized by hepatocytes. Serum concentrations rise above 5 mg/L about 6 hours after a stimulus, with a peak after 48 hours.1 Measurement of CRP in blood is increasingly applied in the diagnostic work-up for community-acquired pneumonia in primary care.2 A point-of-care CRP test enables primary care physicians to obtain patients’ serum levels within minutes and is more readily available than chest radiography.3 However, the added diagnostic value of CRP measurement beyond signs and symptoms is unclear.
Three previous systematic reviews reported on the diagnostic value of CRP measurement for pneumonia.4–6 Two of them evaluated CRP as a single test and not its added value to clinical assessment. 5,6 Single-test assessment does not reflect daily practice, because primary care physicians decide on using additional tests only after assessment of signs and symptoms. The authors of the 2 systematic reviews considered the CRP test to be not sufficiently sensitive and specific to discriminate between patients with and without pneumonia in primary care.5,6 The third systematic review, 4 based on 4 diagnostic studies, concluded that CRP measurement added value in diagnosing pneumonia.4 More recently, 3 large diagnostic studies in primary care were published that were not included in the previous systematic reviews.7–9 One of the studies evaluated the use of procalcitonin in addition to C-reactive protein and found no additional diagnostic value for pneumonia in primary care.9
The previous systematic reviews were based on published data only and evaluated different combinations of signs and symptoms to determine the added value of CRP measurement. This hampered valid comparison between studies and increased heterogeneity in results.
We performed a meta-analysis of individual patient data to quantify the added value of CRP measurement in the diagnostic work-up for community-acquired pneumonia in primary care. With this study design, we were able to use the same diagnostic prediction model and measures of test accuracy across different data sets, taking into account heterogeneity between studies, to provide more valid, informative and generalizable results.
Methods
Literature search
We conducted a systematic search to identify eligible studies in MEDLINE, Embase and the Cochrane Library using indexing terms and plain text words for the index test (CRP) and the target disease (pneumonia) (search strategy presented in Appendix 1, available at www.cmaj.ca/lookup/suppl/doi:10.1503/cmaj.151163/-/DC1). A filter was used to identify diagnostic studies.10,11 All studies on diagnostic accuracy of CRP for pneumonia (e.g., infiltrate on chest radiography as the reference standard) were eligible. Study participants had to be adults (≥ 18 yr) suspected by their physician of having a lower respiratory tract infection presenting in a primary health care setting (i.e., nonreferred patients consulting their physician for the first time, or patients presenting through self-referral in ambulatory care or an emergency department). “Suspected lower respiratory tract infection” had to be defined as clinical criteria suggesting lower respiratory tract infection. We accepted small differences in definitions of lower respiratory tract infection between studies.
The selection of studies and data extraction were conducted by 2 reviewers (M.C.M. and A.S.) working independently. Authors of all eligible studies were contacted and asked to provide their data sets.
Quality assessment
Two reviewers (A.S. and J.G.) independently assessed the methodologic quality of the included studies using the QUADAS-2 (Quality Assessment of Diagnostic Accuracy Studies-2) tool.12 This tool assesses risk of bias (interval validity) and applicability (external validity) in 4 domains: patient selection, index test, reference-standard test, and flow and timing. Disagreements were resolved through discussion or, when necessary, consultation with a third reviewer (T.V.). If information regarding study quality was unclear or undisclosed, study authors were contacted. The original data were checked on single variables, and simple tables and plots were made to assess the reproducibility of the reported accuracy measures in the original publication.
Outcome measures
Outcome measures of the added value of CRP measurement were improvement in discrimination between patients with and without pneumonia in primary care and improvement in risk classification of patients, both within the individual studies and across studies.
We used a 2-step approach to determine improvement in discrimination. First, we fitted basic multivariate prediction models in each data set. Discrimination by these basic models between patients with and without pneumonia was expressed in the area under the receiver operating characteristic curve (AUC), with 95% confidence intervals (CIs). We calculated the change in AUC between the basic model and the extended model for each data set together with its precision estimate using the method of DeLong and colleagues.13 The second step included a forest plot to visualize the improvement in AUC within each data set. Acknowledging heterogeneity between studies, we used a random-effects model to obtain a pooled estimate across all studies. The generic inverse variance method was used to calculate the pooled estimate and 95% CI.14,15
To determine improvement in diagnostic risk classification, we calculated the predicted probability of pneumonia in all patients in each data set for the basic model and the extended model. Three diagnostic risk groups were defined: low risk (predicted probability < 2.5%), intermediate risk (predicted probability 2.5%–20%) and high risk of pneumonia (predicted probability > 20%), as applied in the most recent study on diagnosing pneumonia.9 Using the 2 predicted risk thresholds (2.5% and 20%), we constructed a 2 × 3 table for the basic model, and similarly for the extended model after adding CRP to each data set, and calculated corresponding sensitivities and specificities. We used a fixed-effects bivariate regression model to simultaneously obtain pooled estimates of sensitivity and specificity.14–16 To illustrate the general change in risk classification when using CRP, these pooled sensitivities and specificities and the median prevalence of pneumonia across the included studies (13%) were used to calculate the classification of patients in the 3 risk groups for both models in a hypothetical data set of 1000 patients.16
Data synthesis
Basic and extended prediction models
To quantify the added value of CRP measurement to signs and symptoms for diagnosing pneumonia in primary care, we first developed a basic diagnostic prediction model to mimic daily clinical practice using a prespecified set of commonly used and clinically relevant signs and symptoms. These clinical predictors were selected from guidelines on lower respiratory tract infections, 17,18 literature9,19–23 and consultation of experts. The predictors were age, dyspnea, tachypnea, not previously existing chest signs (physician-reported wheezing, rhonchi, crackles, diminished vesicular breathing, pleural rub or dullness), cough, (increased) sputum production, chest pain, ear-nose-throat symptoms (sore throat or rhinorrhea), (current) smoking, fever (reported by patient or physician) and comorbidity (defined as heart failure, diabetes mellitus, chronic obstructive pulmonary disorder, asthma, immunodeficiency, malignant disease or renal failure).
The availability of these 11 predictors was evaluated in the data sets of the eligible studies. Predictors that were missing for at least 30% of study participants (“sporadic”) or missing completely (“systematic”) were left out of the analysis in that particular data set. Patients who had missing data on the outcome (pneumonia) were also excluded. We imputed all other missing values using information on all variables in Appendix 2 (available at www.cmaj.ca/lookup/suppl/doi:10.1503/cmaj.151163/-/DC1), under the assumption that they were missing at random.24
In the extended prediction model, we included the 11 prespecified predictors from the basic model and added CRP. Visual inspection showed that inclusion of continuous CRP showed no clear deviation from a linear association in a graph.25 Therefore, CRP was added as a continuous variable into the model.
The basic and extended models are shown in Appendix 3 (available at www.cmaj.ca/lookup/suppl/doi:10.1503/cmaj.151163/-/DC1).
Meta-analysis of individual patient data
We used a 2-step approach26,27 for the meta-analysis of the outcome measures of the added value of CRP measurement: improvement in discrimination and risk classification of patients. These 2 outcome measures and their precision (standard error) were first calculated within each of the included studies and then examined in a meta-analysis. This 2-step approach was chosen because (a) it acknowledges the hierarchical nature of the data (i.e., patients and procedures are more alike and consistent within a study than across studies); (b) it is transparent because the methods within each step are comparable to the ones used in an individual study to calculate added value (first step) or comparable to standard methods for meta-analysis (second step); and (c) results from individual studies (after the first step) can be examined for similarities and inconsistencies.
We conducted sensitivity analyses to evaluate the effect of different risk thresholds on improvement in diagnostic risk classification. We changed the predicted probability of pneumonia for the 3 diagnostic risk groups to less than 10% for low risk, 10%–50% for intermediate risk and greater than 50% for high risk.
In addition, we recalculated the diagnostic risk classification in the hypothetical data set of 1000 patients using 2 different prevalence rates of pneumonia (5% and 20%), because the prevalence of pneumonia may vary across different communities.
We analyzed data using SPSS version 20.0.0 for Windows (SPSS Inc.), Microsoft Office Excel version 2014 and R version 3.1.1 (including the lme4, msm and rmeta packages).
Results
Literature search and study characteristics
We identified 4391 studies, of which 18 were deemed eligible and the authors were contacted for data (Figure 1). We excluded 10 of these studies because the domain or the design of the study did not comply with our study question (6 studies), the authors were not able to provide data (3 studies) or the contacted author did not respond (1 study). Characteristics of the 10 excluded studies are summarized in Appendix 4, available at www.cmaj.ca/lookup/suppl/doi:10.1503/cmaj.151163/-/DC1.) The authors of the remaining 8 studies7–9,21,22,28–30 provided their individual patient data, which were included in our individual patient data meta-analysis.

Selection of individual patient data used for external validation of the diagnostic prediction models.
The median prevalence of pneumonia across the included studies was 13%. The mean age of the patients overall was 49 (standard deviation 18) years. Patient characteristics are shown in Table 1.
Characteristics of patients in included studies
Quality assessment
Details of the assessment of the studies’ methodologic quality are shown in Appendix 5 (available at www.cmaj.ca/lookup/suppl/doi:10.1503/cmaj.151163/-/DC1). We identified potential risk of bias or applicability concerns in patient selection in 5 studies.7,9,21,28,29 In the studies by Melbye and colleagues21 and Flanders and colleagues,28 acquisition of chest radiography (the preferred reference-standard test) was left up to the physician’s discretion. In the study by Melbye and colleagues,21 chest radiography was ordered only in a subgroup of patients. The study by Rainer and colleagues7 reported chest radiography results, but these were missing in the provided data set; therefore, we used the discharge diagnosis (which was primarily based on chest radiography results) as provided in the data set.
Performance of basic model
The prespecified basic model could not be fitted completely in all available data sets. In 3 data sets, 1 predictor was systematically missing, and in 1 data set, 3 predictors were systematically missing (Appendix 2). For these data sets, models without the systematically missing predictors were fitted. The highest percentage of sporadically missing values per predictor was 23%. In one original data set, such missing values had already been imputed in the original analysis using hot-stack imputation. 28 The AUCs for the basic model varied from 0.68 to 0.92 (Table 2).
Area under the receiver operating characteristic curve (AUC) for the basic and extended diagnostic prediction models, by data set
Performance of extended model
Improvement in discrimination
The increase in AUC when CRP was added to the basic model ranged from 0.02 to 0.18 and was statistically significant in 6 of the 8 data sets (Table 2 and Figure 2). The pooled estimate of the improvement in AUC was 0.075 (95% CI 0.044–0.107) (Figure 3).
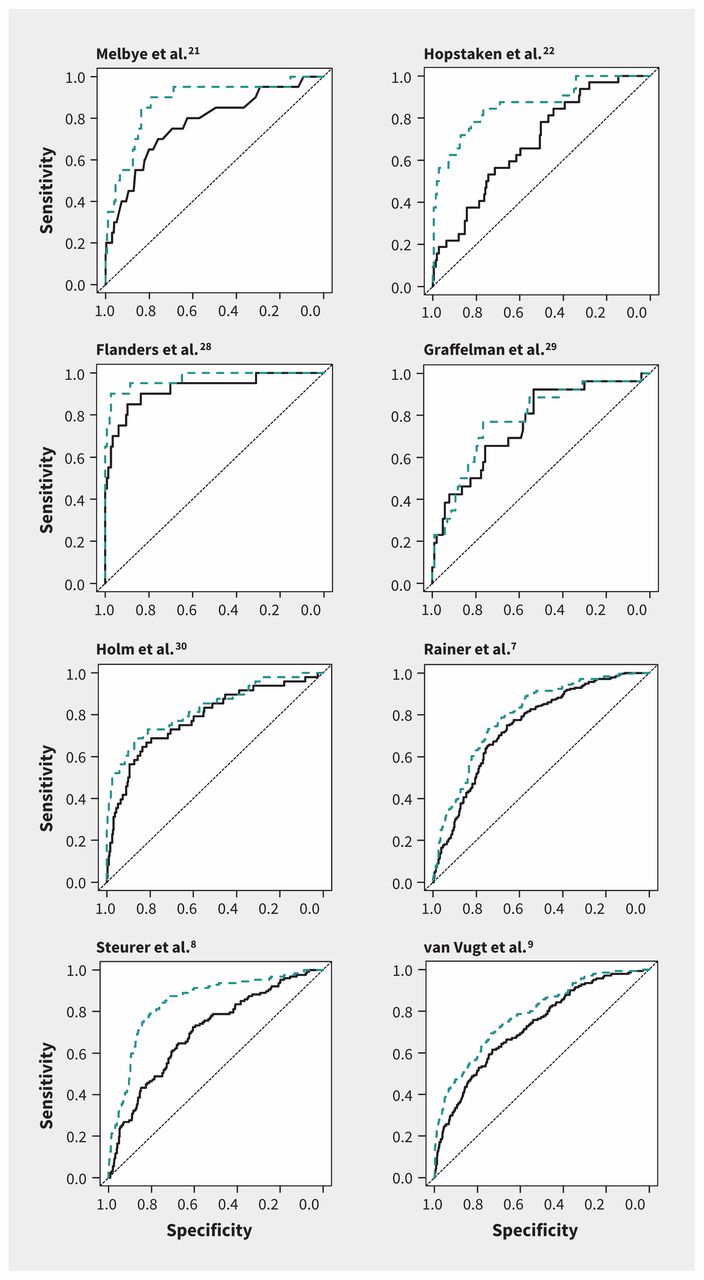
Sensitivity and specificity analysis (receiver operating characteristic curves) for the performance of the basic (black solid line) and extended (blue dashed line) prediction models in diagnosing pneumonia in primary care, by individual data set. Extended model = basic model plus C-reactive protein measurement. See Table 2 for the areas under the curve (AUC) and changes in AUC between the basic and extended models.
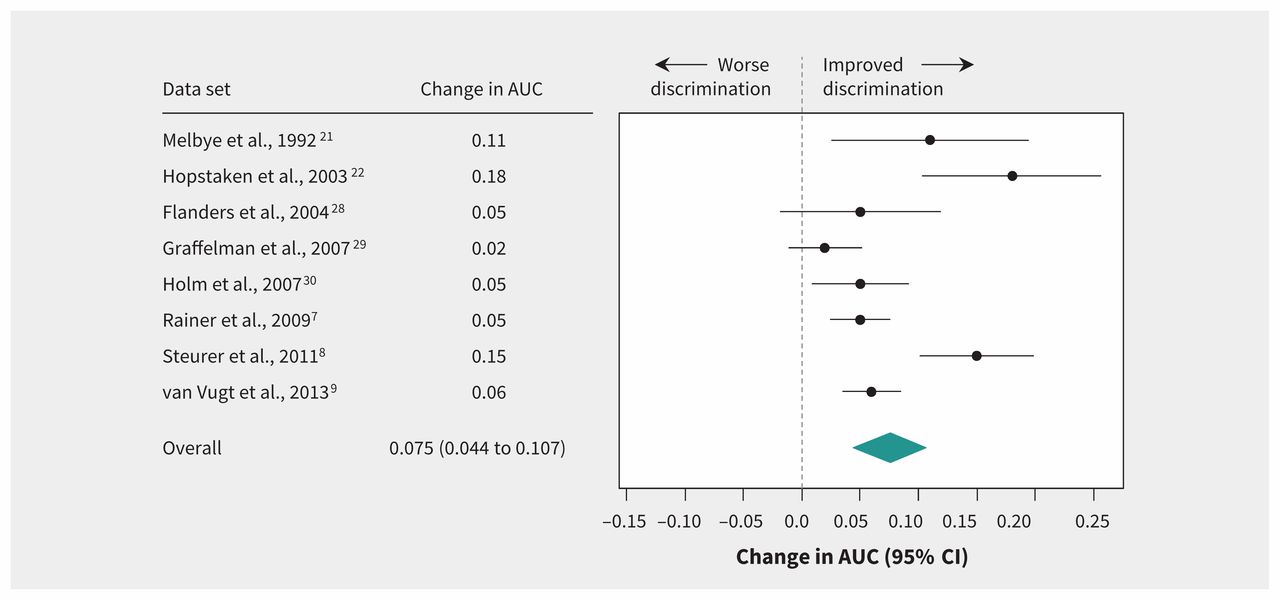
Effect of extended diagnostic prediction model (includes C-reactive protein measurement) in discriminating between patients with and without pneumonia in primary care, as shown by change in area under the curve (AUC). Values greater than zero indicate improvement in discrimination. CI = confidence interval.
Improvement in risk classification
At the low risk threshold of 2.5%, the pooled sensitivity was 0.97 (95% CI 0.95–0.98) for the basic and the extended model. The pooled specificities at this low risk threshold were 0.28 (95% CI 0.27–0.29) and 0.36 (95% CI 0.34–0.37) for the basic and extended models, respectively. At the high risk threshold of 20%, the pooled sensitivities were 0.63 (95% CI 0.59–0.66) for the basic model and 0.70 (95% CI 0.66–0.73) for the extended model. The pooled specificities were 0.87 (95% CI 0.86–0.88) and 0.90 (95% CI 0.89–0.91), respectively.
Table 3 shows the diagnostic risk classification in a cohort of 1000 hypothetical patients on the basis of the pooled sensitivities and specificities at the low and high risk thresholds. Overall, the proportion of patients without pneumonia correctly classified at low risk increased from 28% to 36% by adding CRP in the extended model. The proportion with pneumonia correctly classified at high risk increased from 82 (63%) to 91 (70%).
Performance of the basic and extended (with CRP measurement) prediction models in the diagnostic risk classification of pneumonia in a hypothetical cohort of 1000 patients*
The basic model classified 248 (25%) of the patients in the low-risk group. Adding CRP in the extended model increased the low-risk group to 317 (32%). The number of patients with missed pneumonia who would be classified at low risk was 4 in both models; however, the proportion of false-negative results decreased with the addition of CRP, from 4 (2%) of 248 in the basic model to 4 (1%) of 317 in the extended model. The basic model classified 557 (56%) of the 1000 patients at intermediate risk. Adding CRP decreased the number to 505 (51%). The basic model classified 195 (20%) at high risk, and the extended model decreased this number to 178 (18%). The proportion of patients in the high-risk group correctly classified as having pneumonia increased from 82 (42%) of 195 with the basic model to 91 (51%) of 178 with the extended model. The proportion of patients incorrectly classified as having pneumonia in the high-risk group (false positive) decreased from 113 (58%) of 195 with the basic model to 87 (49%) of 178 after CRP was added.
In the sensitivity analyses, these numbers changed in absolute values when we used different thresholds to define low, intermediate and high risk of pneumonia (data not shown).
When classification was based on a pneumonia prevalence of 5% instead of 13%, the addition of CRP still improved diagnostic accuracy: the number of false-negative classifications remained similar after adding CRP measurement, the true-negative and true-positive numbers increased, and the false-positive number and number of patients in the intermediate-risk group decreased (Appendix 6, available at www.cmaj.ca/lookup/suppl/doi:10.1503/cmaj.151163/-/DC1). Results were comparable when we used a pneumonia prevalence of 20% (Appendix 7, available at www.cmaj.ca/lookup/suppl/doi:10.1503/cmaj.151163/-/DC1).
Interpretation
In our meta-analysis of individual patient data for 5308 adults with suspected lower respiratory tract infection, the addition of CRP measurement beyond signs and symptoms improved discrimination between patients with and those without pneumonia. The pooled analysis further showed that adding CRP also improved diagnostic risk classification by increasing the number of patients classified at low risk without increasing the number of false-negative results within this category. Adding CRP reduced the number of patients classified at high risk and increased the number of true-positive results within this category. It also decreased the proportion of false-positive results from 58% to 49%. Although CRP increased diagnostic accuracy, its addition to the diagnostic prediction model still left a considerable proportion of patients (51%) classified at intermediate risk.
In their systematic review of CRP as a single test, van der Meer and colleagues6 reported sensitivities ranging from 10% to 98% and specificities from 44% to 99%. The calculated sensitivity and specificity were based on dichotomized CRP results (< 20 mg/L [negative] v. ≥ 20 mg/L [positive]). In our meta-analysis, we added CRP as a continuous variable to a basic signs-and-symptoms diagnostic prediction model. Therefore, the pooled sensitivity and specificity in our meta-analysis cannot be compared with those of van der Meer and colleagues.6
In a subgroup analysis of 3 homogeneous studies, van der Meer and colleagues6 found a summarized AUC of 0.84 (95% CI 0.78–0.97).6 We also included these studies in our meta-analysis,21,22,28 along with 5 other studies, to calculate the AUC; however, we did not use the different diagnostic models from the original studies, but rather a similar model across all studies. The AUCs in our study ranged from 0.68 to 0.92 for the basic model, and from 0.78 to 0.97 after the addition of CRP measurement, which is comparable to results of van der Meer and colleagues.6
We found a slightly different median prevalence of pneumonia (13%, range 5%–42%) than that reported in a review by Falk and colleagues5 (14.6%, range 5%–89%). They concluded that in primary care settings where the prevalence of pneumonia is between 5% and 10%, additional diagnostic testing with CRP is unlikely to alter the probability of pneumonia sufficiently to change management. However, we found an improvement in diagnostic risk classification after adding CRP in a hypothetical cohort of 1000 patients.
In their systematic review, Engel and colleagues4 concluded that the additional value of point-of-care CRP measurement in the management of respiratory tract infections in primary care is limited. Their review included 2 studies in which the diagnostic value of CRP was combined with either a prediction rule22 or the physicians’ presumptive diagnosis of pneumonia.30 In the study by Hopstaken and colleagues,22 the AUC increased after CRP was added to the prediction rule. In the study by Holm and colleagues,30 the positive predictive value increased (from 0.24 to 0.32) and the negative predictive value decreased (from 0.94 to 0.91) after adding CRP to the physicians’ presumptive diagnosis. Both studies were included in our analysis, and together with 6 other studies provided more precise estimates of the added value of CRP measurement.
The AUC of the basic prediction model varied considerably (from 0.68 to 0.92) between the included studies in our analysis. This heterogeneity can be explained by variances in study populations in the different countries, with slightly different primary care settings, and by variation in reporting signs and symptoms and applying and interpreting chest radiography (verification problems). The prevalence of pneumonia varied from 5% to 43% between the studies, which underscores why the data from the different studies cannot be analyzed as a single data set. We therefore used a 2-step approach to investigate the true added value of CRP. In 2 of the 8 data sets, the increase in AUC was not statistically significant.28,29 A possible explanation is the high AUC of the basic model (> 0.75), which limits improvement.
The classification tables showed that adding CRP measurement to the basic prediction model reduced the number of patients classified at high risk without missing those with pneumonia, and it even increased the number of patients correctly classified with pneumonia in that risk category. These numbers changed in absolute values when we used different thresholds to define low, intermediate and high risk of pneumonia, but the improvement in predicting pneumonia with the addition of CRP remained at the different thresholds.
Strengths and limitations
A strength of our study was the use of individual patient data to investigate the added value of CRP measurement for diagnosing pneumonia in primary care. The selected study patients are representative of those in primary care settings.
For diagnostic risk classification, we used predicted risk thresholds of 2.5% and 20%, assuming that pneumonia is absent when diagnostic risk is low and pneumonia is present and has to be treated when diagnostic risk is high. This assumption may be debated. We argue this is how physicians could use diagnostic risk classification of pneumonia in daily practice: a low predicted probability to rule pneumonia out, a high predicted probability to confirm it and an intermediate-risk group in which diagnostic doubt remains.
Another limitation of our analyses is that CRP was included for all patients, whereas it is not necessarily measured in daily practice, and the strategy for CRP measurement varies by region and country. Moreover, chest radiography is commonly considered as a suboptimal, imperfect gold standard because it does not provide 100% diagnostic certainty on pneumonia, particularly when used without a second chest radiograph at a later time. Nevertheless, chest radiography is frequently and most practically used in diagnostic studies as the reference test. In all of the included studies, chest radiography was used to diagnose pneumonia; therefore, there was no heterogeneity in the way the outcome was confirmed in the different studies.
Finally, we were not able to include all eligible individual patient data in our analysis because some data were unavailable (Appendix 4).
Conclusion
Adding CRP measurement to the diagnostic work-up for suspected pneumonia in primary care improved diagnostic discrimination and risk classification of patients. However, even though CRP measurement increased diagnostic accuracy, a substantial group of patients were classified at intermediate risk, in which clinical decision-making remains challenging.
Footnotes
Competing interests: Rogier Hopstaken received a grant from Alere for a study on the value of point-of-care CRP measurement in children and speaker fees from Alere for lectures on antibiotic resistance. Niek de Wit received grants from Saltro Diagnostic Center for Primary Care (a local primary care laboratory) and ZonMw (Dutch government funding agency for health research and development) paid to his institution; he is a member of the board of trustees for the Gelderse Vallei Hospital and an advisory board member for the Dutch Institute for Quality in Health Care. Theo Verheij received grants from Saltro, Pfizer, ZonMW and the European Commission; honoraria as a member of the board for IZER (a large cooperation of general practitioners in Rotterdam) and an advisor to the Health Council of the Netherlands; and a grant from Axis-Shield (for test equipment in a trial). No other competing interests were declared.
This article has been peer reviewed.
Contributors: Margaretha Minnaard, Joris de Groot, Alwin Schierenberg, Niek de Wit, Johannes Reitsma, Berna Broekhuizen, Alma van de Pol and Theo Verheij contributed to the study concept and design. Margaretha Minnaard, Joris de Groot, Rogier Hopstaken, Alwin Schierenberg, Saskia van Vugt, Arie Knuistingh Neven, Aleida Graffelman, Hasse Melbye, Timothy Rainer, Johann Steurer, Annette Holm, Ralph Gonzales, Geert-Jan Dinant and Theo Verheij contributed to the data collection. Margaretha Minnaard, Joris de Groot, Johannes Reitsma, Niek de Wit, Berna Broekhuizen, Alma van de Pol and Theo Verheij contributed to the data analysis. All of the authors contributed to the writing of the manuscript, approved the final version to be published and agreed to act as guarantors of the work.
- Received September 19, 2016.
- Accepted May 12, 2016.
References
In this issue

Article tools


Jump to section
Related Articles
Cited By...
- Prognostic factors and prediction models for hospitalisation and all-cause mortality in adults presenting to primary care with a lower respiratory tract infection: a systematic review
- Incorporation of biomarkers into a prediction model for paediatric radiographic pneumonia
- Cost-effectiveness and return-on-investment of C-reactive protein point-of-care testing in comparison with usual care to reduce antibiotic prescribing for lower respiratory tract infections in nursing homes: a cluster randomised trial
- Point-of-care testing, antibiotic prescribing, and prescribing confidence for respiratory tract infections in primary care: a prospective audit in 18 European countries
- Effect of C reactive protein point-of-care testing on antibiotic prescribing for lower respiratory tract infections in nursing home residents: cluster randomised controlled trial
- What is pneumonia?
- Antibiotic Prescribing for Acute Respiratory Tract Infections 12 Months After Communication and CRP Training: A Randomized Trial
- Use of C-reactive protein to tailor antibiotic use: a systematic review and meta-analysis
- C-reactive protein: guiding antibiotic prescribing decisions at the point of care
More in this TOC Section
Similar Articles
Collections

