


Abstract
Background: A recently halted clinical trial showed that intensive treatment of type 2 diabetes mellitus was associated with increased mortality. Given the phenotypic heterogeneity of diabetes, therapy targeted at insulin status may maximize benefits and minimize harm.
Methods: In this longitudinal cohort study, we followed 503 patients with type 2 diabetes who were free of cardiovascular disease from 1996 until data on mortality and cardiovascular outcomes were censored in 2005. Phenotype-targeted therapy was defined as use of insulin therapy in patients with a fasting plasma C peptide level of 0.2 nmol/L or less and no insulin therapy in patients with higher C peptide levels.
Results: The mean age of the cohort was 54.4 (standard deviation 13.1) years, and 56% were women. The mean duration of diabetes was 4.6 years (range 0–35.9 years). Of the 503 patients, 110 (21.9%) had a low C peptide level and 111 (22.1%) were given insulin. Based on their C peptide status, 338 patients (67.2%) received phenotype-targeted therapy (non-insulin-treated, high C peptide level [n = 310] or insulin-treated, low C peptide level [n = 28]), and 165 patients (32.8%) received non-phenotype-targeted therapy (non-insulin-treated, low C peptide level [n = 82] or insulin-treated, high C peptide level [n = 83]). Compared with the insulin-treated, low-C-peptide referent group, the insulin-treated, high-C-peptide group was at a significantly higher risk of cardiovascular events (hazard ratio [HR] 2.85, p = 0.049) and death (HR 3.43, p = 0.043); the risk was not significantly higher in the other 2 groups. These differences were no longer significant after adjusting for age, sex and diabetes duration.
Interpretation: Patients with low C peptide levels who received insulin had the best clinical outcomes. Patients with normal to high C peptide levels who received insulin had the worst clinical outcomes. The results suggest that phenotype-targeted insulin therapy may be important in treating diabetes.
Type 2 diabetes mellitus is reaching epidemic proportions, with major implications on quality of life and societal productivity. 1,2 Chronic hyperglycemia is the cardinal feature of diabetes and is directly linked to its associated morbidity and mortality. 3,4 In both type 1 and type 2 diabetes, improved glycemic control reduces the risk of microvascular complications. Its effect on macrovascular complications is less certain, especially in type 2 diabetes. 5–7 The latter debate has recently been rekindled in light of the premature discontinuation of the Action to Control Cardiovascular Risk in Diabetes (ACCORD) trial, in which intensive therapy to lower the hemoglobin A1c concentration to less than 6% was associated with increased mortality. 8–10
Both β-cell dysfunction and insulin resistance are implicated in type 2 diabetes, although there is considerable phenotypic heterogeneity among individuals. 11,12 Antidiabetic treatment, including insulin, lowers blood glucose by different mechanisms. Thus, matching the primary metabolic defect to the main drug action may maximize efficacy and minimize side effects. In support of this notion, insulin treatment in type 2 diabetes was found to increase 24-hour ambulatory blood pressure, whereas in type 1 diabetes it was found to correct hyperglycemia and improve endothelial function. 13–15 With a better understanding of the molecular mechanisms of diabetes, patients with genetic defects encoding the β-cell pathways were found to be more responsive to sulphonylurea therapy than to metformin treatment. 16 These reports, albeit anecdotal, raise questions about the importance of phenotyping and targeted therapy to minimize risk and maximize efficacy.
Because C peptide is secreted from islet cells into the circulation in equimolar concentrations with insulin and is not extracted by the liver, many investigators have used C peptide levels as a biomarker of β-cell function. 17 In a cross-sectional study, 18 we reported a 1% difference in hemoglobin A1c concentration between patients with type 2 diabetes receiving treatment appropriate to their C peptide level (i.e., insulin given to patients with a low C peptide level, no insulin given to patients with a high level) and those managed otherwise.
Against this background, we hypothesized that clinical outcomes would be better among patients with type 2 diabetes who receive insulin because of insufficient β-cell reserves, as indicated by a low plasma C peptide level, and patients who do not receive insulin because of a normal or high C peptide level than among patients managed otherwise.
In this study, we examined the effect of interactions between C peptide levels and antidiabetic treatments on clinical outcomes after a 9-year follow-up of patients with type 2 diabetes for whom fasting C peptide levels were available at baseline. 17
Methods
Study population
This analysis was based on a longitudinal cohort of patients recruited from a regional diabetes clinic at the Prince of Wales Hospital of Hong Kong, the teaching hospital of the Chinese University of Hong Kong. At the time of our study, the Prince of Wales Hospital served a population of 1.2 million people whose socio-economic strata were representative of the overall population in Hong Kong. Throughout our study, Hong Kong had a highly subsidized health care system in which the public sector was the dominant provider of secondary and tertiary services.
From January to December 1996, a total of 562 patients were enrolled in a diabetes registry. Enrollees were either referred from community- and hospital-based clinics or had been discharged from the Prince of Wales Hospital or other regional hospitals. All patients enrolled had type 2 diabetes as defined by the 1985 criteria of the World Health Organization. We excluded patients who had type 1 diabetes, which we defined as acute presentation with diabetic ketoacidosis and heavy ketonuria. The baseline clinical characteristics of this cohort are described elsewhere. 18
On enrolment in the diabetes registry, all patients underwent a comprehensive assessment of complications and risk factors. This assessment was provided on an outpatient basis by the diabetes clinic as part of a quality improvement program and was modified from the European DiabCare protocol. 19 Patients who underwent the assessment were to be observed through regular follow-up by the diabetes clinic until death. All clinicians were provided with protocol for diabetes management. Prescribed medications were dispensed on site after each follow-up. Patients were followed up on average once every 4 months. Those who had been discharged from hospital (who comprised less than 10% of enrolled patients) were assessed at least 6 weeks after discharge.
We received ethics approval for this study from the Clinical Research Ethics Committee of the Chinese University of Hong Kong. This study also complied with the Declaration of Helsinki. Written informed consent was obtained from all patients for data analysis and reporting.
Treatment groups
In observational studies of drug treatments and mortality, the main source of potential errors is the way in which treatment effects are quantified. 20 As we have previously reported, 21,22 to adjust for variability in treatment effectiveness, it is necessary to consider the duration of the drug therapy, the cumulative effects of the drug adjusted for total follow-up time, and the decline in the effects of the drug after discontinuation. We adjusted for these factors using an algorithm in which we multiplied the total treatment period by 2 values. The first value represented the duration of treatment divided by the duration of follow-up. The second value was a function of 1 divided by 1 plus the number of months from discontinuation of treatment to the date of a clinical event or July 30, 2005. We based the second equation on the tendency for the effects of insulin therapy to tail off rapidly after treatment discontinuation. 21,22
After adjusting treatment-related data using this algorithm, we included in our analysis only patients who had received at least 6 months of insulin therapy. We used this threshold of time as a prerequisite for effective insulin treatment based on the facts that the hemoglobin A1c concentration reflects the degree of glycemic control during the previous 3 months and that cardiovascular disease and mortality take time to develop. Using a glucagon stimulation test described elsewhere, 18,23 we identified patients who required insulin therapy as those with a fasting C peptide level of 0.2 nmol/L or less. We divided patients into 4 groups and designated 2 of the groups as “phenotype-targeted” and 2 as “non-phenotype-targeted” (Figure 1). The phenotype-targeted groups consisted of patients who did not receive insulin therapy and had normal to high C peptide levels (non-insulin-treated, high-C-peptide group) and patients who received insulin therapy and had lower C peptide levels (insulin-treated, low-C-peptide group). The non-phenotype-targeted groups consisted of patients who did not receive insulin therapy and had lower C peptide levels (non-insulin-treated, low-C-peptide group) and patients who received insulin therapy and had normal to high C peptide levels (insulin-treated, high-C-peptide group).
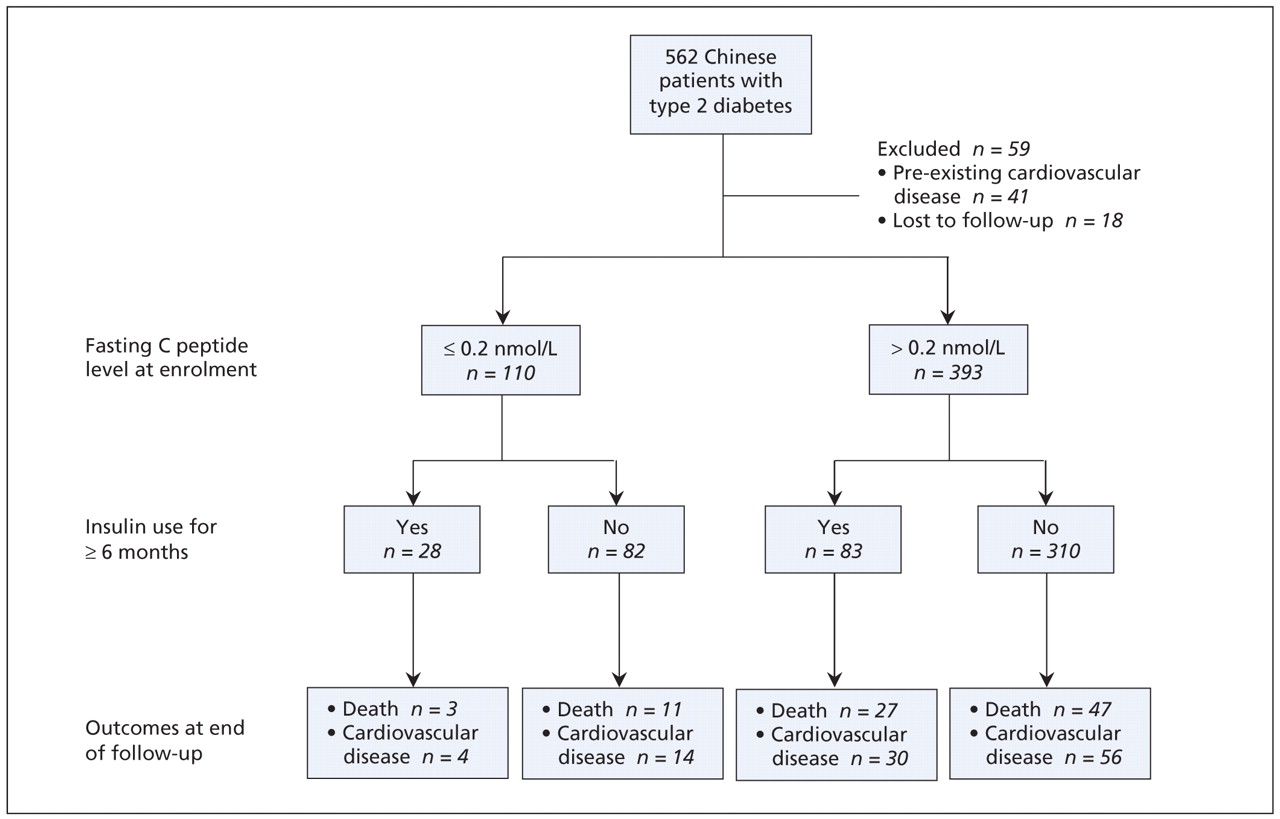
Figure 1: Clinical outcomes of 503 patients with type 2 diabetes mellitus stratified by baseline fasting C peptide levels and status of insulin use. Analysis of variance for comparison of the 4 groups:p < 0.001.
At follow-up visits we collected information on patients’ use of oral antidiabetic drugs (including sulphonylurea, metformin, α-glucosidase inhibitor and thiazolidinediones), angiotensin-converting-enzyme (ACE) inhibitors or angiotensin-receptor blockers, lipid-lowering drugs and acetylsalicylic acid (ASA). We included these data in our analyses as categorized covariates.
Clinical and laboratory measurements
Each patient underwent a baseline assessment for the registry at the diabetes clinic after at least 8 hours of fasting and abstention from antidiabetic medications. Clinic staff recorded patients’ demographic data, including histories of smoking and alcohol consumption. They calculated body mass index (BMI) from anthropometric measurements taken with patients wearing light clothing and no shoes. Waist circumference was determined to be the minimum circumference to the nearest 0.5 cm between the umbilicus and xiphoid process. Blood pressure was measured from the right arm using a standard mercury sphygmomanometer after at least 5 minutes with the patient seated. Diastolic blood pressure was recorded using Korotkoff phase V. We used the mean value of 2 readings taken 1 minute apart.
We measured levels of fasting plasma glucose, hemoglobin A1c concentration, serum creatinine, C peptide and lipids (total cholesterol, triglyceride and high-density lipoprotein [HDL] cholesterol). We calculated low-density lipoprotein (LDL) cholesterol using the Friedewald equation. 24 We defined a low C peptide level as 0.2 nmol/L or less. 17,25 We used a target hemoglobin A1c concentration of less than 7% and a target LDL cholesterol level of less than 2.6 mmol/L.
Albuminuria and chronic kidney disease are important prognostic indicators for diabetes, especially among Chinese patients. 25–27 In this cohort, we collected a random spot urine sample to measure the ratio of albumin to creatinine. We used the Modification of Diet in Renal Disease equation recalibrated for Chinese people 28 to estimate the glomerular filtration rate (mL/min−1 per 1.73 m−2) as follows: 186 × (serum creatinine × 0.011)−1.154 × (age)−0.203 × (0.742 if female or 1 if male) × 1.233, where serum creatinine is expressed in micro-moles per litre (converted from original measurement in milligrams per decilitre), age is expressed in years and 1.233 is the adjustment coefficient for Chinese people. We defined chronic kidney disease as an estimated glomerular filtration rate of less than 60 mL/min−1 per 1.73 m−2.25 We defined nor-moalbuminuria as an albumin-to-creatinine ratio of less than 2.5 mg/mmol in men and less than 3.5 mg/mmol in women, microalbuminuria as an albumin-to-creatinine ratio of 2.5–25 mg/mmol in men and 3.5–25 mg/mmol in women, and macroalbuminuria as an albumin-to-creatinine ratio of 25 mg/mmol or greater. 27,29
Repeated laboratory measurements during the follow-up period were medically indicated for all patients and were performed at least once yearly during the annual assessment for complications. Laboratory results that were captured within 4 months before or after the date on which data were censored were available for 277 patients. Among the remaining patients, 88 had died and 138 did not have blood tests within this period. Compared with the 226 patients who did not have repeated measurements taken within 4 months of the censor date, patients with repeat blood tests had a higher mean blood pressure (139/84 v. 135/82 mm Hg, p = 0.030) and mean hemoglobin A1c concentration (8.6% v. 8.1%, p = 0.007) at baseline. Other parameters, including age, sex, duration of diabetes, smoking, alcohol consumption, BMI, waist circumference, lipid profile and C peptide level were similar between the 2 groups (data not shown).
Plasma glucose was measured by the hexokinase method using an automated analyzer (Hitachi 911, Boehringer Mannheim, Mannheim, Germany). Both the intra- and inter-assay coefficients of variation for glucose were 2% at 6.6 mmol/L. Hemoglobin A1c concentration was measured using an automated ion-exchange chromatography system (Bio-Rad Laboratory, Hercules, United States). The intra- and inter-assay coefficients of variation for hemoglobin A1c concentration were 3.1% or less at values at or below 8.5% and up to 5% at values above 8.5%. Plasma C peptide levels were measured by means of radioimmunoassay (Novo Nordisk, Copenhagen, Denmark) using an intra-assay coefficient of variation of 3.4% and an inter-assay coefficient of variation of 9.6%. The lowest detection limit was 0.1 nmol/L.
Further details of clinical assessments, definitions and laboratory assays of this cohort are described elsewhere. 18,30
Outcome measures
In defining the outcome measures of our study, we used data on clinical outcomes, including discharge diagnoses and deaths, that were recorded from the date of patient assessment to July 30, 2005, when data on outcomes were censored. All data were retrieved from the central computer system of the Hong Kong Hospital Authority. This system was created in 1990 and contains clinical data on all patients at public hospitals, day centres and outpatient clinics. The information recorded in this database on admissions to public hospitals accounts for 95% of hospital beds in Hong Kong. We matched data across the central computer system using each patient’s Hong Kong Identity Card number, a unique identifier that is compulsory for all residents of Hong Kong and is used by government departments and major organizations.
We retrieved data on hospital admissions, medication dispensing and last available laboratory results where available, including hemoglobin A1c and lipid parameters assayed within 4 months of onset of clinical events or censor date. We defined clinical outcomes using hospital discharge summaries as coded by the International Classification of Diseases, 9th revision (ICD-9). Coronary artery disease (ICD-9 codes 410–414) was defined as myocardial infarction, ischemic heart disease or angina. A cardiac event was defined as a diagnosis of heart failure (ICD-9 code 428) or coronary artery disease. Cardiovascular disease was defined as the first reported stroke (ICD-9 codes 430–438) or cardiac event. We calculated follow-up time as the period from enrolment to the date of first clinical event, the date of death or July 30, 2005, whichever came first.
Statistical analyses
Results are expressed as mean (standard deviation [SD]) for continuous variables, percentage values (for categorical variables or proportions) or median values (range or interquartile range) for age and duration of disease or follow-up, where appropriate. Levels of C peptide and triglyceride were logarithmically transformed for statistical tests because of skewed distributions. We used a t test and a χ2 test for between-group comparisons. We performed a Kaplan–Meier analysis with log-rank test to compare the cumulative incidence of clinical outcomes in different patient groups.
We performed Cox regression analysis (forward stepwise, retested with backward stepwise and forcing all covariates into the model) to examine the effect of interactions between insulin treatment status and C peptide levels on clinical outcomes in the 4 treatment groups. We present these data as hazard ratios (HRs) with 95% confidence intervals (CIs).
Major covariates affecting the analyses included baseline physical and biochemical variables, pre-existing complications and drugs used during follow-up. We included the following parameters in the study model to examine their independent effects on clinical outcomes: age, sex, duration of diabetes, use of tobacco and alcohol, baseline fasting C peptide level, BMI, waist circumference, blood pressure, hemoglobin A1c concentration, lipid profile, microvascular complications (i.e., retinopathy, peripheral neuropathy and albuminuria), urinary albumin-to-creatinine ratio, estimated glomerular filtration rate, phenotype-targeted treatment (yes or no), and use of insulin, oral antidiabetic drugs, ACE inhibitors or angiotensin-receptor blockers, lipid-lowering drugs and ASA. We included all drugs as dichotomous variables (1 = yes, 0 = no). Only the use of insulin, which is the core drug for the phenotype-targeted therapy, was adjusted for duration of use. We also performed a subgroup analysis involving patients with repeat measurements of hemoglobin A1c and lipid values, using the percentage change in these metabolic indexes between baseline and censor date as covariables. For multiple comparisons, we used a Bonferroni adjustment. A p value of less than 0.05 (2-tailed) was considered significant.
Sample size estimation
To estimate sample size, we considered an α error of 0.05 and a power of 80% for our hypothesis that phenotype-targeted therapy can effect a meaningful difference in the outcome of all-cause mortality and cardiovascular disease. In our previous cross-sectional analysis, we observed a 0.5%–1.0% difference in hemoglobin A1c concentration between patients who received phenotype-targeted therapy and those who did not. 18 Other studies have shown that this degree of difference in hemoglobin A1c concentration was associated with a 2.5-fold difference in risk for all-cause mortality and cardiovascular disease. 31 The annual mortality among Chinese patients with type 2 diabetes in Hong Kong is up to 3%. 32 With a mean follow-up of 8 years, we therefore estimated the proportion of patients with mortality outcomes in the 2 phenotype-targeted groups combined (p1) versus the 2 non-phenotype-targeted groups combined (p2) to be as follows: p1 = 0.03 × 8 = 0.24; p2 = 0.24/2.5 = 0.096. The standardized difference, calculated as (p1 – p2)/√(pm (1 – pm), where pm = (p1 + p2)/2 = 0.168, was 0.385. Using the Altman nomogram to calculate sample size, we determined that the minimum sample size required was 410, thus giving our present cohort sufficient power to test our hypothesis.
Results
Among the 562 patients with type 2 diabetes enrolled in the diabetes registry in 1996, 41 had a history of cardiovascular disease and were excluded from our analysis. Another 18 patients were lost to follow-up. Hence, we included in our analysis 503 patients (285 [56.7%] women). Their mean age was 54.4 (SD 13.1) years (median 56 years, range 18–83 years), and the mean duration of diabetes was 4.6 (SD 5.9) years (median 2 years, range 0–35 years). The mean length of follow-up was 8.3 (SD 2.1) years (median 9.0 years, interquartile range 8.7–9.2 years).
Based on their fasting C peptide levels, we determined that 110 patients (21.9%) needed insulin. At enrolment, 54 patients (10.7%) were given insulin. During the observation period, 179 (35.6%) received insulin therapy. After adjusting for the duration of insulin therapy and time of discontinuation since the end of the study, we determined that 111 patients (22.1%) received at least 6 months of insulin treatment. Of these 111 patients, 28 (5.6%) had insulin deficiency (Figure 1). Of the 393 patients (78.1%) who had normal to high C peptide levels, 310 (61.6%) did not use insulin. Taken together, these 338 patients (67.2%) were considered to have received phenotype-targeted therapy (Figure 1).
At baseline, compared with the 165 patients who received non-phenotype-targeted therapy, the 338 patients who received phenotype-targeted therapy had a shorter duration of diabetes (mean 3.8 [SD 5.1] v. 6.4 [SD 6.8] years, p < 0.001), a higher diastolic blood pressure (mean 84 [SD 11] v. 81 [SD 10] mm Hg, p = 0.005), a higher BMI (mean 24.9 [SD 4.0] v. 23.6 [SD 3.4], p < 0.001), a higher C peptide level (median 0.58 [interquartile range 0.35–0.87] v. 0.22 [interquartile range 0.10–0.68] nmol/L, p < 0.001) and a lower hemoglobin A1c concentration (mean 8% [SD 2.1%] v. 9.1% [SD 2.5%], p < 0.001). At the end of the follow-up period, patients in the phenotype-targeted treatment groups with repeat measurements had a higher HDL cholesterol level (mean 1.4 [SD 0.4] v. 1.3 [SD 0.4] mmol/L, p = 0.018), a lower hemoglobin A1c concentration (mean 7.2% [SD 1.6%] v. 7.6% [SD 1.7%], p = 0.031) and a higher percentage change in HDL cholesterol (14.8% v. 6.7%, p = 0.031) than patients in the non-phenotype-targeted groups (full data set not shown).
The characteristics of the 4 groups of patients stratified by baseline C peptide level and insulin treatment status are shown in Appendix 1 (available at www.cmaj.ca/cgi/content/full/180/9/919/DC2). At enrolment, patients in the insulin-treated, high-C-peptide group had the longest durations of diabetes, the worst risk profiles and the highest frequency of microvascular complications. Patients in this group were also less likely to be at target levels of hemoglobin A1c concentration and blood pressure, and they had lower HDL cholesterol and higher triglyceride levels than in the referent group of insulin-treated, low-C-peptide patients. Among the 111 patients who received insulin therapy for at least 6 months, the proportion who received it at enrolment was higher in the insulin-treated, low-C-peptide group than in the insulin-treated, high-C-peptide group. During follow-up, a higher proportion of patients in the insulin-treated, high-C-peptide group than in the insulin-treated, low-C-peptide group were prescribed additional oral antidiabetic therapy, ACE inhibitors or angiotensin-receptor blockers, and lipid-lowering drugs. At the end of the follow-up period, patients in the insulin-treated, high-C-peptide group had the lowest levels of HDL cholesterol and hemoglobin A1c concentration and the greatest percentage reduction in hemoglobin A1c concentration.
The overall incidence of new-onset cardiovascular disease was 20.7%. The overall all-cause mortality was 17.5%. The rates of death and cardiovascular disease were highest among patients in the insulin-treated, high-C-peptide group, lowest among patients in the insulin-treated, low-C-peptide group, and similar and intermediate in the other 2 groups (p = 0.001 for each outcome) (Figure 2). Compared with the insulin-treated, low-C-peptide referent group, the insulin-treated, high-C-peptide group had a significantly higher risk of clinical events (HR for cardiovascular disease 2.85, 95% CI 1.01–8.10, p = 0.049; HR for death 3.43, 95% CI 1.04–11.31, p = 0.043). The difference was no longer significant after we adjusted for age, sex and duration of diabetes. The risk of clinical events was not significantly higher in the non-insulin-treated, high-C-peptide group (HR for cardiovascular disease 1.29, 95% CI 0.47–3.55, p = 0.63; HR for death 1.48, 95% CI 0.46–4.74, p = 0.51) or in the non-insulin-treated, low-C- peptide group (HR for cardiovascular disease 1.18, 95% CI 0.39–3.59, p = 0.77; HR for death 1.28, 95% CI 0.36–4.59, p = 0.70).

Figure 2: Incidence of death (top panel) and new-onset cardiovascular disease (bottom panel) among 503 patients with type 2 diabetes, by baseline fasting C peptide level and insulin use. Note: I+ = insulin use, I− = no insulin use, CP+ = normal to high C peptide level, CP− = low C peptide level.
The independent predictors of clinical outcomes are summarized in Table 1. After we controlled for confounding variables, we found that only age, duration of diabetes and albuminuria were independent predictors of all-cause mortality. For cardiovascular disease, we found that age, male sex, estimated glomerular filtration rate and albuminuria were independent predictors.
Table 1: Independent factors associated with outcomes
Shown in Table 2 are the results of our subgroup analysis involving 277 patients who had repeat measurements of hemoglobin A1c concentration and lipid profile within 4 months before or after the date on which data were censored. After we controlled for confounding variables, we found that age, albumin-to-creatinine ratio, peripheral neuropathy and greater reduction in HDL cholesterol were independent predictors for all-cause mortality. For cardiovascular disease, we found that age, duration of diabetes, baseline triglyceride level, retinopathy, use of ASA during follow-up, low HDL cholesterol at the time data were censored and greater percentage change in hemoglobin A1c concentration were independent predictors.
Table 2: Subgroup analysis of independent factors associated with outcomes
Interpretation
In this exploratory analysis using a registry with detailed documentation of risk factors, treatments and clinical outcomes, 21,22,25,26,32 we observed that patients with a normal to high C peptide level at baseline who were given insulin had the worst clinical outcomes compared with patients in the other treatment groups. This difference is due mainly to the high-risk profile of the patients in that group, of long disease duration, albuminuria, age and male sex at baseline. Despite having the greatest reduction in hemoglobin A1c concentration during the follow-up period, patients in the insulin-treated, high-C-peptide group were more likely than those in the other groups to be prescribed oral antidiabetic therapy, lipid-lowering drugs, ASA, and ACE inhibitors or angiotensin-receptor blockers, which suggests that additional therapies were needed to control other risk factors. Notably, high triglyceride level at baseline, low HDL cholesterol at the end of follow-up and greater reduction in hemoglobin A1c concentration and HDL cholesterol during follow-up were also independent predictors for cardiovascular disease and all-cause mortality. Patients with diabetes requiring insulin therapy may have been more prone to complications owing to the presence of risk factors associated with the indications of insulin therapy.
In light of the early discontinuation of the ACCORD study because of increased mortality among patients with diabetes who were treated intensively to a low target hemoglobin A1c concentration, 8–10 our findings raise the question of whether treatment other than intensive insulin therapy would be better for such patients, especially those with a normal to high C peptide level. In a recent editorial, Home 10 highlighted the importance of controlling risk factors and avoiding intensive insulin regimens and oral therapy with multiple medications that may have undesirable effects in obese patients with type 2 diabetes, who often harbour multiple risk factors and silent coronary artery disease.
Type 2 diabetes is a heterogeneous disease with varying degrees of insulin resistance and deficiency. 11,12,33 We used the fasting C peptide level to assess insulin secretory capacity, and we asked whether phenotype-targeted therapy was associated with better clinical outcomes. We measured C peptide levels only at baseline. Repeated measurement of C peptide levels after another 8–10 years would be expected to result in much lower values, since pancreatic function deteriorates as the duration of diabetes increases. Hence, assessing pancreatic function for proper phenotype-targeted therapy needs to be done as early as possible. Faber and Binder 34 reported a strong correlation between fasting plasma C peptide levels and C peptide levels that were measured after glucagon (r = 0.86, p < 0.001) or after a meal (r = 0.66, p < 0.01) in postchallenge measurements taken to assess insulin secretory capacity. In Hong Kong, measurement of fasting C peptide levels is not a routine practice; therefore, results used in our subgroup analysis involving patients with repeat measurements were not available to the attending physician. Most internists followed clinical guidelines and prescribed insulin therapy to patients with ketotic presentation, long duration of diabetes, low BMI, or complications including renal or hepatic disease.
Although we did not confirm our hypothesis about the beneficial effects of phenotype-targeted therapy, our results support our clinical impression about the therapeutic challenge in managing overweight or obese patients with type 2 diabetes, who are often insulin resistant. By the time such patients required insulin to control glycemia, their clinical characteristics of long duration of diabetes and multiple complications put them at high risk of cardiovascular complications. The independently predictive role of peripheral neuropathy and increased reduction in hemoglobin A1c concentration for all-cause mortality and cardiovascular disease is noteworthy. It is tempting to speculate about the possibility of autonomic neuropathy (which may be precipitated by hypoglycemic unawareness) as an explanation for the excess mortality, due in large part to sudden death, in the intensive-insulin-therapy arm of the ACCORD study.
Whether the use of insulin contributed to the adverse clinical outcomes in patients with normal to high C peptide levels cannot be answered by our analysis and must be addressed in a randomized clinical trial. In type 2 diabetes, hyperinsulinemia owing to either exogenous insulin administration or endogenous insulin resistance can be associated with increased blood pressure, impaired fibrinolysis and hypercoagulability and electrocardiographic changes of the ST segment and the T wave. 35,36 In patients without diabetes, hyperinsulinemia may cause deterioration in renal function. 37 In a cohort study involving 811 patients without diabetes who had coronary artery disease, Bonora and colleagues 38 reported a U-shaped relation between coronary artery disease and fasting insulin levels, which suggested that both hyper- and hypoinsulinemia were independent indicators of coronary artery disease. Notably, low HDL cholesterol and high triglyceride levels were independent risk predictors in our study. These lipid phenotypes are typically associated with obesity and insulin resistance, which may worsen with insulin therapy, especially in obese patients with type 2 diabetes. This notion is further supported by the discrepancy we observed between lipid and glucose control in the insulin-treated, high-C-peptide group.
By contrast, in a 48-week randomized clinical trial involving patients with type 2 diabetes given insulin monotherapy, the addition of an endocannabinoid receptor antagonist conferred better metabolic and weight control than insulin therapy alone, with a reduction in triglyceride levels and an increase in HDL cholesterol. 39 Similarly, in a randomized study involving patients whose type 2 diabetes could not be controlled with oral antidiabetic therapy, 40 treatment with exenatide, despite conferring similar glycemic control, was associated with weight reduction, whereas treatment with glargine was associated with weight gain. Taken together, these results support the notion that different antidiabetic drugs, though having similar efficacy in lowering blood glucose levels, may have different effects on other closely associated risk factors in type 2 diabetes.
Limitations
Our study had several limitations. The clinical outcome of cardiovascular disease was not externally adjudicated. Our use of ICD-9 codes as outcome measures is in line with most studies. Because of the observational nature of the study, not all of the patients had their blood pressure or body weight measured systematically during follow-up visits. Thus, only objective data such as use of medications and laboratory tests were included in our analysis. However, because Hong Kong has a heavily subsidized health care system and medical insurance is not compulsory, the majority of patients with chronic diseases are managed in hospital clinics where medications are dispensed on site. This makes our analysis of drug usage in these patients reasonably reliable.
Conclusion
We found a high risk of cardiovascular disease among patients with insulin-treated type 2 diabetes who had normal to high C peptide levels, even though we observed a greater reduction in hemoglobin A1c concentration in these patients compared with those in other groups. This increased risk is due in part to the high-risk profile of these patients at baseline. Given the phenotypic heterogeneity of type 2 diabetes, randomized clinical trials are needed to confirm whether treatment that targets insulin status (i.e., insulin deficiency versus insulin resistance) improves clinical outcomes compared with treatment selected using other criteria.
See related commentary by Cheng and Leiter, page 907
Footnotes
-
This article has been peer reviewed.
Competing interests: None declared.
Contributors: Gary Ko had full access to all of the data in the study and takes responsibility for the accuracy of the data analysis. Wing-Bun Chan and Juliana Chan take responsibility for the integrity of the data. All of the authors contributed substantially to the conception and design of the study. Gary Ko, Wing-Bun Chan and Juliana Chan were responsible for the design of the study. Wing-Yee So, Peter Tong, Risa Ozaki, Ronald Ma, Alice Kong and Chun-Yip Yeung were responsible for the recruitment of participants. Wing-Yee So and Chun-Chung Chow provided technical support for the study and managed the data. Gary Ko and Xilin Yang analyzed and interpreted the data. Gary Ko and Juliana Chan drafted the manuscript. All of the authors revised the manuscript critically for important intellectual content and approved the final version for publication.
Acknowledgements: We are indebted to Professor Philip Home for his critical review of the paper.
Funding: This work was supported in part by a research grant from the Investigator-Initiated Studies Program of Merck.
REFERENCES
In this issue

Article tools


Jump to section
Related Articles
Cited By...
- Higher habitual FODMAP intake is associated with lower body mass index, lower insulin resistance and higher short-chain fatty acid-producing microbiota in people with prediabetes
- Assessment of Insulin Administration Methods: Perceptions by Patients and Significant Others Instrument Development
- How many hours should a surgical resident work?
- Combien dheures les medecins residents devraient-ils travailler?
- Cardiovascular risk and glycemic control
More in this TOC Section
Similar Articles

