


Article Figures & Tables
Figures
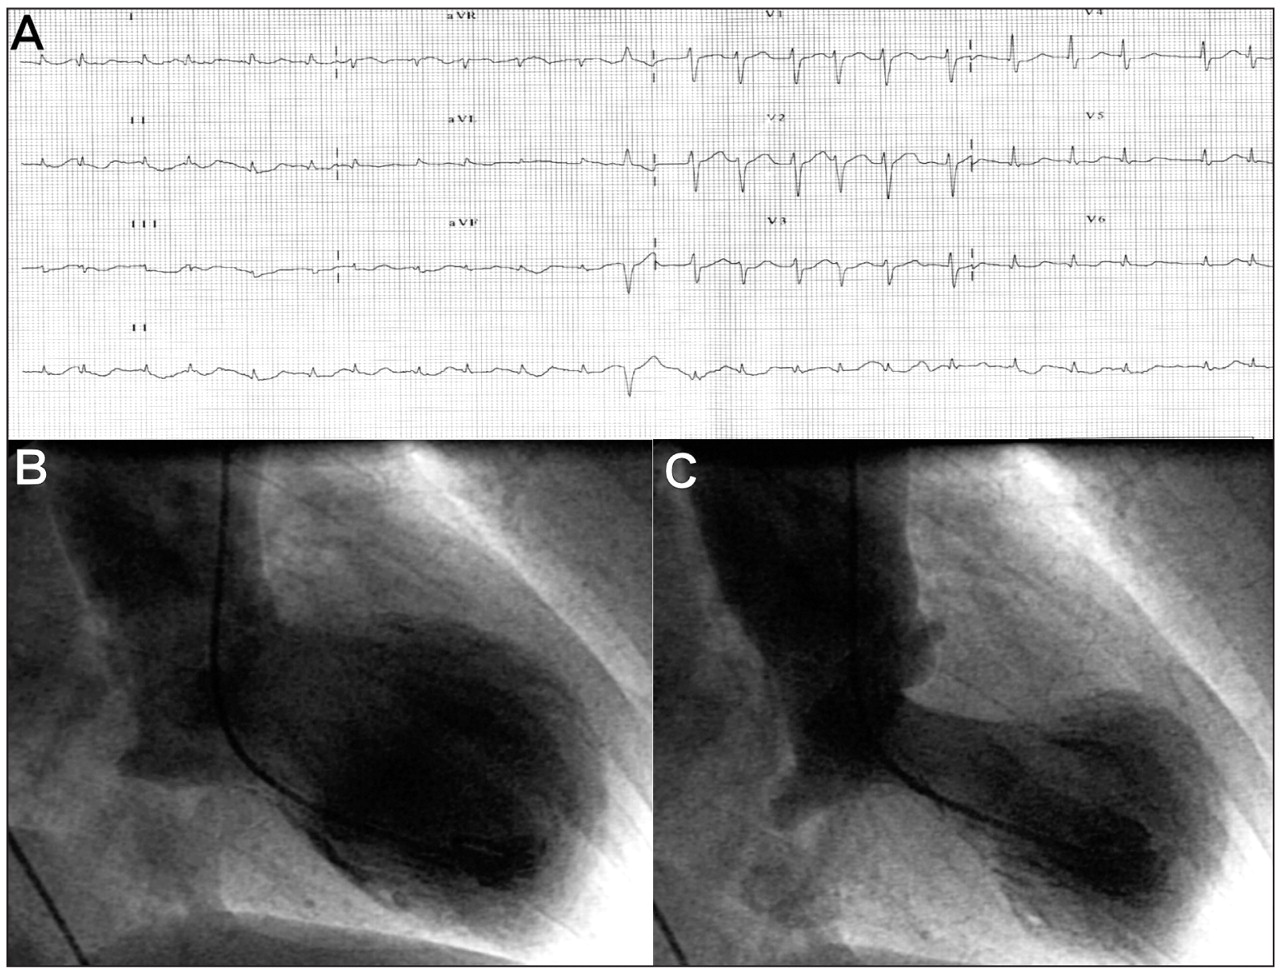
Figure 1: Panel A: Electrocardiogram showing atrial fibrillation with a rapid ventricular response, slight depression of the ST-segment in leads III and AVF, and T-wave inversion in leads I, II, III, AVF, AVL and V3–6. Panel B: Left ventriculogram in diastole. Panel C: End-systolic left ventriculogram demonstrating the classic apical ballooning and hypercontractile basal segments in the left ventricle (video available at www.cmaj.ca/cgi/content/full/180/10/1033/DC1.)

In this issue
Article tools
Respond to this article


Jump to section
Related Articles
Cited By...
- No citing articles found.
More in this TOC Section
Similar Articles

