


- © 2008 Canadian Medical Association
Abstract
Background: Researchers have predicted that there will be a relative increase of 24% in the prevalence of hypertension in developed countries from 2000 to 2025. Hypertension is a leading risk factor for death, stroke, cardiovascular disease and renal disease. Thus, accurate estimates of the prevalence of hypertension in a population have important implications for public policy. We sought to assess whether the estimated increase in the prevalence of hypertension has been underestimated.
Methods: We performed a population-based cohort study using linked administrative data for adults aged 20 years and older in Ontario, Canada's most populous province with more than 12 million residents. Using a validated case-definition algorithm for hypertension, we examined trends in prevalence from 1995 to 2005 and in incidence from 1997 to 2004.
Results: The number of adults with hypertension more than doubled from 1995 to 2005. The age- and sex-adjusted prevalence increased from 153.1 per 1000 adults in 1995 to 244.8 per 1000 in 2005, which was a relative increase of 60.0% (p < 0.001). The age- and sex-adjusted incidence of hypertension increased from 25.5 per 1000 adults in 1997 to 32.1 per 1000 in 2004, which was a relative increase of 25.7% (p < 0.001).
Interpretation: Our findings indicate that the rise in hypertension prevalence will likely far exceed the predicted prevalence for 2025. Public health strategies to prevent and manage hypertension and its sequelae are urgently needed.
Hypertension is an important risk factor for death, stroke and cardiovascular disease and a major cause of end-stage renal disease. Kearney and colleagues1 estimated that the prevalence of hypertension in 2000 was 26% of the adult population globally and that in 2025 the prevalence would increase by 24% in developed countries and 80% in developing countries. Results of a recent population-based study performed in Canada indicated that the prevalence of diabetes mellitus increased substantially from 1995 to 2005, and that the 2005 prevalence had already exceeded the World Health Organization's projected global rate for 2030.2 This rapid rise in diabetes prevalence has been attributed to an unprecedented increase in obesity and lifestyle changes in developed countries.3,4 Obesity and sedentary lifestyles are also major risk factors for hypertension.5 Therefore, the prevalence of hypertension is also likely rising at a faster rate than predicted.
Prior population estimates for the prevalence of hypertension in Canada have been based largely on physical-measures surveys6 and patient self-report surveys.7 Although these methods are costly and time-consuming, they are not subject to bias associated with changes in physician practice patterns and diagnosis. The last physical-measures survey for hypertension in Canada was conducted between 1986 and 1992.6 Although the next physical-measures survey is expected to begin in 2008, these surveys are limited by their inability to follow patients or assess trends over time because they are conducted only at a single point and involve a relatively small sample of patients. In Canada, self-report surveys are conducted every 2 to 3 years; however, similar to physical-measures surveys, they are limited in their scope and ability to follow patients over time. In addition, it is possible that participants may under-report hypertension.8 Thus, population estimates based on self-report surveys may underestimate the true prevalence of hypertension.9
Prompted by the substantial underestimation of the projection for diabetes prevalence, we sought to determine whether projections for hypertension have also been underestimated. We examined trends in the prevalence and incidence of hypertension in Canada from 1995 to 2005.
Methods
Study population and data sources
We based our study on the population of Ontario, which has more than 12 million residents and constitutes more than one-third of Canada's population. In addition, Ontario has high ethnic diversity, and 85% of its residents live in urban areas.10 Ontario has a universal single-payer health care system that covers all physician and hospital services. We searched the Ontario Health Insurance Plan database for physician claims (Apr. 1, 1991, to Mar. 31, 2007) and the Canadian Institute for Health Information database for hospital admissions (Apr. 1, 1991, to Mar. 31, 2006). We linked the data from these databases together with data from the Registered Persons Database using a unique encrypted Ontario health card number that protects the identity of individuals but allows for the examination of individuals across the administrative databases. The Ontario Health Insurance Plan database records all fee-for-service billings for physician services rendered in Ontario and includes the primary diagnosis at each visit. The Canadian Institute for Health Information database records the primary diagnosis and up to 15 secondary diagnoses for all patients discharged from acute care hospitals. Studies on the validity of these administrative databases have confirmed their high degree of accuracy and comprehensiveness.11
Our study received ethics approval from the institutional review board at Sunnybrook Health Sciences Centre, Toronto, Ontario.
Data synthesis
The use of a number of different algorithms combining the data from the Ontario Health Insurance Plan and Canadian Institute for Health Information databases to identify patients with hypertension has previously been tested against data on physician-diagnosed hypertension obtained through chart abstraction in primary care physicians' offices. For our study, we used a case-definition algorithm of 2 physician billing claims or 1 hospital discharge with a diagnosis of hypertension in a 2-year period that had the following diagnostic codes: 401.x, 402.x, 403.x, 404.x, or 405.x (International Classification of Disease, 9th revision) or I10.x, I11.x, I12.x, I13.x, or I15.x (International Statistical Classification of Diseases and Related Health Problems, 10th revision). This algorithm was previously demonstrated to identify adults with hypertension with a sensitivity of 72%, specificity of 95%, positive predictive value of 87% and negative predictive value of 88%.12
Using this algorithm, we calculated the annual prevalence rates of hypertension among patients aged 20 years and older from fiscal years 1995 (Apr. 1, 1994, to Mar. 31, 1995) to 2005 (Apr. 1, 2004, to Mar. 31, 2005). We present point prevalence and incidence rates according to the end of the fiscal periods. We chose the start date of Apr. 1, 1991, to allow for sufficient time to identify prior prevalent cases of hypertension, and we chose the end date of Mar. 31, 2007, to allow for a 2-year “look forward” period for a second physician billing claim or hospital admission because of hypertension, as dictated by our algorithm and constrained by data availability. To avoid including patients with hypertension due to pregnancy in our analysis, we excluded any hypertension-related billing claim or hospital admission that occurred within 120 days before and 90 days after an obstetric event. Once we identified patients as having hypertension and included them in our analysis, they remained part of our study population throughout the study period unless they died or moved out of the province. We classified patients as having incident hypertension based on the first database record that included a hypertension diagnosis. We present incidence rates from 1997 to 2004, allowing for a look-back period of 5 years to determine whether a patient had any prior hypertension records. In cases where there were prior records, the patient was not counted as a new hypertension case. We chose a period of 5 years because the use of shorter periods appeared to falsely elevate incidence, with some prevalent cases being erroneously considered as incident cases.
We determined rates of patients with both diagnosed hypertension and a prior diagnosis of diabetes by identifying patients who were listed in the Ontario Diabetes Database13 in the year before hypertension was diagnosed. We also examined the socioeconomic status of patients with hypertension using neighbourhood income quintiles derived from 2001 census data by postal code,14,15 as well as residence location (rural v. urban) using Statistics Canada definitions.16
To asses potential changes in coding of administrative data for hypertension, and to determine whether more frequent visits to a physician resulted in a higher likelihood of receiving a diagnosis of hypertension, we looked at the number of visits to a primary care physician in the year before the date of diagnosis in 1997, 2000 and 2004.
Statistical analysis
We calculated annual prevalence rates by dividing the number of patients with hypertension who were alive at the end of each fiscal year by the census population count on July 1 of the previous year. For years when census measures were unavailable, we used estimated population measures provided by Statistics Canada.17 To calculate the annual incidence rates, we divided the annual number of new hypertension diagnoses by the annual number of patients at risk for hypertension (the total population minus the number of people with prevalent hypertension in the previous year).
To compare hypertension prevalence and incidence rates over the fiscal years, we adjusted for age and sex according to 2001 Canadian census data. To compare rates between the sexes over the years, we adjusted for age using 2001 census data. We used a logistic regression model to test for trends in hypertension prevalence and incidence over time, and to examine the effect of age and sex on incidence rates. We assessed the effects of fiscal year, age (in 15-year groups) and sex using a multivariable logistic regression model. We compared prevalence and incidence rates between the sexes and betweed age groups using χ2 analyses. We compared changes in prevalence and incidence rates between the sexes and age groups using Cochran–Mantel–Haenszel and Breslow–Day tests. We calculated the percentage change in prevalence and incidence rates between years by dividing the difference in the rate between the 2 years by the earlier rate and multiplying the result by 100.
We used a logistic regression model to adjust for additional variables, including history of diabetes,13 Charlson Comorbidity Index score (0, 1 or 2+),18 5-year history of cardiovascular disease,19 residence location (urban v. rural)16 and socioeconomic status.14,15 We used a Pearson correlation coefficient to assess trends in annual prevalence and incidence rates, adjusted for multiple variables.
Results
The number of adults with hypertension more than doubled from 1995 to 2005 (Table 1). Population increases could not account for this increase in prevalence because the adult population had a relative increase of 17.4% during this period. The age- and sex-adjusted prevalence increased from 153.1 per 1000 adults in 1995 to 244.8 per 1000 in 2005, which was a 60.0% relative increase (p < 0.001). Furthermore, we found that, for the period 2000–05, the prevalence rose by 20.9% (p < 0.001). The average annual increase in prevalence was 4.4% (SD 1.44), and the increases remained statistically significant after multivariable adjustments for age, sex, diabetes status, history of cardiovascular disease, Charlson Comorbidity Index score, socioeconomic status, and residence location (Figure 1).
Table 1.

Figure 1: Prevalence of hypertension in the province of Ontario from 1995 to 2005. We used a logistic regression model to adjust for age, sex, residence location (urban v. rural), socioeconomic status, presence of diabetes, 5-year history of cardiovascular disease, Charlson Comorbidity Index score, and interaction terms between age and sex. Yearly rates are based on prevalence as of Mar. 31 of each year. Results of the Pearson correlation test p < 0.001.
Our multivariable logistic regression model indicated a 2-way interaction between age and year, and a 3-way interaction between age, sex and year. The increase in population-adjusted prevalence from 1995 to 2005 was greater among men than among women: (64.8% v. 56.0% relative increase, p < 0.001). Although in the younger group the number of men in whom hypertension was diagnosed was slightly higher than the number of women, the opposite was true in the group aged 50 and older (Table 1 and Figure 1).
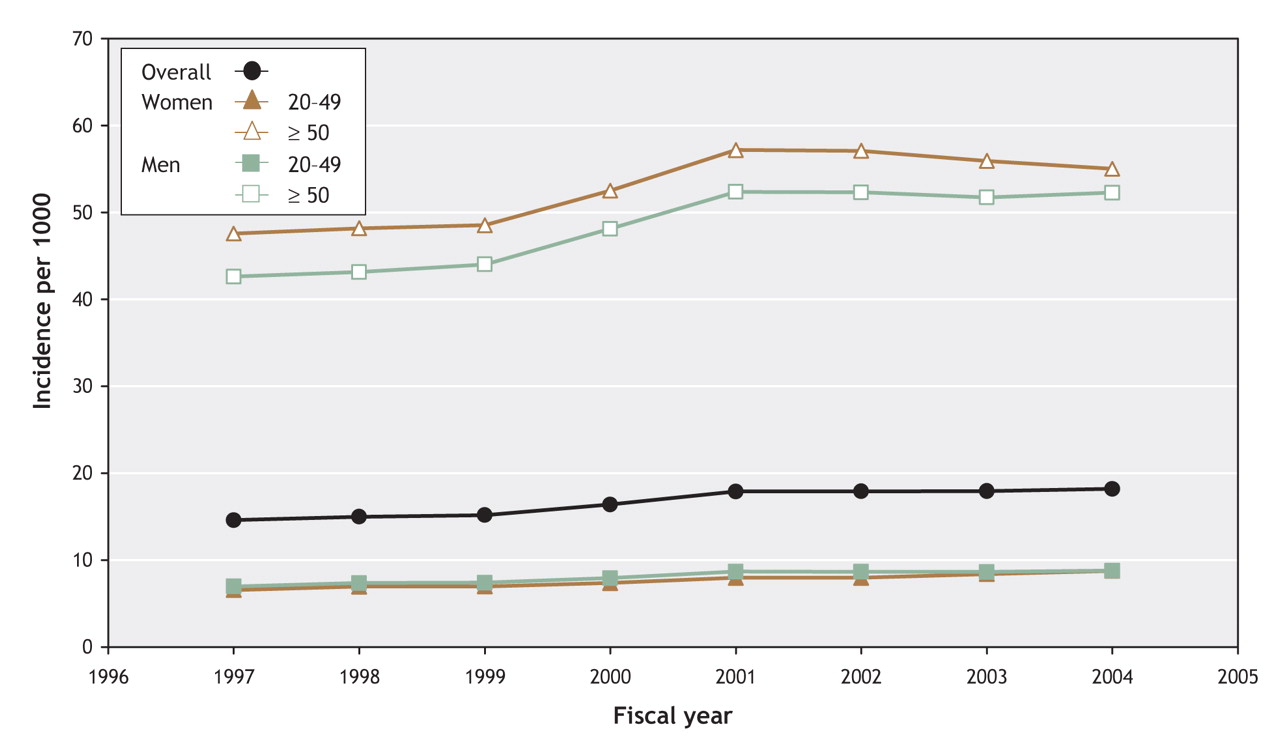
The age- and sex-adjusted incidence of hypertension increased from 25.5 per 1000 adults in 1997 to 32.1 per 1000 in 2004, which was a relative increase of 25.7% (p < 0.001). The incidence increased only slightly more in the younger group than in the older group (Table 2). The incidence increased rapidly from 1999 to 2001, and then levelled off (Figure 2).
Table 2.

Figure 2: Incidence of hypertension in the province of Ontario from 1997 to 2004. We used a logistic regression model to adjust for age, sex, residence location (urban v. rural), socioeconomic status, presence of diabetes, 5-year history of cardiovascular disease, Charlson Comorbidity Index score, and interaction terms between age and sex. Yearly rates are based on prevalence as of Mar. 31 of each year. Results of the Pearson correlation test were p < 0.001 overall and for women and men aged 20–49 years, p = 0.007 for women aged 50 years and older and p = 0.001 for men aged 50 years and older.
The percentage of people with incident hypertension who had existing diabetes increased from 10.9% in 1997 to 12.7% in 2004, which was a relative increase of 16.5% (p < 0.001) (Table 3). The distribution of hypertension diagnosis was fairly even among income quintiles, and there was a slight decrease in incidence among patients in the lowest income quintiles over time (Table 3). There was also a slight decrease among patients living in rural areas (Table 3). The number of patients with hypertension in each of the categories of number of visits in the year before diagnosis of hypertension was similar in each year assessed (Table 3).
Table 3.
Interpretation
Although Kearney and colleagues1 estimated that the prevalence of hypertension would increase by 24% between 2000 and 2025 in developed countries, we found that the age- and sex-adjusted prevalence of hypertension among adults aged 20 years and older in Ontario increased by 60.0% from 1995 to 2005, and by 20.9% from 2000 to 2005. The increase in the most recent 5-year period has almost reached what Kearney and colleagues predicted would occur over 25 years. We also found a 25.7% increase in the age- and sex-adjusted incidence of hypertension from 1997 to 2004; however, this increase in incidence alone did not appear to be sufficient to explain the overall increase in prevalence. Thus, in a separate article in this issue of CMAJ,20 we examine changes in mortality among patients with hypertension over the same period.
Overall, we found that, similar to estimates of the prevalence of diabetes, the prevalence of hypertension has been underestimated.2 Although not to the same magnitude as with diabetes, the increase in prevalence of hypertension was slightly higher among younger adults than among older adults. Rising obesity rates were suggested to have contributed to the increase in diabetes, and obesity has also likely led to an increase in hypertension.3 We found that diabetes was increasingly prevalent among people with a diagnosis of hypertension. We found a more rapid increase in incidence of hypertension between 1999 and 2001. This period coincided with the start of the Canadian Hypertension Education Program.21,22 The intent of this program is to improve awareness of hypertension guidelines among health care providers, and the program may have contributed to a decrease in undiagnosed hypertension. Although the ICD diagnostic codes for hypertension changed in 2003 in the hospital admission database, a sensitivity analysis using an algorithm of 2 physician billing codes in 3 years showed a similar pattern of increase, and there have been no changes in physician billing practices or policies, such as incentives for hypertension, that could account for this increase. An increasing number of visits to the physician did not appear to increase the possibility of hypertension being diagnosed. This was similar in all 3 years assessed, which also suggests that there were no major changes in physician coding practices for hypertension during the study period.
The prevalence rates of physician-diagnosed hypertension in our study are about 3%–4% higher than those found in national self-report surveys during a similar period.23 They are a little lower than the estimated 5% of patients taking antihypertensive medications who do not report that they have hypertension, perhaps because they erroneously believe that they are cured if their blood pressure is under control.8 Our finding of a higher prevalence of hypertension among older women than among older men was similar to sex-related differences in the national self-report surveys;23 however, the sex-related differences in our study were slightly greater than the global predicted estimates.1
By using a validated case-definition algorithm for the administrative data, we were able to examine hypertension prevalence and incidence over a large, ethnically diverse population, and to follow our population over time. However, the validation of the algorithm that we used applied to a population aged 35 years and older. The algorithm was likely as accurate in our population, given that younger adults probably have fewer competing comorbidities than older adults.
We chose a case-definition algorithm of 2 physician billing codes or 1 hospital admission code in 2 years in part because of its high level of accuracy and because of constraints on data availability. Case-definition algorithms that do not use a hospital admission database may miss patients with more comorbidities because the outpatient physician billing database typically records only the primary diagnosis.
There are other limitations inherent to the use of administrative data that may have led to an underestimation of the occurrence of hypertension, which further strengthens our argument that current projections are too low. First, administrative data do not capture actual blood pressure measurements. Therefore, we rely on physician recognition of patients with hypertension. Second, our algorithm requires that patients use the health care system either as an outpatient or as an in-hospital patient. As a result, we are unable to capture undiagnosed hypertension. In addition, our algorithm has been found to miss up to 28% of cases when compared with audits of primary care physician charts, which may also be responsible for the underestimation of the true prevalence of hypertension.12 Third, our findings of a greater prevalence of hypertension among women than among men may, in part, be related to women visiting physicians more often then men24 and, therefore, having more opportunities to receive a diagnosis of hypertension.25 The extent to which this factor affects the sex-based differences in prevalence in our study cannot be measured with our administrative data. Finally, about 2% of physicians are paid salaries under alternate funding plans, and their billings do not appear in the Ontario Health Insurance Plan database. Nonetheless, it is estimated that less than 6% of the population report not having a family physician, and more than 75% of the population report visits to a primary care physician at least once a year.26 Thus, within a 2- or 3-year period, it is likely that almost all residents have at least 1 visit to a physician. Furthermore, in the 2001 Canadian Community Health Survey, 73% of respondents reported having their blood pressure measured within the past year and 85% reported having a blood pressure measured in the 2 years before the survey.7
The prevalence of hypertension is steadily increasing, and in fewer than 10 years it will likely exceed the prevalence projected for 2025. This anticipated increase, in conjunction with a comparable increase in diabetes,2 will invariably lead to dramatic rises in the incidence of cardiovascular diseases and their consequences, which has the potential to overwhelm a health care system that is modelled on underestimates. The increasing prevalence of hypertension will also have financial implications for provincial drug plans because there is increasing evidence that the majority of patients with hypertension will require 2 or more drugs to achieve blood pressure control.27 Our study highlights the need for strategies to improve the prevention of hypertension.
Footnotes
-
Une version française de ce résumé est disponible à l'adresse www.cmaj.ca/cgi/content/full/178/11/1429/DC1
This article has been peer reviewed.
Contributors: All authors designed the study, analyzed and interpreted the data and critically revised the manuscript for important intellectual content. Karen Tu drafted the manuscript and obtained funding for the study. Zhongliang Chen collected the data. All authors approved the final version of the manuscript submitted for publication.
Acknowledgements: We thank Dr. Finlay A. McAlister and Dr. Norman R.C. Campbell for their review of and input into this manuscript.
This research was supported by a Grant-in-Aid (no. NA 5459) from the Heart and Stroke Foundation of Ontario. The funder had no role in the design or conduct of the study; the collection, management, analysis or interpretation of the data; or the preparation, review or approval of the manuscript.
Lorraine Lipscombe is funded by a Clinician–Scientist award from the Canadian Diabetes Association and the Canadian Institutes of Health Research.
Competing interests: None declared.
REFERENCES
In this issue

Article tools


Jump to section
Related Articles
Cited By...
- Sex Differences in Intensity of Care and Outcomes After Acute Ischemic Stroke Across the Age Continuum
- Identification of Early Onset Dementia in Population-Based Health Administrative Data: A Validation Study Using Primary Care Electronic Medical Records
- Drivers and outcomes of variation in surgical versus transcatheter aortic valve replacement in Ontario, Canada: a population-based study
- Association of bilateral salpingo-oophorectomy with all cause and cause specific mortality: population based cohort study
- Importance of accounting for loss to follow-up when comparing mortality between immigrants and long-term residents: a population-based retrospective cohort
- Association of Neighborhood-Level Material Deprivation With Health Care Costs and Outcome After Stroke
- Incidence of Stroke in Immigrants to Canada: A Province-wide Retrospective Analysis
- Tyrosine kinase inhibitors in chronic myeloid leukaemia and emergent cardiovascular disease
- Testing, infection and complication rates of COVID-19 among people with a recent history of homelessness in Ontario, Canada: a retrospective cohort study
- Characteristics of patients with mental illness and persistent high-cost status: a population-based analysis
- Predictors of oral anticoagulant-associated adverse events in seniors transitioning from hospital to home: a retrospective cohort study protocol
- Impact of procedural capacity on transcatheter aortic valve replacement wait times and outcomes: a study of regional variation in Ontario, Canada
- The risk of death within 5 years of first hospital admission in older adults
- Examining the effects of low back pain and mental health symptoms on healthcare utilisation and costs: a protocol for a population-based cohort study
- The risk of new-onset epilepsy and refractory epilepsy in older adult stroke survivors
- Quality of primary care among individuals receiving treatment for opioid use disorder
- Association Between Cardiovascular Risk Factors and Aortic Stenosis: The CANHEART Aortic Stenosis Study
- Cost evaluation of out-of-country care for patients with eating disorders in Ontario: a population-based study
- Breast Cancer Therapy-Related Cardiac Dysfunction in Adult Women Treated in Routine Clinical Practice: A Population-Based Cohort Study
- Association of hospital and physician case volumes with cardiac monitoring and cardiotoxicity during adjuvant trastuzumab treatment for breast cancer: a retrospective cohort study
- The CANHEART health index: a tool for monitoring the cardiovascular health of the Canadian population
- Spatial Association Between Ambient Fine Particulate Matter and Incident Hypertension
- The relation between total joint arthroplasty and risk for serious cardiovascular events in patients with moderate-severe osteoarthritis: propensity score matched landmark analysis
- Economic Evaluation of Percutaneous Left Atrial Appendage Occlusion, Dabigatran, and Warfarin for Stroke Prevention in Patients With Nonvalvular Atrial Fibrillation
- Early cholecystectomy for acute cholecystitis: a population-based retrospective cohort study of variation in practice
- Diagnosed hypertension in Canada: incidence, prevalence and associated mortality
- Changes in the rates of awareness, treatment and control of hypertension in Canada over the past two decades
- Newly diagnosed diabetes mellitus as a risk factor for serious liver disease
- Incidence and Predictors of Hypertension Among Rural Chinese Adults: Results From Liaoning Province
- Trends in risk factors for cardiovascular disease in Canada: temporal, socio-demographic and geographic factors
- Prise en charge de l'hypertension par les medecins de famille: Est-ce le temps de nous feliciter?
- Hypertension and the family physician
- Hypertension management by family physicians: Is it time to pat ourselves on the back?
- Comparison of primary care physician payment models in the management of hypertension
- L'hypertension et le medecin de famille
- Tackling the burden of hypertension in Canada: Encouraging collaborative care
- S'attaquer au fardeau de l'hypertension au Canada: Encourager les soins en collaboration
- Hypertension in children and adolescents
- Hypertension management in Canada: good news, but important challenges remain
- Mortality among patients with hypertension from 1995 to 2005: a population-based study
More in this TOC Section
Similar Articles
Collections

