


Article Figures & Tables
Figures
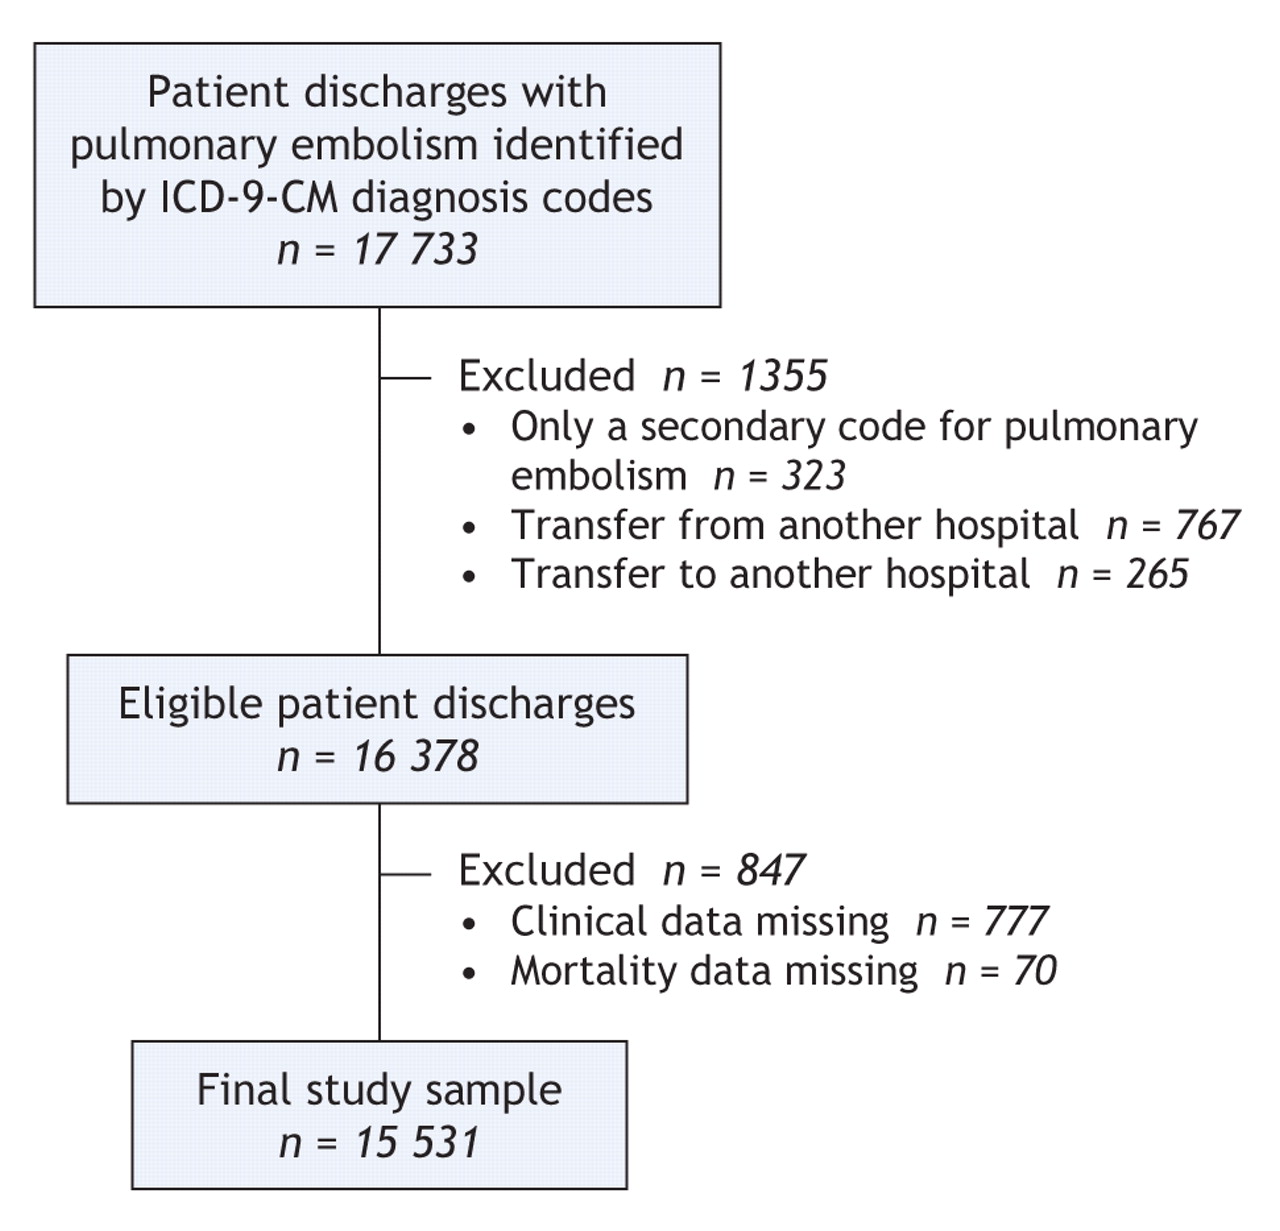
Figure 1: Identification of sample for study of outcomes of pulmonary embolism in relation to hospital case volume. ICD-9-CM = International Classification of Diseases, 9th revision, Clinical Modification.
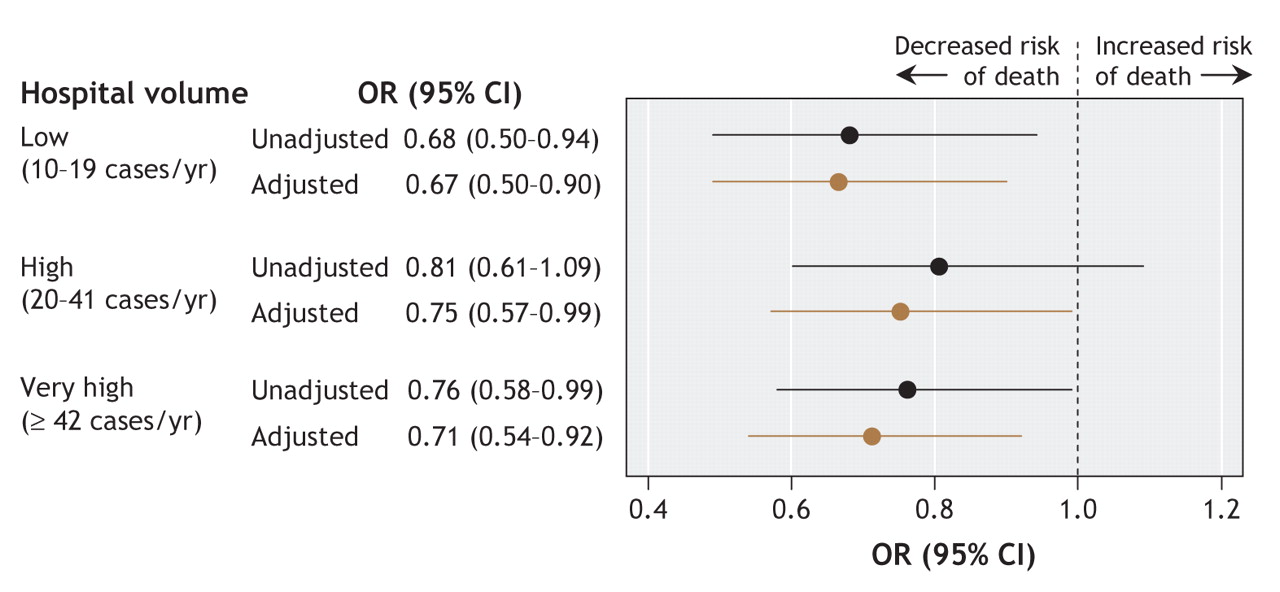
Figure 2: Unadjusted and adjusted odds ratios for in-hospital mortality among 15 531 patients with pulmonary embolism, by hospital volume (annual number of cases of pulmonary embolism treated). (Adjustments were for hospital region within Pennsylvania, hospital teaching status, race, insurance status, severity of illness and administration of thrombolytic therapy.) OR = odds ratio, CI = confidence interval.
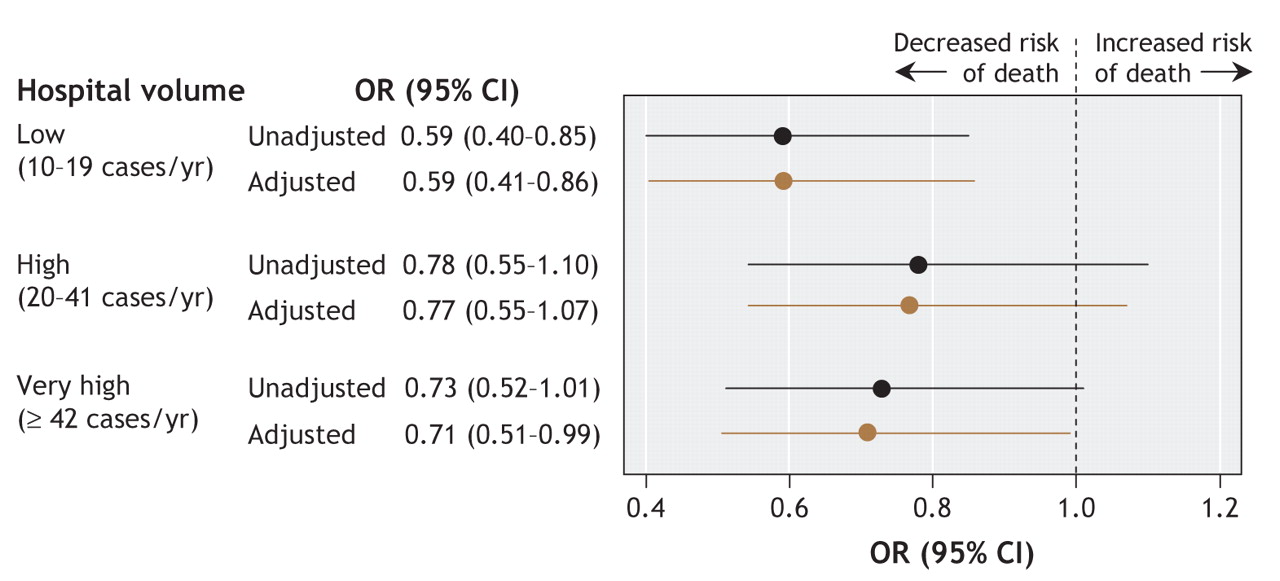
Figure 3: Unadjusted and adjusted odds ratios for 30-day mortality among 15 531 patients with pulmonary embolism, by hospital volume (annual number of cases of pulmonary embolism treated). (Adjustments were for hospital region within Pennsylvania, hospital teaching status, race, insurance status, severity of illness and administration of thrombolytic therapy.) OR = odds ratio, CI = confidence interval.


Tables
Table 1.

Table 2.


In this issue

Article tools


Jump to section
Related Articles
Cited By...
More in this TOC Section
Similar Articles
Collections

