


- © 2007 Canadian Medical Association or its licensors
Abstract
Background: The Canadian and American Diabetes Associations recommend the use of an oral glucose tolerance test to screen for abnormal glucose tolerance among women with polycystic ovary syndrome when their fasting plasma glucose level is 5.7 mmol/L or more (Canadian guideline) and 5.6 mmol/L or more (American). Our objective was to determine the predictive value of 5.6 mmol/L as a fasting plasma glucose cutoff for detecting abnormal glucose tolerance in women with polycystic ovary syndrome, and then to define the optimal cutoff for this population.
Methods: An oral glucose tolerance test was administered to 105 consecutive women with polycystic ovary syndrome referred to an academic reproductive endocrine clinic. We calculated sensitivity, specificity and likelihood ratios.
Results: The sensitivity of a 5.6 mmol/L cutoff was 48% (95% confidence interval [CI] 30%–67%); its specificity, 98.7% (95% CI 96.1%–100%). With this cutoff, 52% of women with polycystic ovary syndrome whose glucose tolerance is abnormal would be missed. The prevalence of abnormal glucose tolerance was 28%, with a positive predictive value of 93% (95% CI 81%–100%) and a negative predictive value of 83% (95% CI 76%–91%). The likelihood ratio for a positive test was 36.7 (95% CI 5.0–267), and for a negative test, 0.5 (95% CI 0.4–0.7). The optimal fasting plasma glucose cutoff value was 5.0 mmol/L, with a 79% sensitivity (95% CI 65%–94%) and 66% specificity (95% CI 55%–77%). If this cutoff were used, 24% of women with abnormal glucose tolerance would still be missed.
Interpretation: The Canadian and American recommendations — of screening for abnormal glucose tolerance with an oral glucose tolerance test only when the results of a fasting plasma glucose test are 5.7 mmol/L (or 5.6 mmol/L) or more — are inappropriate for women with polycystic ovary syndrome. We therefore recommend that all women with polycystic ovary syndrome have an oral glucose tolerance test.
Polycystic ovary syndrome is a common disorder affecting some 6%–10% of women of reproductive age.1–3 Although it is the clinical manifestations of chronic anovulation and hyperandrogenemia that usually bring these women to visit a physician, insulin resistance and hyperinsulinemia are also frequent in this population4–10 and play an important etiologic role.11–17 Indeed, the prevalence rates of impaired glucose tolerance and type 2 diabetes in women with this syndrome are both higher than expected for women of similar age, reaching 30%–40% and 10%, respectively.18,19 Moreover, hypertension, an atherogenic lipid profile and obesity are more prevalent in this population than among age-matched control subjects.20,21 This adverse metabolic profile contributes to an excess cardiovascular risk in this youthful population.22,23
Since abnormal glucose tolerance is a major cardiovascular risk factor, it is important that it be detected early. The progression to type 2 diabetes can be prevented by lifestyle changes in people whose glucose tolerance is impaired.24,25
Despite some evidence that fasting plasma glucose testing does not reliably predict abnormal glucose tolerance in women with polycystic ovary syndrome,18,26 current Canadian and American guidelines still rely mainly upon this test for screening. Notably, guidelines from the Canadian Diabetes Association27 recommend an oral glucose tolerance test for people at risk (including women with polycystic ovary syndrome) only when their fasting plasma glucose result reaches 5.7 mmol/L or more. The American Diabetes Association suggests that screening for abnormal glucose tolerance be considered for young patients if they are overweight and present another risk factor for diabetes, such as polycystic ovary syndrome (level of evidence E).28 Furthermore, the US association does not recommend an oral glucose tolerance test over a fasting plasma test for screening (level B) unless the results of a fasting plasma glucose test are 5.6 mmol/L or more (level E). Because the fasting tests are, in most clinical settings, easier to perform as well as less expensive, most clinicians applying these recommendations will therefore not conduct oral glucose tolerance tests when their patient's fasting plasma glucose measurement meets or exceeds 5.7 (or 5.6) mmol/L.
Since fasting plasma glucose results have been shown to be not well correlated with abnormal glucose tolerance in women with polycystic ovary syndrome, we hypothesized that these recommendations may be inappropriate for patients with that syndrome. The aim of this study was therefore to determine the predictive value of a fasting plasma glucose cutoff of 5.6 mmol/L to identify people with abnormal glucose tolerance among those with polycystic ovary syndrome, and to define the optimal cutoff for the fasting test for this subpopulation. We performed our analyses with the American Diabetes Association's more conservative fasting plasma glucose cutoff because, if our hypothesis was true, our conclusion would also apply to the Canadian Diabetes Association's slightly higher recommendation (≥ 5.7 mmol/L).
Methods
This retrospective study looked at test results for 168 consecutive women with polycystic ovary syndrome referred to the Reproductive Endocrine Clinic of the Centre hospitalier universitaire de Sherbrooke from August 2003 through December 2005. All women met the established criteria for the diagnosis of polycystic ovary syndrome:29,30 oligomenorrhea (≤ 8 menstrual periods during the preceding year) or anovulation, as well as clinical or biochemical signs of hyperandrogenism (serum total testosterone results > 2.6 nmol/L and calculated free testosterone > 50 pmol/L). Of these patients, 105 had been screened with a 2-hour 75-g oral glucose tolerance test and met none of our exclusion criteria: nonclassical congenital adrenal hyperplasia, abnormal thyroid function, hyperprolactinemia, evidence of androgen-secreting tumours or Cushing's syndrome, and having taken medications known to affect the metabolism of sex hormones or glucose tolerance during the month before testing (3 mo, for oral contraceptives).
Initial high levels of serum 17α-hydroxyprogesterone (i.e., 17-OHPg ≥ 10 nmol/L) in 2 patients dropped to within a normal range after treatment with metformin. These subjects were included in the study because, in cases of nonclassical congenital adrenal hyperplasia, that effect is not expected.
Impaired glucose tolerance was classified according to 2006 American Diabetes Association and 2003 Canadian Diabetes Association diagnostic criteria:27,28 2 hours after the glucose drink, a glucose measurement of 7.8–11.1 mmol/L constituted impaired glucose tolerance; a level of 11.1 mmol/L or more defined a provisional diagnosis of diabetes mellitus (essentially, type 2). The study protocol was approved by the Institutional Review Board of the Centre hospitalier universitaire de Sherbrooke.
Blood samples were assayed at the hospital's clinical laboratory. Total testosterone, dehydroepiandrosterone sulfate (DHEAS) and 17-OHPg levels were determined by radioimmunoassay; sex-hormone binding globulin, by immunoradiometric assay. Serum concentrations of free testosterone were calculated by means of the method of Sodergard and colleagues,31 with a standard serum albumin concentration of 40 g/L. Progesterone, follicle-stimulating hormone, luteinizing hormone, thyroid-stimulating hormone, prolactin, glucose, total cholesterol, triglycerides and high-density lipoprotein–cholesterol (HDL-C) were measured by chemiluminescence; low-density lipoprotein–cholesterol (LDL-C) concentrations were calculated with the Friedewald equation.32 Inter-and intra-assay coefficients of variation were less than 10% for total testosterone and less than 8.5% for all other steroid hormones.
Differences between groups were assessed via Fisher's exact test for proportions, or the unpaired Student's t test for continuous variables. Variables that were not normally distributed, as determined with the normal quantile plot test, were log-transformed for all statistical analyses, then back-transformed into their original units (geometric means with 95% confidence intervals) for this report.
To determine independent predictive factors of abnormal glucose tolerance, we used a forward stepwise multivariable analysis by successively entering in the model variables that were found in univariate analyses to be significantly associated with abnormal glucose tolerance (p ≤ 0.10), based on the next-lowest p value. At each step, variables that did not contribute significantly to the model (i.e., partial p > 0.05) were excluded.
The sensitivity, specificity, positive and negative predictive values, and likelihood ratios for positive and for negative test results were determined with use of a fasting plasma glucose cutoff of 5.6 mmol/L. A receiver operating characteristic (ROC) curve was generated to define the optimal cutoff for fasting plasma glucose testing, which corresponds to the point closest to the upper left corner of the graph. For all analyses, a 2-tailed p value of 0.05 or less was considered statistically significant. Unless specified otherwise, data are presented as means and standard deviations.
Results
Subjects' clinical and laboratory characteristics are summarized in Table 1. Glucose tolerance results were abnormal in 29 of the 105 women included in the study: 24 (23%) had impaired glucose tolerance and 5 (5%) had diabetes. All but 3 women were of Caucasian ethnicity. Mean age at presentation was 28 years (range 14–47 yr) and the mean body mass index (BMI) was 35.5 kg/m2 (range 19.0–54.8 kg/m2).
Table 1.
Women with polycystic ovary syndrome whose glucose tolerance was abnormal or normal differed significantly in many characteristics. The prevalence of first-degree relatives with type 2 diabetes was more than doubled in subjects with abnormal glucose tolerance (p = 0.007). They were also significantly more obese (p = 0.012) and had higher systolic blood pressures (p = 0.002) than women with normal glucose tolerance. Moreover, they exhibited higher levels of triglycerides (p < 0.001) and LDL-C (p = 0.002), in addition to lower HDL-C levels (p = 0.015).
As expected, fasting glucose levels were higher in subjects with abnormal glucose tolerance (5.4 mmol/L v. 4.5 mmol/L; p < 0.001). Of note, the mean result of fasting plasma glucose testing remained below the cutoff limit of 5.6 mmol/L in the group with abnormal glucose tolerance, even though their mean 2-hour glucose levels were much above 7.8 mmol/L. Furthermore, concentrations of hemoglobin A1C were significantly higher among women with abnormal glucose tolerance (p = 0.010). With regard to androgenic profiles, lower sex-hormone-binding globulin levels (p = 0.001) and higher free testosterone levels (p = 0.025) were predictive of abnormal glucose tolerance.
Finally, multivariable regression analyses found that fasting glucose (p < 0.001), triglycerides (p = 0.006) and LDL-C levels (p = 0.048) were independent predictive factors of abnormal glucose tolerance in women with polycystic ovary syndrome.22
Table 2.
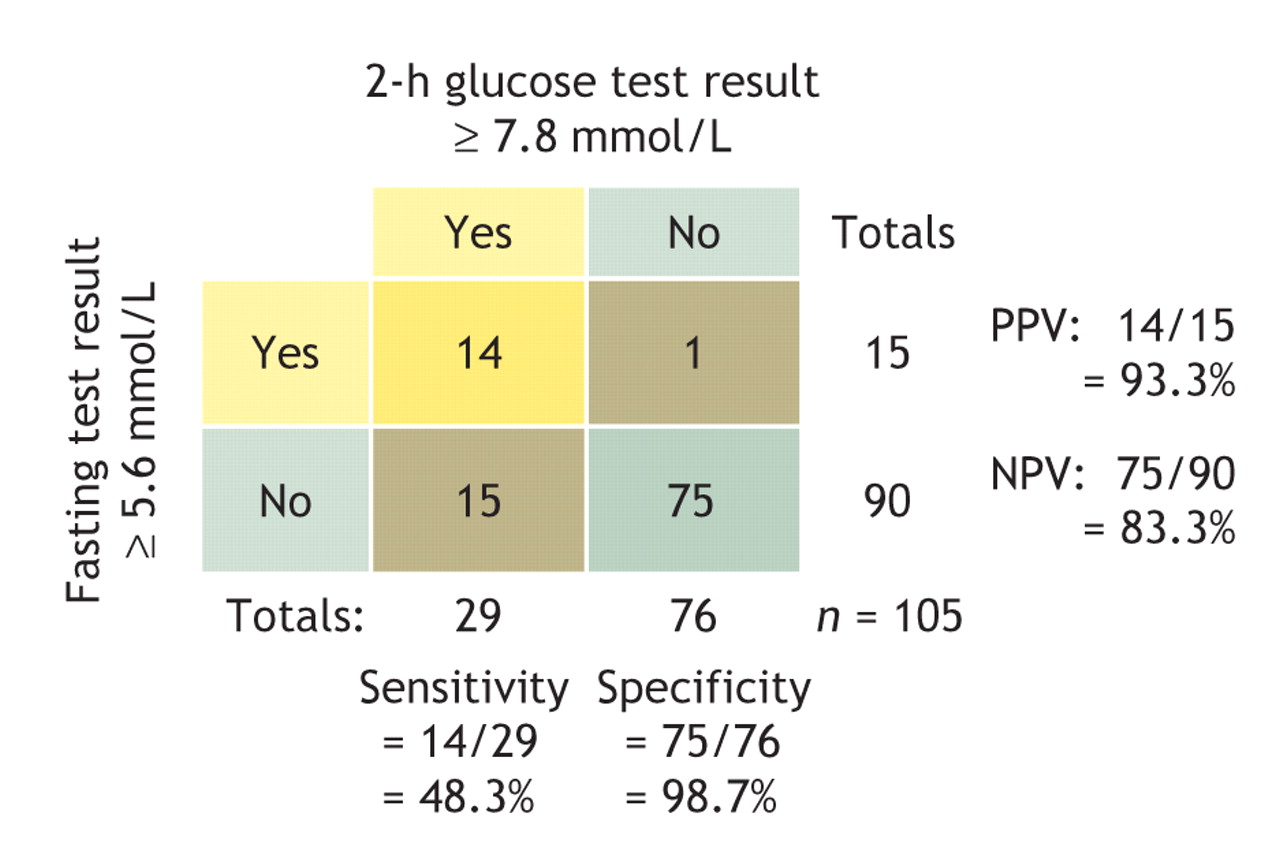
Predictive values and likelihood ratios for the 5.6 mmol/L cutoff for fasting plasma glucose are shown in Table 2. (The procedure for calculating predictive values for the comparison is illustrated with a 2 × 2 table: Fig. 1.) Notably, the 95% confidence interval (CI) of sensitivity was far below 80%, the minimum generally recommended for a screening test.33,34 Indeed, with the use of this criterion, 52% of women with polycystic ovary syndrome whose glucose tolerance was abnormal would have been missed. The prevalence of abnormal glucose tolerance was 28% in the study group. From a screening perspective, the likelihood ratio for a negative test result (0.5, in this comparison) is the more important ratio; ideally, it should be less than 0.1 to rule out the condition tested for.33 According to our findings, a woman with polycystic ovary syndrome and a fasting plasma glucose concentration below 5.6 mmol/L still has a 17% chance of having diabetes.

Fig. 1: A 2 × 2 table showing the performance characteristics of the 2-h glucose tolerance test (cutoff ≥ 7.8 mmol/L) compared with the fasting plasma glucose test (cutoff ≥ 5.6 mmol/L). PPV = positive predictive value, NPV = negative predictive value.
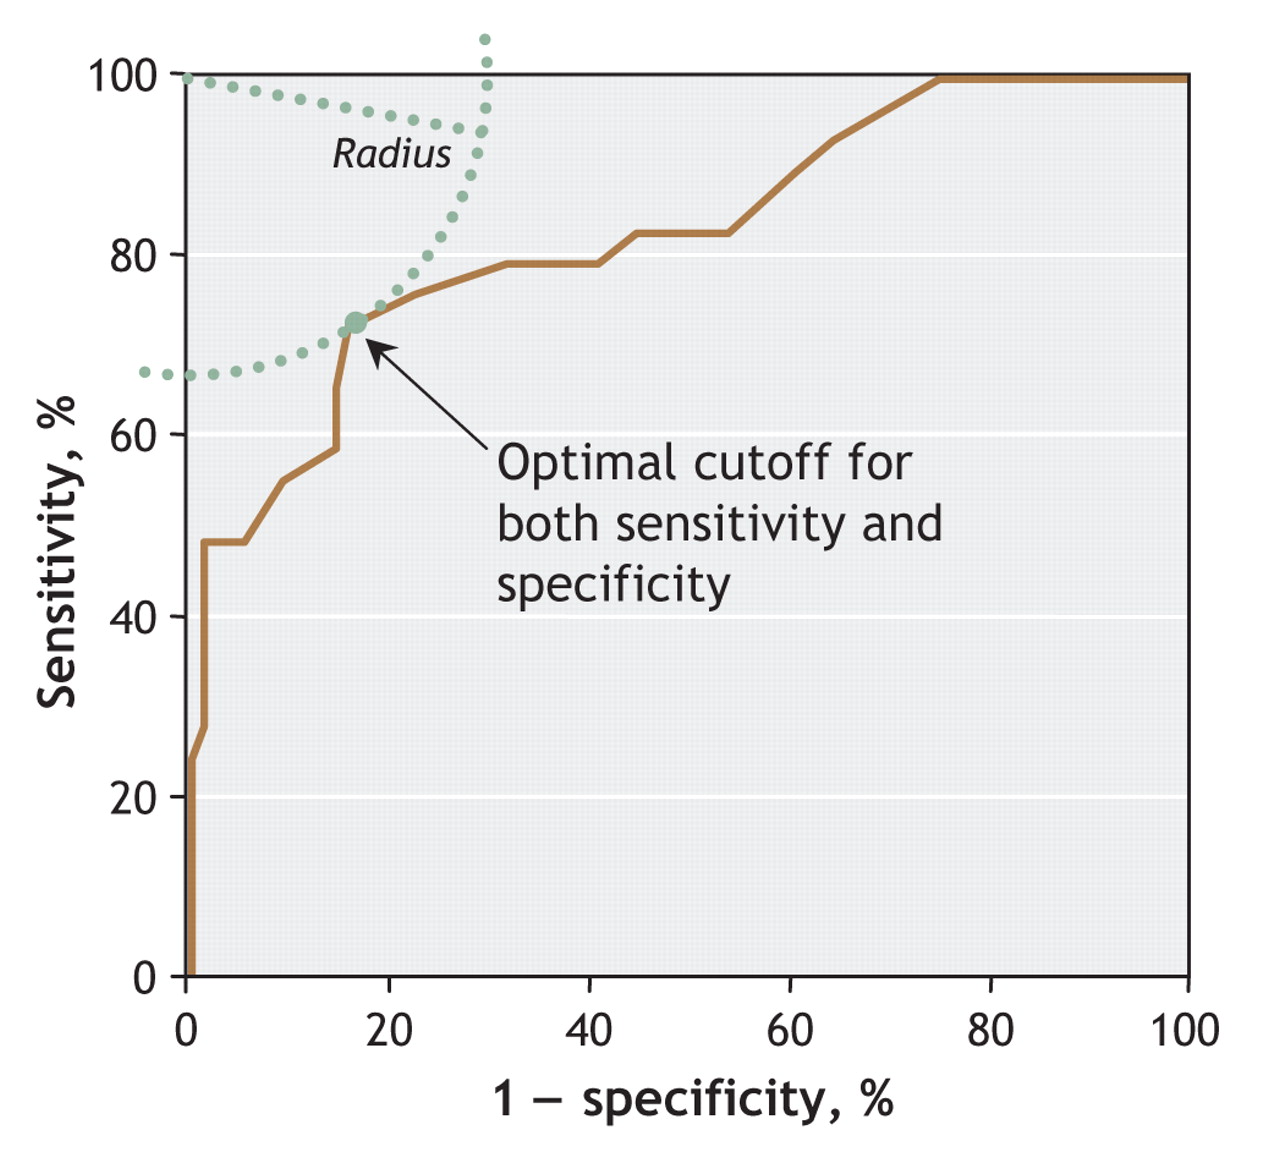
To determine the optimal cutoff for screening, we calculated an ROC curve (Fig. 2). The fasting plasma glucose cutoff with optimal specificity and sensitivity (determined via the “knee” of the curve)35 in women with polycystic ovary syndrome for performing an oral glucose tolerance test was established as ≥ 5.0 mmol/L (sensitivity 76%, 95% CI 60%–91%; specificity 78%, 95% CI 68%–87%).

Fig. 2: Receiver operating characteristic curve of the association between fasting plasma glucose and abnormal glucose tolerance. The area under the curve was 0.828 (95% confidence interval 0.735–0.921). The optimal cutoff for the test is the point closest to the upper-left corner of the graph, which corresponds to a fasting plasma glucose measurement of 5.0 mmol/L.
Since the glucose tolerance of 28% of the study group was abnormal, the positive predictive value was 56% (95% CI 41%–72%) and the negative predictive value, 89% (95% CI 82%–97%). The likelihood ratios for a positive and a negative test were, respectively, 3.4 (95% CI 2.1–5.4) and 0.3 (95% CI 0.2–0.6). This likelihood ratio for a negative test is still high for a screening test, i.e., above 0.1. Thus, if this strict fasting plasma glucose cutoff were applied, 37% of all women with polycystic ovary syndrome would have a positive result and be required to undergo an oral glucose tolerance test. Among our study subjects, 56% of those with a positive test result actually had diabetes, and 11% of those with a negative result.
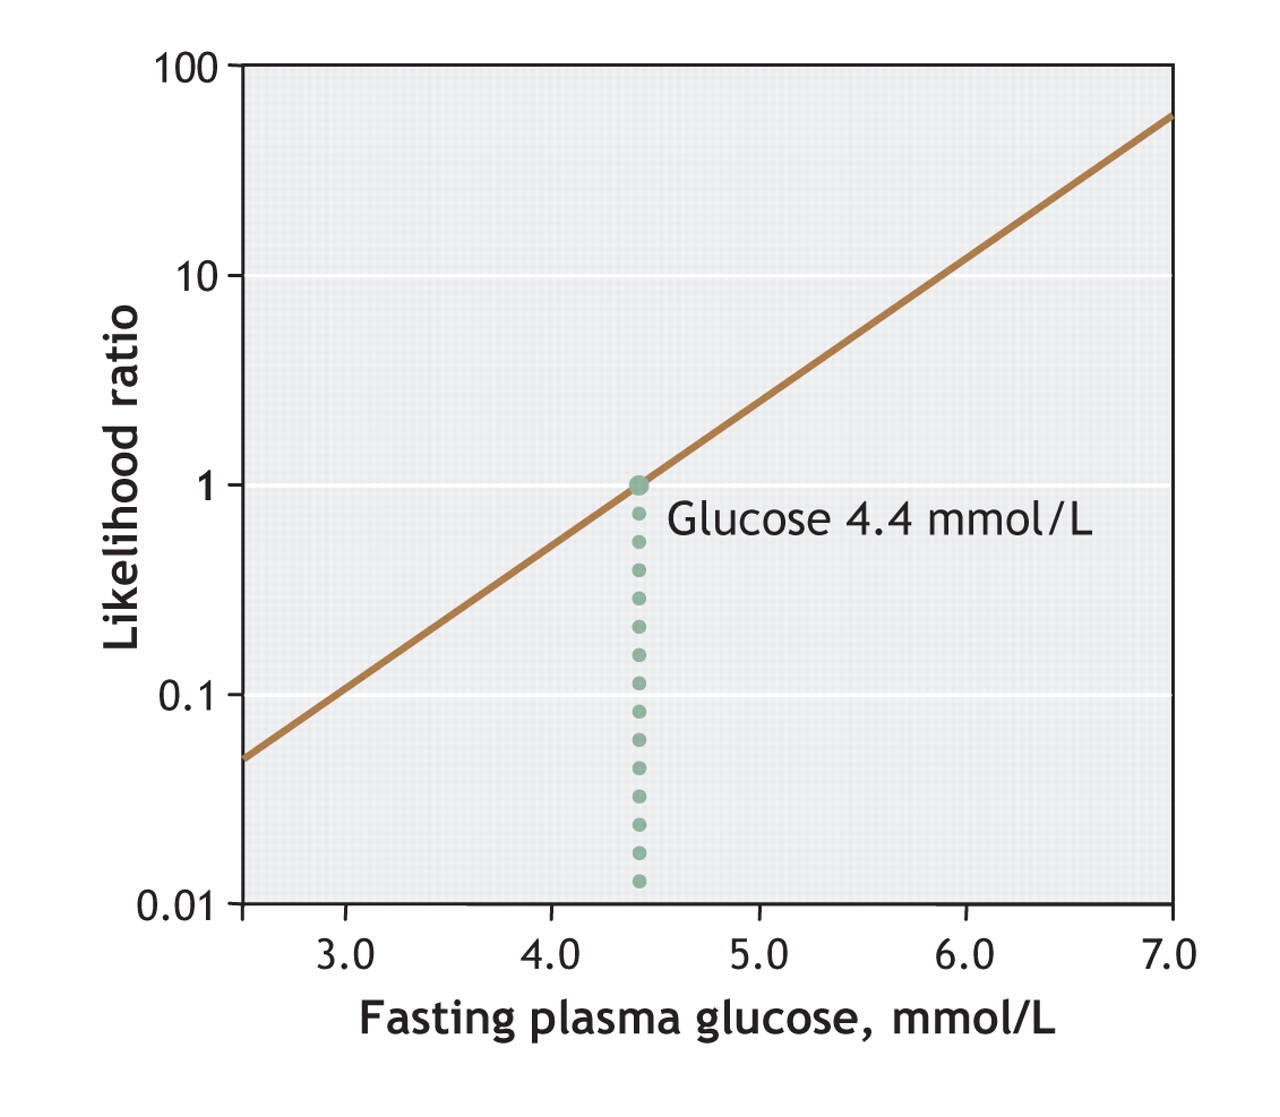
Logarithmic modelling of likelihood ratios as a function of fasting plasma glucose values is shown in Fig. 3 (as recommended by Albert36 and by Sackett and his collaborators33). This figure is useful to determine the likelihood of having abnormal as opposed to normal glucose tolerance, for a specific fasting plasma glucose value. In consideration of the normal distribution of data in both the abnormal and normal glucose tolerance groups, and after adjustment was made for the unequal number of subjects in the 2 groups, a likelihood ratio of 1.0 (the dotted line in Fig. 3) meant that the likelihood of a fasting plasma glucose of 4.4 mmol/L in patients with abnormal glucose tolerance is equal to the likelihood of finding this level among those without abnormal tolerance. Thus, likelihood ratios below 1.0 indicate that likelihoods of having normal glucose tolerance readings are increasingly high. Accordingly, fasting plasma glucose values, to rule out abnormal glucose tolerance, must be very low.

Fig. 3: A logarithmic representation of the likelihood ratio of having abnormal glucose tolerance, as a function of fasting plasma glucose test results. At a glucose concentration of 4.4 mmol/L, the likelihood of finding that test result among patients with abnormal glucose tolerance is equal to its likelihood among those with normal glucose tolerance.
Specifically, a likelihood ratio of 0.1 is found with a fasting plasma glucose result of 3.0 mmol/L; 0.5, with a result of 4.0 mmol/L; 1.0, with a result of 4.4 mmol/L; 2, with a result of 4.8 mmol/L; and 10, with a test result of 5.8 mmol/L.
Interpretation
Our study adds to the cumulating data showing that metabolic abnormalities occur at a young age in women with polycystic ovary syndrome.18,37 The mean age of our study group was 28 years, and impaired glucose metabolism was already manifest in about a quarter of the women. Of importance, the subgroup of women with abnormal glucose tolerance as well as polycystic ovary syndrome manifested more and greater predisposing risk factors for cardiovascular diseases. In fact, they were significantly more obese and hypertensive, and exhibited a more adverse lipid profile and increased hemoglobin A1C measurements than those whose glucose tolerance was in the normal range. Since the rate of conversion from impaired glucose tolerance to type 2 diabetes is accelerated among women with polycystic ovary syndrome,18 the early recognition and treatment of impaired glucose tolerance in such patients is important from an individual and societal perspective. Since women with the syndrome usually consult early for clinical manifestations of hyperandrogenemia or anovulation, clinicians have that opportunity for screening and possibly preventing future development of type 2 diabetes or cardiovascular diseases in this population. This is particularly relevant because effective strategies to prevent type 2 diabetes are available.24,25
The most important quality of a screening test is to be sufficiently sensitive to avoid missing diagnoses. The minimal sensitivity generally recommended for a screening test is therefore 80%.33,34 If the most conservative cutoff value for the results of fasting plasma glucose tests (i.e., 5.6 mmol/L, as recommended by the American Diabetes Association) were used to screen for abnormal glucose tolerance in our group of women with polycystic ovary syndrome, 52% of affected women would have been missed, reflecting the low sensitivity of this test: 48%. Even when using a cutoff of 5.0 mmol/L, the threshold associated the highest possible levels of both sensitivity (76%) and specificity (78%), an unacceptable percentage of glucose-intolerant women remained undiagnosed: 24%. Notably, this limit was similar to the optimal cutoff determined by Palmert and associates26 in adolescent girls with polycystic ovary syndrome: 4.8 mmol/L. In that small study of 27 girls, the sensitivity (78%) and specificity (72%) found were comparable to those in our group; the authors likewise concluded that fasting plasma glucose was not a reliable screening tool for adolescents with polycystic ovary syndrome.26
Furthermore, likelihood ratios modelled for specific fasting plasma glucose values (Fig. 3) reveal that values must be very low to progressively rule out abnormal glucose tolerance in women with polycystic ovary syndrome: only glucose values below 4.4 mmol/L are associated with fasting-plasma-glucose–specific likelihood ratios below 1.0.
Finally, we found that the 2 most important independent predictors of abnormal glucose tolerance were fasting plasma glucose and triglyceride levels. Of note, it was not possible to determine if hemoglobin A1C level is a significant independent predictor of abnormal glucose tolerance because it was measured in only 38% of our subjects. Combining cutoffs for these factors is easily performed in clinical care settings and may actually be a better screening tool than fasting plasma glucose testing. Indeed, restricting oral glucose tolerance tests to women with polycystic ovary syndrome with test results for both fasting plasma glucose of 4.2 mmol/L or more and triglycerides of 1.5 mmol/L or more would avoid more oral glucose tolerance tests (in our case, 38% of the women whose results were positive) with a far better specificity (78%; data not shown). However, these combined criteria should nonetheless be validated in a large group of women with polycystic ovary syndrome before they can be recommended.
Among our 24 nonobese women (BMI ≤ 30 kg/m2) with polycystic ovary syndrome, one had a fasting plasma glucose above 5.6 mmol/L (4.2%) and 3 had abnormal glucose tolerance (12.5%; data not shown). Interestingly, the one woman with a fasting plasma glucose result above 5.6 mmol/L was found to have a normal glucose tolerance (specificity 95%), and all nonobese women whose tolerance was abnormal had a fasting test result under 5.6 mmol/L (zero sensitivity; data not shown). However, extrapolation of our conclusions specifically to nonobese women with polycystic ovary syndrome should be done with caution, in consideration of the lower statistical power of this subgroup analysis. Although a referral bias may have increased the overall prevalence of abnormal glucose tolerance in our study (impaired tolerance 23%, type 2 diabetes 5%), we believe this bias to have been unimportant because the observed prevalence was even lower than those reported in the literature: abnormal glucose tolerance 31%–35%, type 2 diabetes 7.5%–10%.18,19
In conclusion, our results demonstrate that the fasting glucose test is not sufficiently sensitive to be used to screen for abnormal glucose tolerance in women with polycystic ovary syndrome. Moreover, our results directly challenge the fasting plasma glucose cutoffs recommended by the Canadian and American Diabetes Associations to screen people at risk for abnormal glucose tolerance with an oral glucose tolerance test, which are inappropriate for women with polycystic ovary syndrome. Since the oral glucose tolerance test remains the best standardized test to accurately identify abnormal glucose tolerance in this population, we recommend the use of that test to diagnose abnormal glucose tolerance among all women with polycystic ovary syndrome.
@ See related article page 951
Footnotes
-
This article has been peer reviewed.
Contributors: Claudia Gagnon participated in study design, ascertained data quality, reviewed subjects' charts, contributed to the data analyses and drafted the manuscript. Jean-Patrice Baillargeon generated the hypothesis and study objectives, designed the study, extracted test results from the database, analyzed the data and reviewed the manuscript. Both authors approved the final version for publication.
Acknowledgement: Jean-Patrice Baillargeon is a Junior 1 Clinical Investigator of the Fonds de la recherche en santé du Québec (#3158).
Competing interests: None declared.
REFERENCES
In this issue
Article tools


Jump to section
Related Articles
Cited By...
More in this TOC Section
Similar Articles
Collections

