


Article Figures & Tables
Figures
Fig. 1: Relative risks of death from any cause among participants with various risk factors (e.g., history of hypertension, chronic obstructive pulmonary disease [COPD], diabetes, smoking, elevated body mass index [BMI ≥ 30] and high total cholesterol level [TC ≥ 5.70 mmol/L) who achieved an exercise capacity of less than 5 METs (metabolic equivalents) or 5–8 METs, as compared with participants whose exercise capacity was more than 8 METs. Error bars represent 95% confidence intervals. Adapted, with permission, from Myers et al38 (N Engl J Med 2002;346:793-801). Copyright © 2002 Massachusetts Medical Society. All rights reserved.
Fig. 2: Relation between changes in physical fitness and changes in mortality over time. Participants were evaluated at baseline (PF1) and again 13 years later (PF2). The ratio of PF2/PF1 × 100 was calculated to evaluate changes in physical fitness over the study period compared with fitness level at baseline. For this figure, participants were grouped according to fitness quartiles (Q1 = least fit, Q4 = most fit) for the baseline evaluation and to quartiles for change in fitness from baseline to 13-year follow-up (Q1 PF2/PF1 = least change, Q4 PF2/PF1 = most change). Adapted, with permission, from Erikssen et al35 (Lancet 1998;352:759-62).
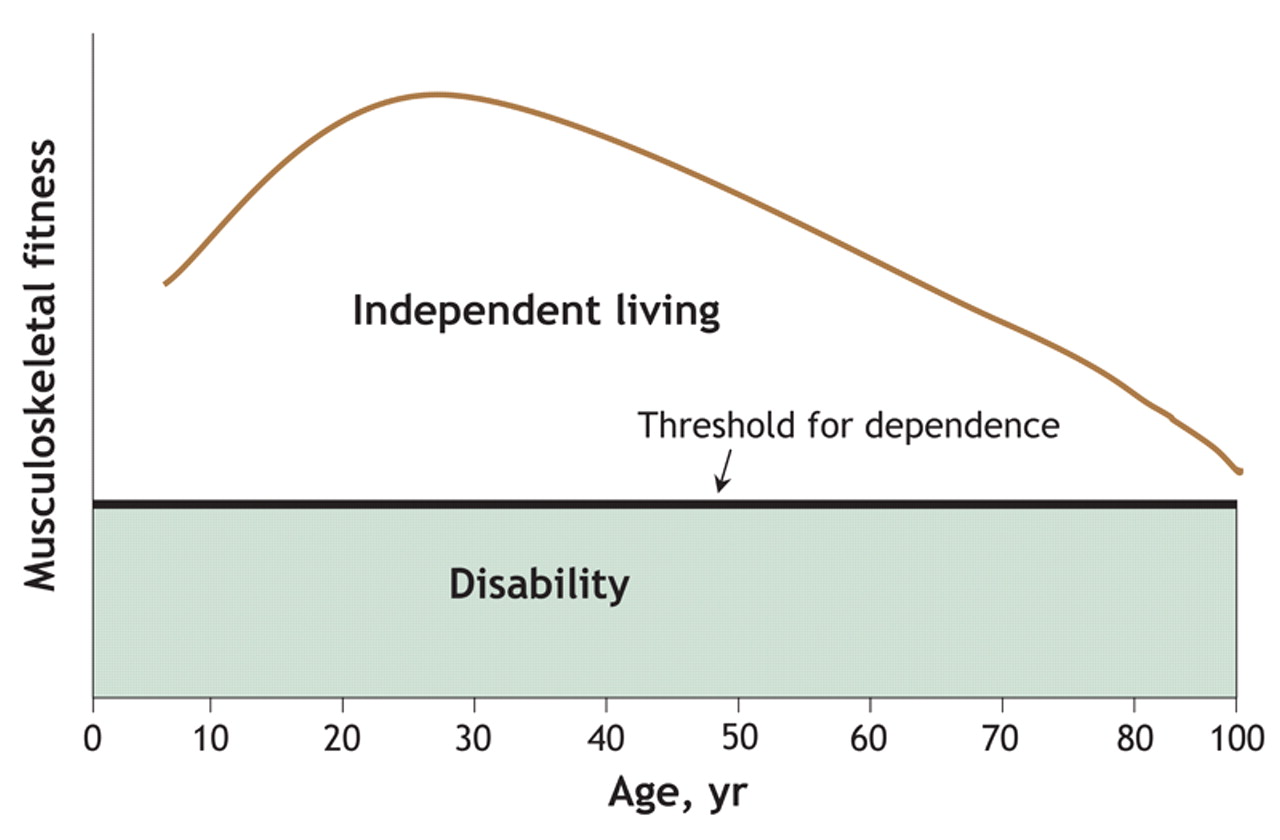
Fig. 3: Theoretical relation between musculoskeletal fitness and independent living across a person's lifespan. As a person ages, his or her musculoskeletal fitness (i.e., muscular strength, muscular endurance, muscular power or flexibility) declines, such that a small impairment may result in disability. Many elderly people currently live near or below the functional threshold for dependence. High levels of (or improvements in) musculoskeletal fitness will enhance the capacity to meet the demands of everyday life and allow a person to maintain functional independence for a greater period.9,10


Tables
Appendix 1.


In this issue

Article tools


Jump to section
- Article
- Abstract
- All-cause and cardiovascular-related death
- Diabetes mellitus
- Cancer
- Osteoporosis
- Physical activity or physical fitness?
- Musculoskeletal fitness: a paradigm shift
- How much physical activity is enough?
- How does physical activity and fitness lead to improved health outcomes?
- Summary
- Appendix 1
- Footnotes
- REFERENCES
- Figures & Tables
- Related Content
- Responses
- Metrics
Related Articles
Cited By...
- TENDINopathy Severity assessment-Achilles (TENDINS-A): evaluation of reliability and validity in accordance with COSMIN recommendations
- Accelerometer-derived physical activity and the risk of death, heart failure, and stroke in patients with atrial fibrillation: a prospective study from UK Biobank
- Evidence based exercise prescriptions in primary care
- Processed food intake assortativity in the personal networks of East European older adults
- Intervention of muscle-building and antifrailty exercise combined with Baduanjin for frailty of different functional levels: study protocol for a randomised controlled trial
- Free to Run: the organisation that uses physical activity to develop female leaders in regions of conflict
- TENDINopathy Severity assessment - Achilles (TENDINS-A): Evaluation of reliability and validity in accordance with COSMIN recommendations
- Association between engagement in cultural activities and use of general practitioner consultations: 7-year follow-up of adults from the HUNT study, Norway.
- Effects of adding exercise to usual care in patients with either hypertension, type 2 diabetes or cardiovascular disease: a systematic review with meta-analysis and trial sequential analysis
- Association between engagement in exercise training and peak cardiac biomarker concentrations following ST-elevation myocardial infarction
- Effects of physical, psychosocial and dual-career loads on injuries and illnesses among elite handball players: protocol of prospective cohort study
- Developing and Validating a Novel Tool to Enhance Functional Status Assessment: The Tennessee Functional Status Questionnaire (TFSQ)
- Promotion of physical activity-related health competence using digital workplace-based health promotion: protocol for a controlled before-and-after study
- Qualitative study of practices and attitudes towards physical activity among prediabetic men and women in urban and rural Malawi
- Proinflammatory Diets and Risk of ESKD in US Adults with CKD
- Socioeconomic inequalities in sport participation: pattern per sport and time trends
- Subjective and Objective Assessment of Physical Activity in Older Adults: Results from Berlin Aging Study II
- Physical activity and its correlates in people with cystic fibrosis: a systematic review
- Association between chronic pain and physical activity in a Swiss population-based cohort: a cross-sectional study
- Physical activity in patients with amyotrophic lateral sclerosis: Prevalence, patients perspectives and relation to the motor performance
- Video-based smartphone app ('VIDEA bewegt) for physical activity support in German adults: a single-armed observational study
- Urine proteomics as a non-invasive approach to monitor exertional rhabdomyolysis during military training
- The potential for bike riding across entire cities: quantifying spatial variation in interest in bike riding
- Social isolation is linked to classical risk factors of Alzheimers disease-related dementias
- Association of physical activity with risk of hepatobiliary diseases in China: a prospective cohort study of 0.5 million people
- Participation and Psychological Capital in Adults With Parkinson's Disease: Mediation Analysis Based on the International Classification of Functioning, Disability, and Health
- Indicators of response to exercise training: a systematic review and meta-analysis
- Comparing the genetic and environmental architecture of blood count, blood biochemistry and urine biochemistry biological ages with machine learning
- Using deep learning to predict age from liver and pancreas magnetic resonance images allows the identification of genetic and non-genetic factors associated with abdominal aging
- An ecosystem service perspective on urban nature, physical activity, and health
- Intraocular pressure fluctuation during resistance exercise
- Promoting physical activity in primary care: a systematic review and meta-analysis
- Analyzing the multidimensionality of biological aging with the tools of deep learning across diverse image-based and physiological indicators yields robust age predictors
- Using financial incentives to increase physical activity among employees as a strategy of workplace health promotion: protocol for a systematic review
- Muscle Strength Explains the Protective Effect of Physical Activity against COVID-19 Hospitalization among Adults aged 50 Years and Older
- Performing arts as a health resource? An umbrella review of the health impacts of music and dance participation
- Female and male US Olympic athletes live 5 years longer than their general population counterparts: a study of 8124 former US Olympians
- Exploring health in the UK Biobank: associations with sociodemographic characteristics, psychosocial factors, lifestyle and environmental exposures
- Body muscle gain and markers of cardiovascular disease susceptibility in young adulthood: prospective cohort study
- Associations between physical activity and trimethylamine N-oxide in those at risk of type 2 diabetes
- Educational differentials in domain specific physical activity by ethnicity, age, and gender: findings from over 44,000 participants in The UK Household Longitudinal Study (2013-2015)
- Barriers and Motivators to Engage in Exercise for Persons with Parkinsons Disease
- Interventions promoting physical activity among adults and children in the six Gulf Cooperation Council countries: protocol for a systematic review
- Is running associated with a lower risk of all-cause, cardiovascular and cancer mortality, and is the more the better? A systematic review and meta-analysis
- Changes in work factors and concurrent changes in leisure time physical activity: a 12-year longitudinal analysis
- Video-based smartphone app ('VIDEA bewegt) for physical activity support in German adults: a study protocol for a single-armed observational study
- Educational differentials in key domains of physical activity by ethnicity, age and sex: a cross-sectional study of over 40 000 participants in the UK household longitudinal study (2013-2015)
- Cost-effectiveness of telephone coaching for physically inactive ambulatory care hospital patients: economic evaluation alongside the Healthy4U randomised controlled trial
- Combined health risks of cigarette smoking and low levels of physical activity: a prospective cohort study in England with 12-year follow-up
- Effects of low-intensity and high-intensity cycling with diesel exhaust exposure on soluble P-selectin, E-selectin, I-CAM-1, VCAM-1 and complete blood count
- Exercise opens a temporal window for enhanced cognitive improvement from subsequent physical activity
- Relationship between cricket participation, health and well-being: scoping review protocol
- Effects of photobiomodulation therapy combined to static magnetic field in strength training and detraining in humans: protocol for a randomised placebo-controlled trial
- Relationship of sociodemographic and lifestyle factors and diet habits with metabolic syndrome (MetS) in a multi-ethnic Asian population
- Health economic assessment of a scenario to promote bicycling as active transport in Stockholm, Sweden
- Mechanical regulation of bone homeostasis through p130Cas-mediated alleviation of NF-{kappa}B activity
- Cost-effectiveness of physical activity interventions in adolescents: model development and illustration using two exemplar interventions
- Process evaluation of team-based care in people aged >65 years with type 2 diabetes mellitus
- Associations between physical activity and cataract treated surgically in patients with diabetes: findings from the 45 and Up Study
- How does exercise treatment compare with antihypertensive medications? A network meta-analysis of 391 randomised controlled trials assessing exercise and medication effects on systolic blood pressure
- Comparison of physical activity and body composition in a cohort of children born extremely preterm or with extremely low birth weight to matched term-born controls: a follow-up study
- Improvement of motor performance in children with cerebral palsy treated with exoskeleton robotic training: A retrospective explorative analysis
- Effects of different types and frequencies of physical activity on the homeostatic model assessment of insulin resistance
- Footballs InfluencE on Lifelong health and Dementia risk (FIELD): protocol for a retrospective cohort study of former professional footballers
- Fight, flight or finished: forced fitness behaviours in Game of Thrones
- Cardiorespiratory fitness predicts greater hippocampal volume and rate of episodic associative learning in older adults
- Does time spent in the residential neighbourhood moderate the relationship between neighbourhood walkability and transport-related walking? a cross-sectional study from Toronto, Canada
- Lifestyle and work ability in a general working population in Norway: a cross-sectional study
- 2018 AHA/ACC Guideline for the Management of Adults With Congenital Heart Disease: A Report of the American College of Cardiology/American Heart Association Task Force on Clinical Practice Guidelines
- 2018 AHA/ACC Guideline for the Management of Adults With Congenital Heart Disease: Executive Summary: A Report of the American College of Cardiology/American Heart Association Task Force on Clinical Practice Guidelines
- A transcript-wide association study in physical activity intervention implicates molecular pathways in chronic disease
- Polygenic risk scores applied to a single cohort reveal pleiotropy among hundreds of human phenotypes
- Impact of first and second eye cataract surgery on physical activity: a prospective study
- Non-communicable disease risk factors: a call for primary care clinicians to act and to refer. Brief intervention, not silent abdication.
- Urban-rural differences in the association between blood lipids and characteristics of the built environment: a systematic review and meta-analysis
- Exercise Is Medicine: Primary Care Counseling on Aerobic Fitness and Muscle Strengthening
- Strength training as superior, dose-dependent and safe prevention of acute and overuse sports injuries: a systematic review, qualitative analysis and meta-analysis
- Distribution of diabetes, hypertension and non-communicable disease risk factors among adults in rural Bangladesh: a cross-sectional survey
- A Population-Based Study of the Bidirectional Association Between Obstructive Sleep Apnea and Type 2 Diabetes in Three Prospective U.S. Cohorts
- Exercise Training for Patients With Hypertrophic Cardiomyopathy: JACC Review Topic of the Week
- Assessment of cardiovascular risk and preparticipation screening protocols in masters athletes: the Masters Athlete Screening Study (MASS): a cross-sectional study
- Associations between sleep quality and its domains and insufficient physical activity in a large sample of Croatian young adults: a cross-sectional study
- Health Benefits of Exercise
More in this TOC Section
Similar Articles

