


Article Figures & Tables
Figures
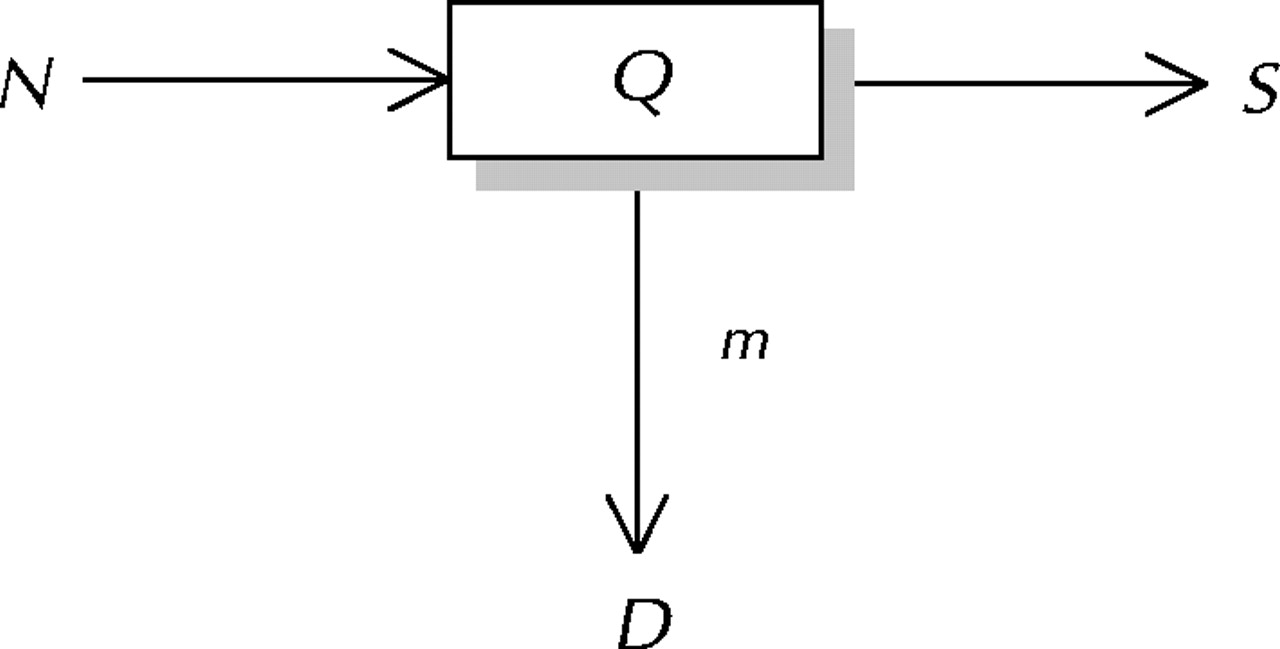
Fig. 1: A compartment model of a waiting list. N = the number of patients accepted for surgery each year, Q = the number waiting for surgery at any given time, S = the number who undergo surgery each year, m = the death rate per person-year among those waiting for surgery, D = the number of deaths each year among those awaiting surgery.

Tables
Table 1.


In this issue

Article tools
Respond to this article


Jump to section
Related Articles
Cited By...
More in this TOC Section
Similar Articles

