


Article Figures & Tables
Figures
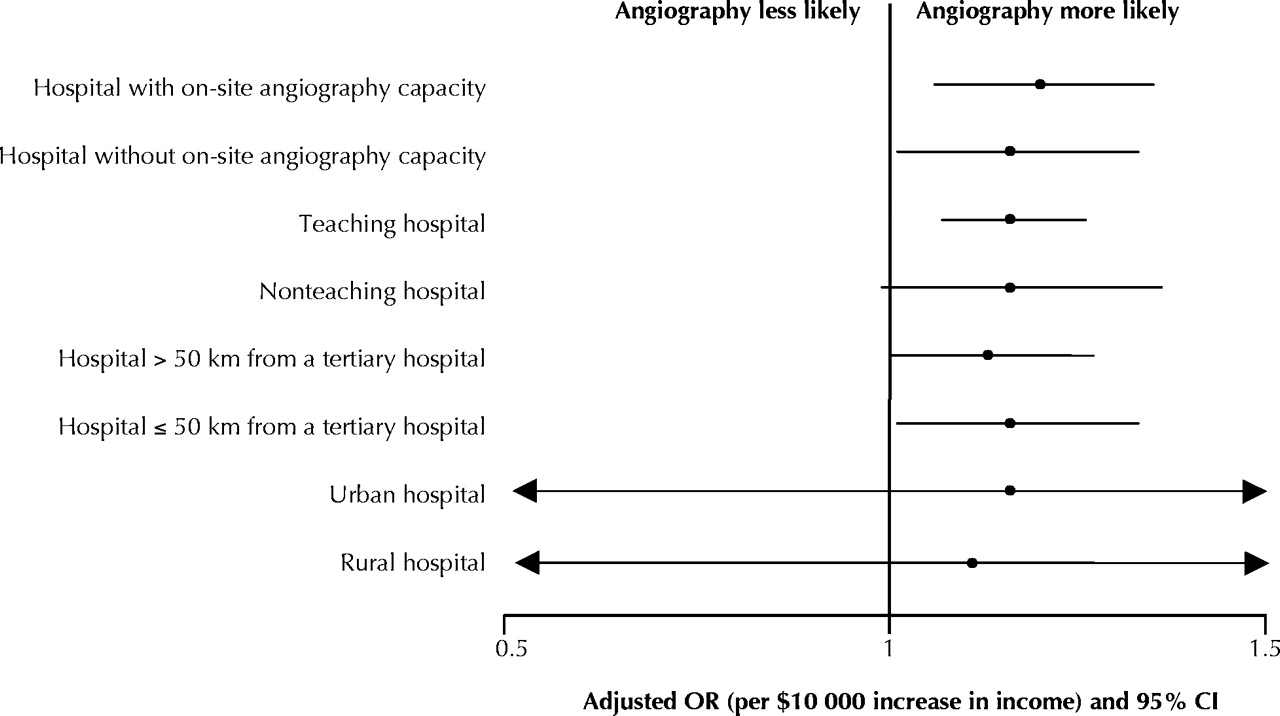
Fig. 1: The relation between neighbourhood income and angiography use within 90 days of acute myocardial infarction in hospitals and regions with different degrees of access to specialized cardiac services. The relative effects of socioeconomic status on angiography use post myocardial infarction are illustrated by the adjusted odds ratio (OR) and 95% confidence interval (CI) for each $10 000 increase in neighbourhood income (derived from 1996 census data), after adjusting for age, sex, cardiogenic shock, congestive heart failure, pulmonary edema, cardiac arrhythmias, diabetes with complications, stroke, malignant disease, acute renal failure, chronic renal failure and the attending physician's specialty. This figure shows, for example, that for 5 of the 8 hospital and geographic subgroups examined, people living in neighbourhoods with a median income of $10 000 more than that of adjacent neighbourhoods were 16% more likely than their poorer neighbours to receive angiography, after adjusting for baseline factors. (This percentage reflects the point estimates for these 5 odds ratios.) The 95% confidence intervals for urban and rural factors are truncated. Tertiary hospitals are defined as those institutions with on-site angiography and revascularization capacity.
Tables
Table 1.

Table 2.


In this issue
Article tools


Jump to section
Related Articles
Cited By...
- Study protocol for a matter of heart: a qualitative study of patient factors driving overuse of cardiac catheterisation
- The Learning Healthcare System and Cardiovascular Care: A Scientific Statement From the American Heart Association
- Building a Foundation to Reduce Health Inequities: Routine Collection of Sociodemographic Data in Primary Care
- Area Median Income and Metropolitan Versus Nonmetropolitan Location of Care for Acute Coronary Syndromes: A Complex Interaction of Social Determinants
- Blind to patients income
- Provision of acute stroke care and associated factors in a multiethnic population: prospective study with the South London Stroke Register
- Ecological Studies and Cardiovascular Outcomes Research
- Avoidable mortality by neighbourhood income in Canada: 25 years after the establishment of universal health insurance
- Income and equity of access to physician services
- Associations of area based deprivation status and individual educational attainment with incidence, treatment, and prognosis of first coronary event in Rome, Italy
- Socioeconomic status and the utilization of diagnostic imaging in an urban setting
More in this TOC Section
Similar Articles
Collections

