


Article Figures & Tables
Figures
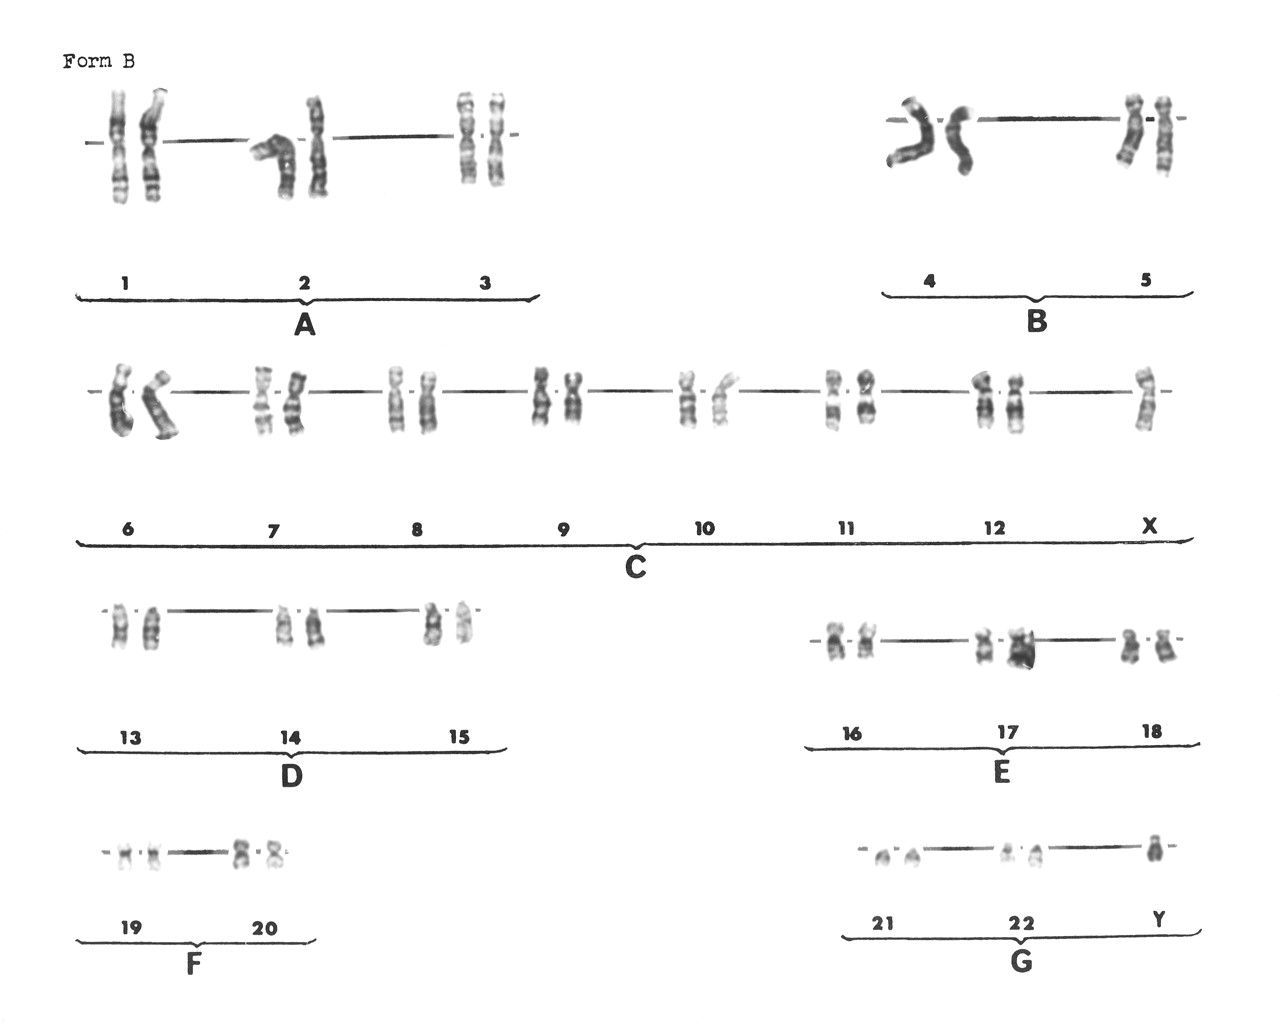
Fig. 1: Standard G-banded karyotype: each chromosome has a characteristic banding pattern, allowing the identification of gross duplications, deletions, additions and translocations. Photo: Eric Wooltorton
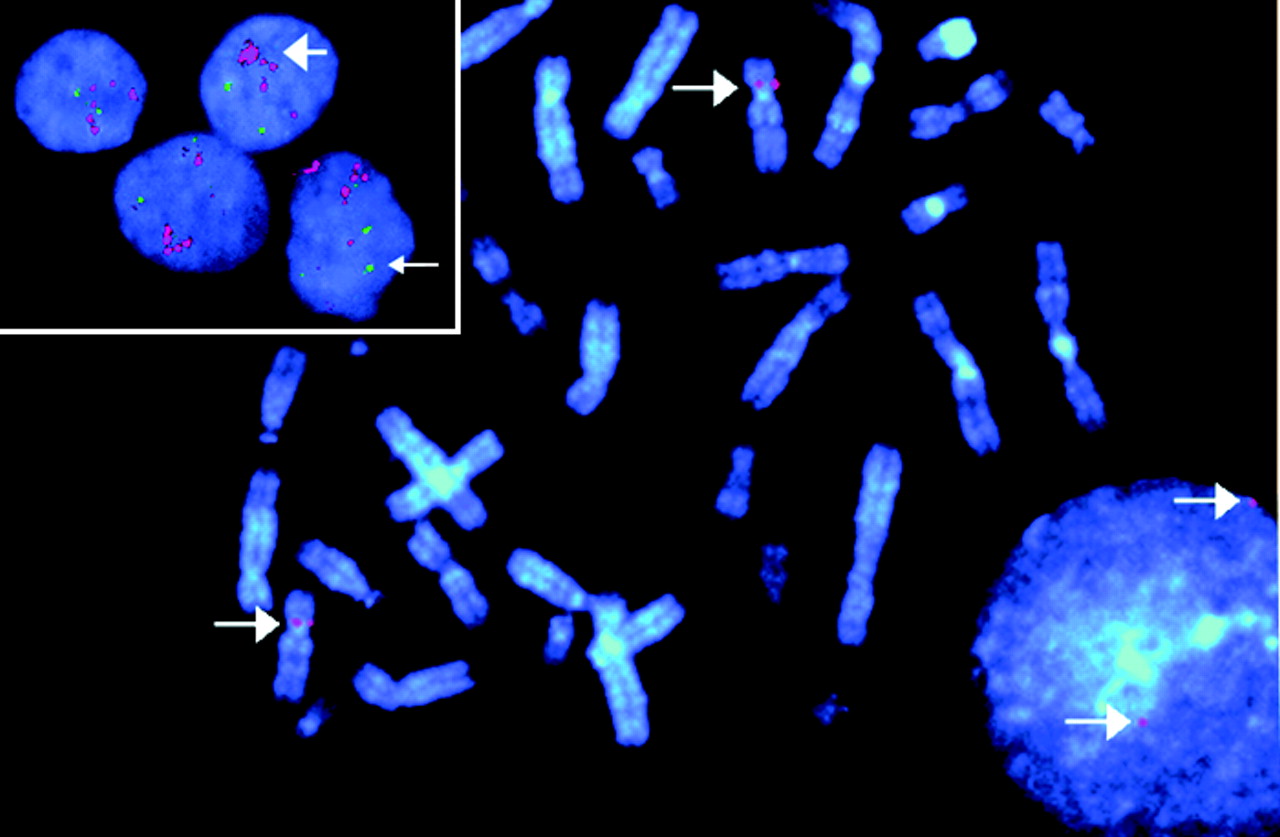
Fig. 2: Visualization of genes using locus-specific FISH probes: red signals (see arrows) hybridized to the chromosomes of a metaphase cell and an adjacent interphase nucleus demonstrate normal numbers of the cyclin D1 gene. Inset: excess copies of the RB1 gene (green) and cyclin D1 gene (red) are demonstrated in human breast cancer cells. Photo: Doug J. Demetrick
In this issue
Article tools
Respond to this article


Jump to section
Related Articles
Cited By...
More in this TOC Section
Similar Articles

