


Article Figures & Tables
Figures
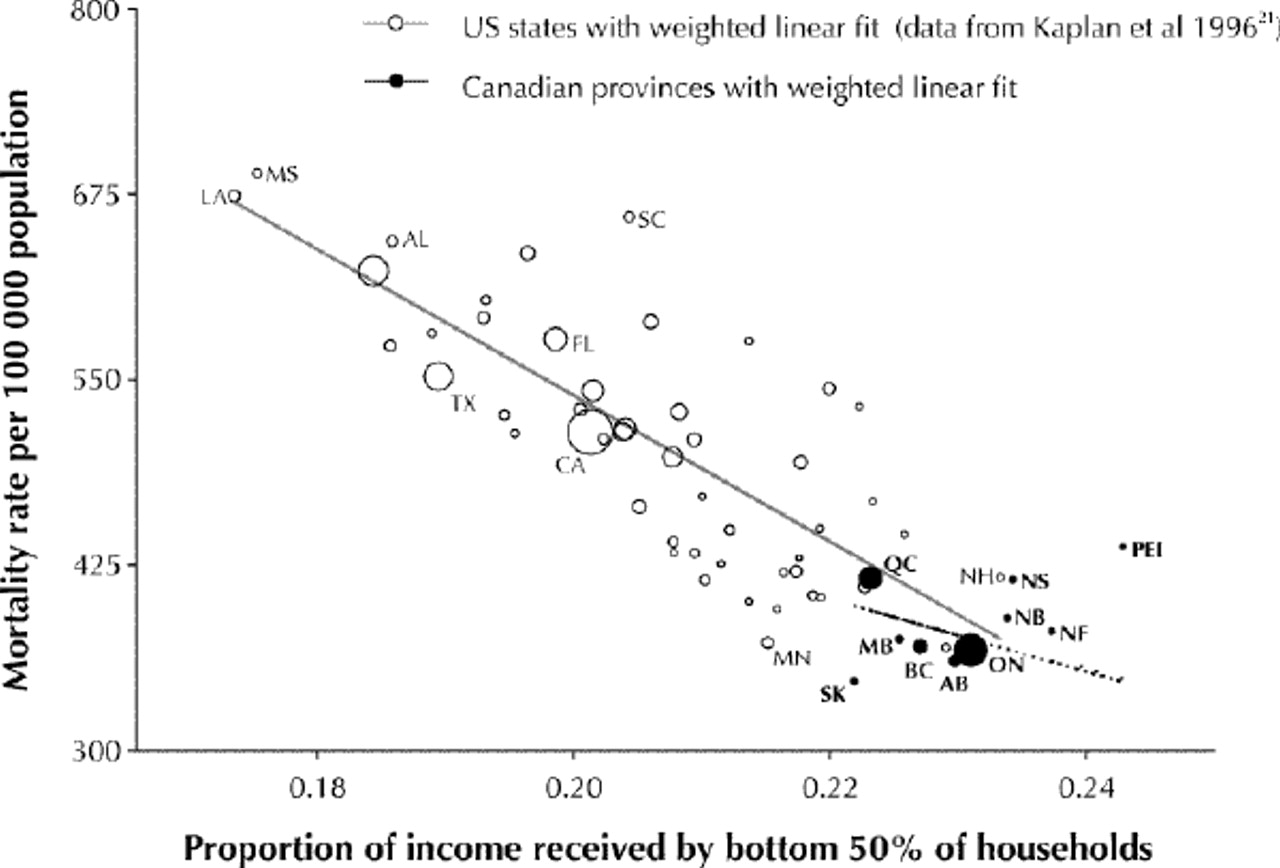
Fig. 1: Relation between mortality rates and income distribution for working-age men (25–64 years of age), for US states and Canadian provinces (indicated by 2-letter postal symbols, with Canadian provinces in boldface). The size of each circle indicates relative population size. Mortality rates were standardized to the Canadian population in 1991. [Adapted, with permission of the BMJ Publishing Group, from Ross and associates,22 BMJ 2000;320(7239):898-902.]
In this issue
Article tools
Respond to this article


Jump to section
Related Articles
Cited By...
More in this TOC Section
Similar Articles

