Article Text

Abstract
Background In the 1990s pneumonia hospitalisation rates in Western Australia (WA) were 13 times higher in Indigenous children than in non-Indigenous children. Rates of invasive pneumococcal disease in Indigenous children declined following the introduction in 2001 of 7-valent pneumococcal conjugate vaccine (7vPCV) in a 2–4–6 month schedule with an 18-month pneumococcal polysaccharide booster (PPV). We investigated population trends for pneumonia hospitalisations between 1996 and 2005.
Methods Population-based retrospective data linkage cohort study of singleton live births from 1996–2005. Hospitalisations for acute lower respiratory infections in Indigenous and non-Indigenous children less than 5 years of age were extracted and trends in age-specific incidence rates were examined using log-linear modelling.
Results From 245 249 births (7.1% Indigenous), there were 7727 pneumonia episodes. Between 1996 and 2000 and 2001 and 2005 all-cause pneumonia hospitalisations fell by 28–44% in Indigenous children aged 6–35 months with no equivalent decline in non-Indigenous children or for other acute lower respiratory infections. Incidence rate ratios for pneumonia comparing Indigenous with non-Indigenous children aged 6–11 months fell from 14.6 (95% CI 12.3 to 17.2) in 1996–2000 to 9.9 (8.4 to 11.6) in 2001–2005. Log-linear modelling showed a steady decline in Indigenous children of 9%/annum (5–12%) at age 12–23 months for all-cause pneumonia and 37%/annum (20–50%) at age 6–11 months for pneumococcal pneumonia from 1996 to 2005, including the years prior to introduction of pneumococcal vaccines.
Conclusions Pneumonia hospitalisations and the disparity between Indigenous and non-Indigenous children has declined by a third. The unique Australian pneumococcal vaccine programme is likely to have had a significant effect but changes in socioeconomic factors have also contributed to the declines.
- Pneumonia
- hospitalisation
- aboriginal
- epidemiology
- children
- pneumococcal vaccines
- aboriginal populations
- children
- epidemiology ME
- hospital SA
- respiratory DI
Statistics from Altmetric.com
- Pneumonia
- hospitalisation
- aboriginal
- epidemiology
- children
- pneumococcal vaccines
- aboriginal populations
- children
- epidemiology ME
- hospital SA
- respiratory DI
Introduction
Pneumonia causes one-fifth of all childhood deaths globally—approximately 2 million per year.1 In recognition of this high burden, the Global Action Plan for the Prevention and Control of Pneumonia (GAPP) has been established to accelerate pneumonia prevention and control.2 In industrialised countries, Indigenous populations suffer a higher burden of pneumonia and have poorer health outcomes compared to non-Indigenous populations.3 4 The disparity between Western Australian (WA) Aboriginal and non-Aboriginal children is unacceptably high with rates of pneumonia in Aboriginal children aged <2 years being 13.5 times higher than in non-Aboriginal children.5
To reduce rates of invasive disease, 7-valent pneumococcal conjugate vaccine (7vPCV) was introduced and funded in Australia from July 2001 for all Aboriginal and Torres Strait Islander children less than 2 years of age and for all children with predisposing medical conditions aged less than 5 years with a unique 2–4–6 month schedule with no 7vPCV booster.6 From January 2005, 7vPCV has been funded for all children less than 2 years of age.6 The coverage of 7vPCV (which is assessed by determining receipt of the third dose at age 12 months) for Aboriginal children in WA has ranged from 47–55% in 2002–2004 (B Hull, personal communication, 2009). In 2005, the coverage of three doses of 7vPCV was 75% for Aboriginal children and 88% for non-Aboriginal children.7 In addition to 7vPCV, Aboriginal children are offered a booster of 23-valent pneumococcal polysaccharide vaccine (23vPPV) at age 18 months,6 but reported coverage in WA is low: 41% in 2004 (B Hull, personal communication, 2009).
Where pneumococcal conjugate vaccination programmes have been introduced, rates of invasive disease have declined8–10 and randomised controlled trials have shown vaccine efficacy against radiologically confirmed pneumonia11–13 and clinical pneumonia.14 However, recently the Northern Territory (NT) has reported an increased risk of acute lower respiratory infection (ALRI) hospitalisation in Indigenous infants following 7vPCV and 23vPPV vaccination.15 In light of this and the limited data on population trends of pneumonia hospitalisation in indigenous populations, an investigation of trends in pneumonia incidence covering the period of introduction of pneumococcal vaccination is warranted.
Previously, we reported declining pneumonia hospitalisation rates in WA between 1990 and 2000 in Aboriginal children aged less than 2 years but increasing rates in non-Aboriginal children.5 Here we extend our previous work and assess population trends for ALRI hospitalisations up to 2005 covering 5 years of 7vPCV and 23vPPV availability for Aboriginal children and limited 7vPCV availability for non-Aboriginal children. We aimed to determine whether pneumonia hospitalisation rates have continued to decline in Aboriginal children and whether there has been a reduction in disparity for pneumonia hospitalisation rates between Aboriginal and non-Aboriginal children.
Methods
Setting and data source
WA covers an area of 2.5 million km2 and in 2008 had a population of 2.2 million16; 3.6% of whom identified as Aboriginal or Torres Strait Islander. The Western Australian Data Linkage System (WADLS) is a unique system that brings together data from numerous population-based administrative and health datasets.17 Using the WADLS, we designed a retrospective cohort study of singleton live births in WA between 1996 and 2005. We extracted data from the Midwives' Notification System, which is complete for more than 99% of births, the birth and death register, and the hospital morbidity database system, which includes all hospital inpatient episodes in the state. We identified births that were of Aboriginal or Torres Strait Islander descent, herein referred to as Aboriginal (since <1% were identified as Torres Strait Islanders), from the Midwives' Notification System reporting the mothers' Indigenous status, and the birth register and hospital morbidity database system reporting the child's Indigenous status. This study was approved by the Princess Margaret Hospital for Children Ethics Committee, the Confidentiality and Health Information Committee and the Western Australian Aboriginal Health Information and Ethics Committee.
Definition of ALRI admissions
We identified hospital admissions between 1996 and 2005 with an ALRI diagnosis code from the principal diagnosis field and 20 additional diagnosis fields. The Australian version of the International Classification of Diseases (ICD) 9th revision was used until 1999 when the 10th version (ICD-10 AM) was introduced. Using a Perl programme and the mapping tables provided by the Australian National Centre for Classification in Health, all ICD9 codes were forward mapped into ICD10 codes to standardise and compare across all years. Inter-hospital transfers were merged into a single hospital admission. ALRI admissions within 14 days of a previous ALRI admission were classified as a single episode. A hierarchical diagnosis algorithm was developed using the principal diagnosis (first-listed diagnosis) and 20 secondary diagnoses ranking ALRI episodes in the following order of disease severity: whooping cough, pneumonia, bronchiolitis, influenza, unspecified ALRI and bronchitis. An episode was coded as pneumonia regardless of any other diagnoses unless any one of the diagnoses was whooping cough. Using this hierarchical diagnosis algorithm, we classified ALRI episodes into all-cause pneumonia (ICD10 codes J12-J18, B59, B05.2, B37.1, B01.2), bronchiolitis (J21), and all other ALRIs comprising coding as whooping cough (A37), influenza (J10-J11), bronchitis (J20) and unspecified ALRI (J22). Pneumococcal pneumonia episodes were a subset of the all-cause pneumonia episodes and were identified if any one of the diagnosis fields was ICD10 code J13.
Statistical analysis
Using person-time-at-risk for the relevant time period and age group, we calculated annual age-specific incidence rates of ALRI episodes per 1000 child-years. We compared the incidence rate ratio (IRR) of the Aboriginal to the non-Aboriginal rate for different diagnoses and different age groups between the period before 7vPCV (1996–2000) and the period after 7vPCV became available for Aboriginal children and for non-Aboriginal children at high risk of invasive disease (2001–2005). IRRs are presented with 95% CIs. To examine whether IRRs were different between the two time periods, p values testing that the ratio of IRRs is different to 1 were calculated and presented. The year-to-year trends in incidence were analysed by log-linear modelling using negative binomial regression with nbreg in Stata. We report on the percentage change per year with 95% CI and graphically present the data as log-transformed rates. If annual numbers of hospitalisations were small, rates are graphically presented as 3-year moving averages where the incidence for a specific year is calculated as the mean for that year and the preceding and succeeding years. In view of the cohort study design not all years could be included in the trend analysis. For example, in the 48–59 month age group, only data from 2000–2005 were available for analysis as this represented the years for which children in this age group were at risk for hospitalisation. To test whether the population-based trends of pneumonia were influenced by 7vPCV introduction for Aboriginal children in 2001, we conducted further interrupted linear time trend models and graphically present the fitted trends from these models. Data checking and editing was completed using SPSS version 15.0 and analysis was conducted using Stata version 10.
Results
There were 245 249 births between 1996 and 2005, 7.1% of which were Aboriginal, giving rise to a total of 1 219 082 child-years-at-risk (1 134 516 non-Aboriginal child-years and 84 566 Aboriginal child-years). There were 26 106 hospital episodes of ALRI between 1996 and 2005 of which 7727 (29.6%) were coded as pneumonia. Pneumonia rates were highest for Aboriginal children at age 6–11 months (71.7/1000 child-years) and for non-Aboriginal children at age 12–23 months (8.4/1000 child-years). There were 78 ALRI-coded deaths in the birth cohort between 1996 and 2005, 70 of which were recorded as pneumonia (46 non-Aboriginal and 24 Aboriginal).
Comparing the periods before (1996–2000) and after (2001–2005) introduction of 7vPCV for Aboriginal children, all-cause pneumonia hospitalisation rates fell in Aboriginal children at all ages but most notably by 34% at age 12–23 months and by 44% at age 24–35 months with the only declines in non-Aboriginal children being in those aged less than 1 month (table 1). The IRR of Aboriginal to non-Aboriginal children for all-cause pneumonia declined between 1996–2000 and 2001–2005 in all age groups older than 6 months (table 1). For children aged 6–11 months, the incidence rate for pneumonia was 14.6 (95% CI 12.3 to 17.2) times higher in Aboriginal children (85/1000 child-years) than in non-Aboriginal children (6/1000 child-years) in 1996–2000; the IRR reduced to 9.9 (95% CI 8.4 to 11.6) in 2001–2005. Similarly for children aged 12–23 months, the IRR reduced from 7.7 in 1996–2000 to 4.9 in 2001–2005 (table 1). These were significant declines in disparity (p<0.001). Pneumococcal pneumonia was coded in 222 (2.9%) of the pneumonia episodes (141 non-Aboriginal and 81 Aboriginal episodes). Hospitalisation rates for pneumococcal pneumonia in 1996–2000 were 15.6 times higher in Aboriginal than non-Aboriginal children aged 6–11 months; the IRR reduced to 1.3 in 2001–2005. Apart from a decline in disparity for bronchiolitis in those aged 6–11 months (p=0.003), there was no significant decline in disparity in incidence of bronchiolitis or other ALRIs over the two time periods (table 1).
Hospitalisation rates and rate ratios for all-cause pneumonia, bronchiolitis and other acute lower respiratory infections (ALRIs) in Aboriginal and non-Aboriginal children in the period 1996–2000 and 2001–2005
We used log-linear modelling to investigate the annual changes in incidence from 1996–2005. The annual incidence of all-cause pneumonia declined in Aboriginal and non-Aboriginal children in all age groups with Aboriginal children experiencing the largest declines (figure 1). Annual percentage changes per year for each age group are shown in table 2. The largest annual declines were seen in Aboriginal children aged 24–35 months (12.6%/annum) and those aged 48–59 months (17.1%/annum). Further analyses using interrupted time trend models were able to test whether there was a difference in the log-linear time trend between the pre and post 2001 periods and also whether there was an additional step change in 2001 corresponding to introduction of 7vPCV vaccination. The annual reduction in pneumonia rates for Aboriginal children was not statistically different in the pre and post 2001 periods for both 6–11 (p=0.49) and 12–23 (p=0.75) month age groups, but there was an additional non-significant reduction in rates in 2001 for both groups (figure 1).

Annual age-specific incidence rates for all-cause pneumonia in non-Aboriginal and Aboriginal children, 1996–2005. Fitted trend lines for the interrupted time series models are shown by the bold grey line for Aboriginal children in the 6–11 month and 12–23 month age group.
Trend estimates for all-cause pneumonia, pneumococcal pneumonia, bronchiolitis and other acute lower respiratory infection (ALRIs), 1996–2005, by age group and Aboriginality
All-cause pneumonia rates declined in non-Aboriginal children aged less than 6 months at a similar rate to Aboriginal children of the same age (table 2). Declines in other age groups were much less in non-Aboriginal children compared to Aboriginal children and did not reach statistical significance except at age 48–59 months where there was an estimated decline of 12.8% per year. The incidence of pneumococcal pneumonia declined in Aboriginal and non-Aboriginal children of all ages with significant declines in Aboriginal children of 37.0% per year in those aged 6–11 months and 26.6% per year in those aged 12–23 months (figure 2 and table 2).

Smoothed (3-year moving average) age-specific incidence rates for pneumococcal pneumonia in non-Aboriginal and Aboriginal children, 1996–2005. Note: not enough data to calculate trend line for Aboriginal children 48–59 months.
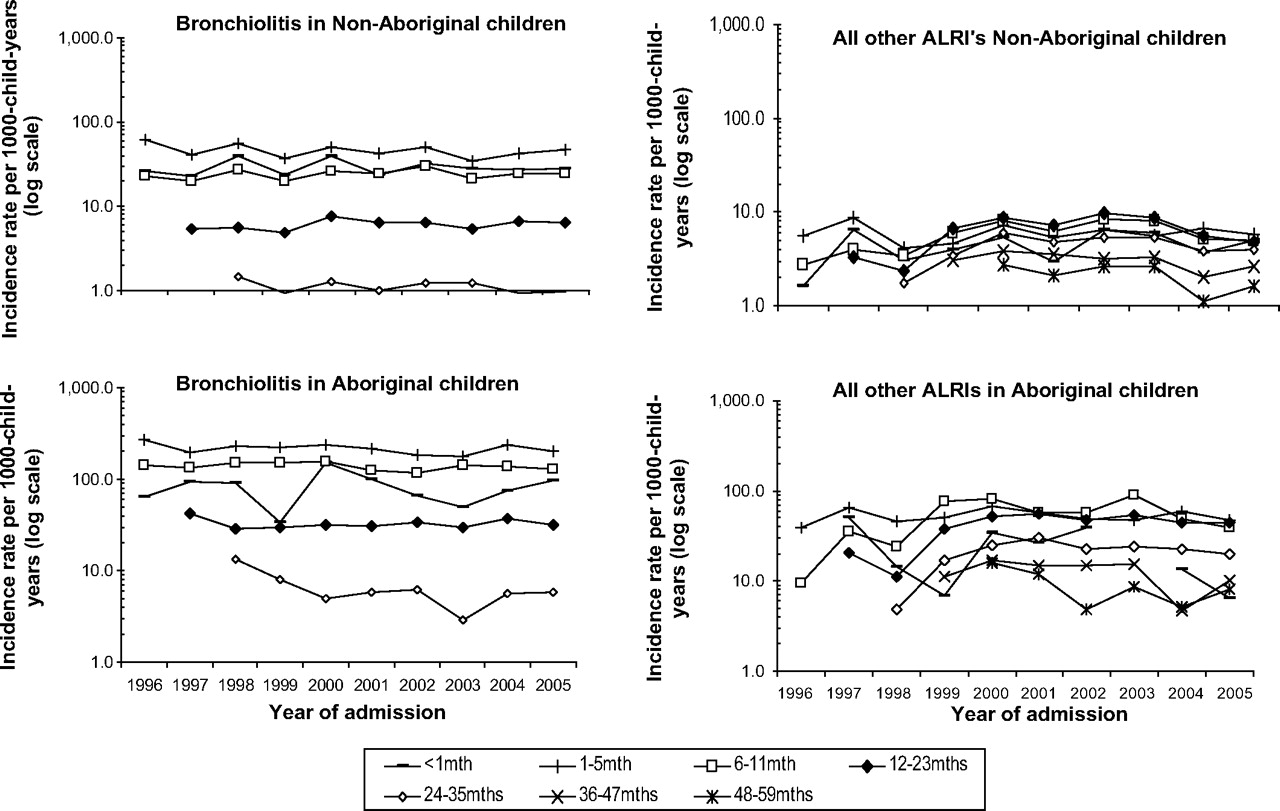
There were no significant changes in trend for bronchiolitis over the same time period in either Aboriginal or non-Aboriginal children (figure 3), except for a decline in Aboriginal children aged 24–35 months of 10.1% per year (table 2), although the rates for bronchiolitis are considerably lower in older children than younger children (table 1). There was no consistent trend in incidence of other ALRIs comprising whooping cough, influenza, bronchitis and unspecified ALRI (figure 3). There were declines in Aboriginal and non-Aboriginal children aged 48–59 months, but incidence of other ALRIs increased by 11.5% per year in Aboriginal children aged 12–23 months (table 2). Trends in annual incidence for all-cause pneumonia and bronchiolitis were similar across metropolitan, rural and remote regions of WA (data not shown).
Annual age-specific incidence rates for bronchiolitis and all other acute lower respiratory infections (ALRIs—whooping cough, influenza, bronchitis, unspecified ALRI) in non-Aboriginal and Aboriginal children, 1996–2005.
Discussion
We have seen a decline in all-cause pneumonia and pneumococcal pneumonia hospitalisations in WA children particularly in the Aboriginal population. This has resulted in a decline in disparity between Aboriginal and non-Aboriginal children for pneumonia in the range of 32–36%; a positive step towards closing the gap in Indigenous health18,19 and reducing the burden of pneumonia. Although the declines in our study are slightly smaller, our findings are consistent with studies from the northern hemisphere that have reported declines for pneumonia hospitalisations in the range of 13–53% and declines for pneumococcal pneumonia hospitalisations in the range of 65–72% in the pre and post-pneumococcal vaccination period.20–22 We have not seen consistent declines, or increases, for bronchiolitis and other ALRIs, and shifts in clinical diagnosis are unlikely to be responsible for observed population trends in pneumonia hospitalisation. The likely explanations for the decline in pneumonia are multifactorial, including gradual improvements in Aboriginal health and socioeconomic indicators, the Australian pneumococcal vaccination programme and the management of pneumonia at a primary healthcare level.
In contrast to NT,15 we have not seen any evidence of a deleterious effect of pneumococcal vaccination on ALRI hospitalisation rates in our population-based study of 245 249 births. The increases in pneumonia in non-Aboriginal children that we reported previously5 have now levelled off and we note significant declines in Aboriginal children whereas O'Grady reported a 55% increased risk of pneumonia in Indigenous infants aged 5–23 months following 23vPPV vaccination and 33% increase after two doses of 7vPCV compared to no dose.15 There are important methodological differences between the NT and our current study. That study had access to individual immunisation data to link with hospitalisation data, whereas we have not yet obtained individual immunisation data. O'Grady et al sought to examine the effectiveness of the three-dose 7vPCV plus 23vPPV booster schedule in Indigenous infants whereas our ecological study investigated population-based trends in incidence in all WA children. The population structure differs between NT and WA: 44% of the population aged less than 5 years in NT are Indigenous compared to 6% in WA23 24 so it is plausible to suggest that the impact of a vaccination programme could differ between the two areas. Other Australian studies have reported declines in pneumonia in Indigenous children across four Australian states and territories and attributed the declines to 7vPCV vaccination25 and, now in non-Indigenous children, declines in pneumonia after the introduction of the universal 7vPCV programme in 2005.26
It is thought that hospitalisations coded as pneumococcal pneumonia do not represent all hospitalisations for pneumonia due to Streptococcus pneumoniae. Three per cent of pneumonia admissions in our study were coded as due to S pneumoniae, which is similar to a large study in the USA that identified 2% of pneumonia admissions in children aged less than 2 years as pneumococcal pneumonia.20 Therefore, some declines seen in all-cause pneumonia are likely to be a result of declines in pneumonia due to S pneumoniae and represent the positive impact of Australia's unique pneumococcal vaccination programme. Moreover, we have recently shown significant declines in the incidence of invasive pneumococcal disease in WA Aboriginal and non-Aboriginal children from 1997–2007 with declines in invasive disease due to 7vPCV serotypes—notably by 94% in Aboriginal children and by 86% in non-Aboriginal children.9
We are reluctant to attribute the decline in pneumonia seen in WA solely to a beneficial impact of pneumococcal vaccination since we observed declines in pneumonia prior to 2001 in the Aboriginal population as well as some declines in the non-Aboriginal population for whom 7vPCV was not universally funded until 2005. This highlights the importance of investigating annual changes in incidence in addition to a pre and post-vaccination comparison and suggests that there must be other factors playing a role. First, these trends could be due to the natural fluctuations of disease. Second, there is likely to have been increases in out-of-hospital (or emergency department) treatment for pneumonia. Third, while improvements in general living and socioeconomic status tend to occur slowly, there is evidence to suggest that lifestyle factors, such as education, income, treatment of water supplies and household crowding, have improved in the WA Aboriginal population between 1996 and 200427 covering the years of our observed trends. These improvements could have contributed to the observed declines in hospitalisations with pneumonia. It is unlikely that the changes in trend represent a change in Aboriginal identification or changes in coding from ICD9 to ICD10.
The WADLS provided us with the opportunity to use total population-based linked data to calculate accurate hospitalisation rates per population at risk and assess population trends. These trends are not overshadowed by complex analyses. We have complete data on Indigenous status allowing us to compare trends between Aboriginal and non-Aboriginal children, whereas other studies have not had adequate data on ethnicity.20 This adds to the strengths of our study. However, there are some limitations. We do not have individual immunisation data and the reported estimates of 7vPCV coverage during the study period are low. As there are many bacteria and viruses that cause pneumonia, the lack of pathogen-specific diagnoses limits our ability to quantify the contribution of pneumococcal vaccines to declines in pneumonia hospitalisation. In view of this aetiological diversity, the impact of currently available vaccines alone on overall burden of pneumonia will be limited2 and other aetiological agents of pneumonia need to be investigated. We have started the process of linking statewide pathology data into the WADLS to further investigate trends on laboratory-confirmed outcomes. It is important that researchers are able to access individualised immunisation data through established data linkage mechanisms not only to evaluate impact of vaccination on disease burden and vaccine effectiveness but also for adverse event surveillance.
The decreasing disparity in pneumonia hospitalisations between Aboriginal and non-Aboriginal children has relevance for the developing world and countries with disadvantaged indigenous populations as the ultimate goal is to close the gap in health inequities between disadvantaged and more privileged children. Other non-pharmaceutical interventions, such as improved family and community hygiene (ie, hand washing), and provision of adequate housing3 are needed to close the gap further.
In summary, we have seen a reduction in hospitalisation for severe respiratory infection in children, an encouraging finding and important in the context of the GAPP, which aims to accelerate pneumonia prevention and control, as Indigenous children in Australia have previously had one of the highest hospitalisation rates for pneumonia in the developed world. Part of this reduction is likely to be due to the unique Australian pneumococcal vaccine schedule, but other factors are also likely to have contributed to this decline. It is important to continue monitoring population-based trends of pneumonia in Australian and other high risk or indigenous populations to fully understand the impact of pneumococcal vaccination and other public health interventions.
What is already known on this subject
Pneumonia is a leading cause of paediatric morbidity and since the introduction of pneumococcal vaccines there has been a reduction in all-cause pneumonia in children.
In Western Australia in the 1990s pneumonia hospitalisation rates were 13 times higher in Indigenous than non-Indigenous children.
What this study adds
All-cause pneumonia rates fell 28–44% in Aboriginal children for whom a pneumococcal conjugate vaccine was available for 4 years prior to a nationwide programme.
The disparity between Aboriginal and non-Aboriginal children for pneumonia hospitalisations has declined by a third.
The unique pneumococcal vaccine schedule in Australia is likely to have had an impact but improvements in socio-economic indicators may also have contributed.
It is important to continue monitoring population-based trends of pneumonia in other high risk or indigenous populations to fully understand the impact of pneumococcal vaccination and other public health interventions.
Acknowledgments
The authors would like to thank Kim Carter at the Telethon Institute for Child Health Research for writing the programme to forward map the ICD codes and Di Rosman and Carol Garfield on behalf of the Western Australian Data Linkage Branch for their assistance in our application to extract data from the Western Australian Data Linkage System.
References
Footnotes
Funding HM, DL and PJ are funded through the National Health and Medical Research Council Project Grant #572590.
Competing interests Moore received support for conference attendance from Wyeth Australia. Richmond has received research funding from GlaxoSmithKline and served on advisory boards for Wyeth and CSL. Lehmann is a member of the GSK Australia Pneumococal-Haemophilus influenzae-Protein D conjugate vaccine (‘Phid-CV’) Advisory Panel.
Ethics approval This study was conducted with the approval of the Princess Margaret Hospital for Children Ethics Committee, the Confidentiality and Health Information Committee and the Western Australian Aboriginal Health Information and Ethics Committee.
Provenance and peer review Not commissioned; externally peer reviewed.