Cross sectional longitudinal study of spot morning urine protein:creatinine ratio, 24 hour urine protein excretion rate, glomerular filtration rate, and end stage renal failure in chronic renal disease in patients without diabetes
BMJ 1998; 316 doi: https://doi.org/10.1136/bmj.316.7130.504 (Published 14 February 1998) Cite this as: BMJ 1998;316:504
- Piero Ruggenenti, doctor (ruggenenti{at}irfmn.mnegri.it)a,
- Flavio Gaspari, chemista,
- Annalisa Perna, statistical scientista,
- Giuseppe Remuzzi, directora
- a Mario Negri Institute for Pharmacological Research, Clinical Research Centre for Rare Diseases, Via Gavazzeni 11, 24125 Bergamo, Italy
- Correspondence to: Dr Ruggenenti
- Accepted 27 November 1997
abstract
Objective: To evaluate whether the protein:creatinine ratio in spot morning urine samples is a reliable indicator of 24 hour urinary protein excretion and predicts the rate of decline of glomerular filtration rate and progression to end stage renal failure in non-diabetic patients with chronic nephropathy.
Design: Cross sectional correlation between the ratio and urinary protein excretion rate. Univariate and multivariate analysis of baseline predictors, including the ratio and 24 hour urinary protein, of decline in glomerular filtration rate and end stage renal failure in the long term.
Setting: Research centre in Italy.
Subjects: 177 non-diabetic outpatients with chronic renal disease screened for participation in the ramipril efficacy in nephropathy study.
Main outcome measures: Rate of decline in filtration rate evaluated by repeated measurements of unlabelled iohexol plasma clearance and rate of progression to renal failure.
Results: Protein:creatinine ratio was significantly correlated with absolute and log transformed 24 hour urinary protein values (P=0.0001 and P<0.0001, respectively.) Ratios also had high predictive value for rate of decline of the glomerular filtration rate (univariate P=0.0003, multivariate P=0.004) and end stage renal failure (P=0.002 and P=0.04). Baseline protein:creatinine ratios and rate of decline of the glomerular filtration rate were also significantly correlated (P<0.0005). In the lowest third of the protein:creatinine ratio (<1.7) there was 3% renal failure compared with 21.2% in the highest third (>2.7) (P<0.05).
Conclusions: Protein:creatinine ratio in spot morning urine samples is a precise indicator of proteinuria and a reliable predictor of progression of disease in non-diabetic patients with chronic nephropathies and represents a simple and inexpensive procedure in establishing severity of renal disease and prognosis.
Key messages
The protein:creatinine ratio measured in spot morning urine samples is a simple and reliable indicator of 24 hour urinary protein excretion rate and can therefore be used to quantify proteinuria without the need for timed urine collection
Spot morning urinary protein:creatinine ratio is the strongest baseline predictor of progression of renal disease in non-diabetic patients with chronic nephropathies
Compared with 24 hour urinary protein excretion rate, the spot morning ratio is an even more reliable predictor of decline in glomerular filtration rate and progression to end stage renal failure and represents a simple and inexpensive procedure in the determination of severity of renal disease and prognosis
Introduction
The measurement of proteinuria may help to establish a diagnosis and predict the outcome of most renal diseases1 2 but requires the measurement of concentration in timed urine collections. Twenty four hour collections are commonly used to smooth the wide fluctuations in proteinuria over the day3 but are time consuming and often imprecise. An alternative approach avoiding timed urine collections is the measurement of the protein:creatinine ratio in single random urine specimens.4 5 6 7 8 In insulin dependent diabetic patients with nephropathy the protein:creatinine ratio correlates with 24 hour urinary protein excretion rate.9 Whether the ratio also correlates with the excretion rate in non-diabetic patients with renal disease, however, has not been established. An additional unresolved question in both diabetic and non-diabetic patients with chronic nephropathies is whether the ratio, by preventing the errors related to imprecise urine collections, may predict the progression of chronic renal disease over time even more reliably than 24 hour proteinuria.
We used a cross sectional design to determine whether the protein:creatinine ratio is a reliable indicator of 24 hour urinary protein excretion rate in non-diabetic patients with proteinuria and chronic renal disease. We then investigated and compared the reliability of this ratio and 24 hour proteinuria in predicting the progression of renal disease in the long term.
Patients_and_methods
Patients
One hundred and seventy seven patients with non-diabetic chronic renal disease and persistent clinical proteinuria were referred to this clinic for evaluation of their eligibility to a multicentre clinical trial to evaluate the efficacy of ramipril in the treatment of nephropathy.10 11 All these patients provided spot morning and timed urine collections and entered the cross sectional phase of the study. Of the 177 screened patients, 98 satisfied the inclusion criteria of the study (creatinine clearance 20–70 ml/min/1.73 m2 and urinary protein excretion rate persistently >1 g/24 hours for at least 3 months with no evidence of overt heart failure or urinary tract infection) and were enrolled in the ramipril trial. All these patients were therefore followed prospectively and entered the longitudinal phase of the present study. The main baseline characteristics of the 98 patients considered here are shown in table 1 and did not differ significantly from those of the whole population of the trial.11
Baseline characteristics overall and according to thirds of spot morning urine protein:creatinine ratio for 98 patients with chronic renal insufficiency and clinical proteinuria. Numbers are means (SD) unless stated otherwise
Urine specimens
A 24 hour urine collection was undertaken by 177 outpatients the day before the scheduled clinic visit. All the subjects were instructed to begin the 24 hour collection immediately after completion of the first voiding in the morning and to collect all urine for 24 hours, including the final void at the completion of the 24 hour period. Specimens from 24 hour urine collections and from untimed morning urine collections were then obtained in the clinic for the measurement of protein and creatinine concentration.
Follow up
The 98 patients entering the ramipril trial were a priori stratified for baseline urinary protein excretion rate <3 or >3 g/24 hours10 11 and were then randomly allocated (on a 1:1 basis) to 5 year treatment with the angiotensin converting enzyme inhibitor ramipril (1.25 to 5.0 mg/day) or with matched placebo plus an alternative treatment as deemed appropriate to achieve and maintain diastolic blood pressure <90 mm Hg.10 11 Each patient was examined by a physician at baseline, every month during the first 3 months, and every 3 months thereafter. At each examination blood pressure and heart rate were measured with the patient in the sitting position in the morning and before the ingestion of the study drugs. Serum creatinine and electrolyte concentrations were assessed as were other serum biochemicals (uric acid, glucose, cholesterol, triglycerides, liver enzymes, and bilirubin). A complete blood count was done and 24 hour urine protein, sodium, and urea excretion measured. At baseline and at 1, 3, and 6 months after randomisation then every 6 months the glomerular filtration rate was determined centrally, at the Mario Negri Institute, by the plasma clearance of non-radioactive iohexol.12 Serum creatinine concentration was measured every 3 months by standard procedures.
Laboratory methods
Urine specimens for creatinine and protein measurements were frozen at −20°C until analysis was performed. Creatinine concentration (mg/dl) was determined on a Beckman Creatinine Analyzer II (Brea, California) with the modified Jaffe rate method. Protein concentration (mg/dl) was determined with a Synchron CX5 Beckman Analyzer. The urine protein:creatinine ratio was obtained by dividing the urinary protein concentration by the urine creatinine concentration (as this results in a ratio rather than an absolute number SI units have not been used).
Statistical analysis
To evaluate the relation between spot morning urine in all the 177 screened patients a single slope linear model determined by the least squares method was used. A logarithmic transformation of the data was done before linear regression analysis to correct the non-constant variability of the observed points around the regression line.
The 98 patients entering the ramipril trial who had at least three measurements of glomerular filtration rate (including baseline) were divided a posterior into three groups with lowest, middle, or highest baseline values of spot morning urine protein:creatinine ratio. Thus, two cut off values of 1.7 and 2.7 were identified that segregated the third of patients (33 of 98) with the lowest and the highest ratio values, respectively, from the remaining 32 patients who had ratio values of 1.7 to 2.7 and were therefore considered in the middle third. Baseline data for the three groups were compared with Wilcoxon's test. Univariate correlation analysis between continuous baseline variables—including protein:creatinine ratio in spot morning urine samples and 24 hour urinary protein excretion rate—and slopes of decline of glomerular filtration rate was carried out with the Pearson correlation coefficient (r).13 Univariate correlation between dichotomous variables and the rate of decline of the glomerular filtration rate was carried out with the point biserial correlation coefficient.14 Multivariate analysis was done with multiple linear regression.15 Progression to end stage renal failure was analysed with univariate and multivariate analysis by using the Cox proportional hazards model.16 Because of their skewed distribution, protein:creatinine ratio, 24 hour urinary protein excretion rate, and serum cholesterol and triglyceride concentrations were log transformed before analysis. Data analysis was done with the sas package.17 Data were expressed as mean (SD) unless otherwise stated. Significance was set at 0.05 (two tailed)
Results
Protein:creatinine ratio and 24 hour urinary protein excretion rate
The correlation between protein:creatinine ratio values in spot morning urine specimens and 24 urinary protein excretion was highly significant (P=0.0001), although the correlation decreased with increases in the ratio. Log-log transformation of the data allowed linear regression analysis (r=0.932, P<0.0001). As the regression line and the line of unity (fig 1) are almost identical, an estimate of 24 urinary protein excretion in grams per day can be made from a direct translation of the random protein:creatinine ratio—that is, 24 hour urinary protein=urinary protein ratio.

Correlation between ln spot morning urine protein:creatinine ratio and log 24 hour urinary protein in 177 non-diabetic patients with chronic nephropathies and persistent clinical proteinuria, showing regression equation and line. r2=determination coefficient, r=correlation coefficient, SDR=ln SD of regression line
Urinary protein ratio, decline in glomerular filtration rate, and progression to end stage renal failure
Baseline clinical and laboratory measurements according to thirds of the three spot morning urine protein:creatinine ratios are given in table 1. The prevalence of glomerular and non-glomerular diseases was comparable in the three subgroups. Blood pressure and serum cholesterol concentrations were higher in the highest and middle compared with the lowest third. Distribution to the two study treatments was comparable in the overall study population and within each third because patients were stratified for baseline urinary protein excretion rate before randomisation. During the whole study period, mean (SD) diastolic blood pressure was comparable in the three groups (lowest 87.8 (10.8) mm Hg; middle 90.3 (10.9) mm Hg; highest 91.6 (9.4) mm Hg).
After linearity assessment the individual slopes were found adequate to describe the rate of decline in the glomerular filtration rate. The actual mean rate of decline in the whole cohort of 98 patients was −0.46 (1.34) ml/min/1.73 m2/month. The rate of decline significantly correlated (P<0.0005) with baseline protein:creatinine ratios (fig 2). Of interest, when data on mean decline were analysed according to thirds of baseline urinary protein:creatinine ratios it emerged that protein:creatinine ratio segregated three different populations of patients with predictably different rates of decline in glomerular filtration rate (lowest (n=33): protein:creatinine ratio <1.7, decline in glomerular filtration rate −0.31 (0.21) ml/min/1.73m2/month; middle (n=32): ratio 1.7-2.7, decline −0.48 (0.22) ml/min/1.73m2/month; highest (n=33): ratio >2.7, decline −0.90 (0.37) ml/min/1.73m2/month (P<0.05 v lowest)).
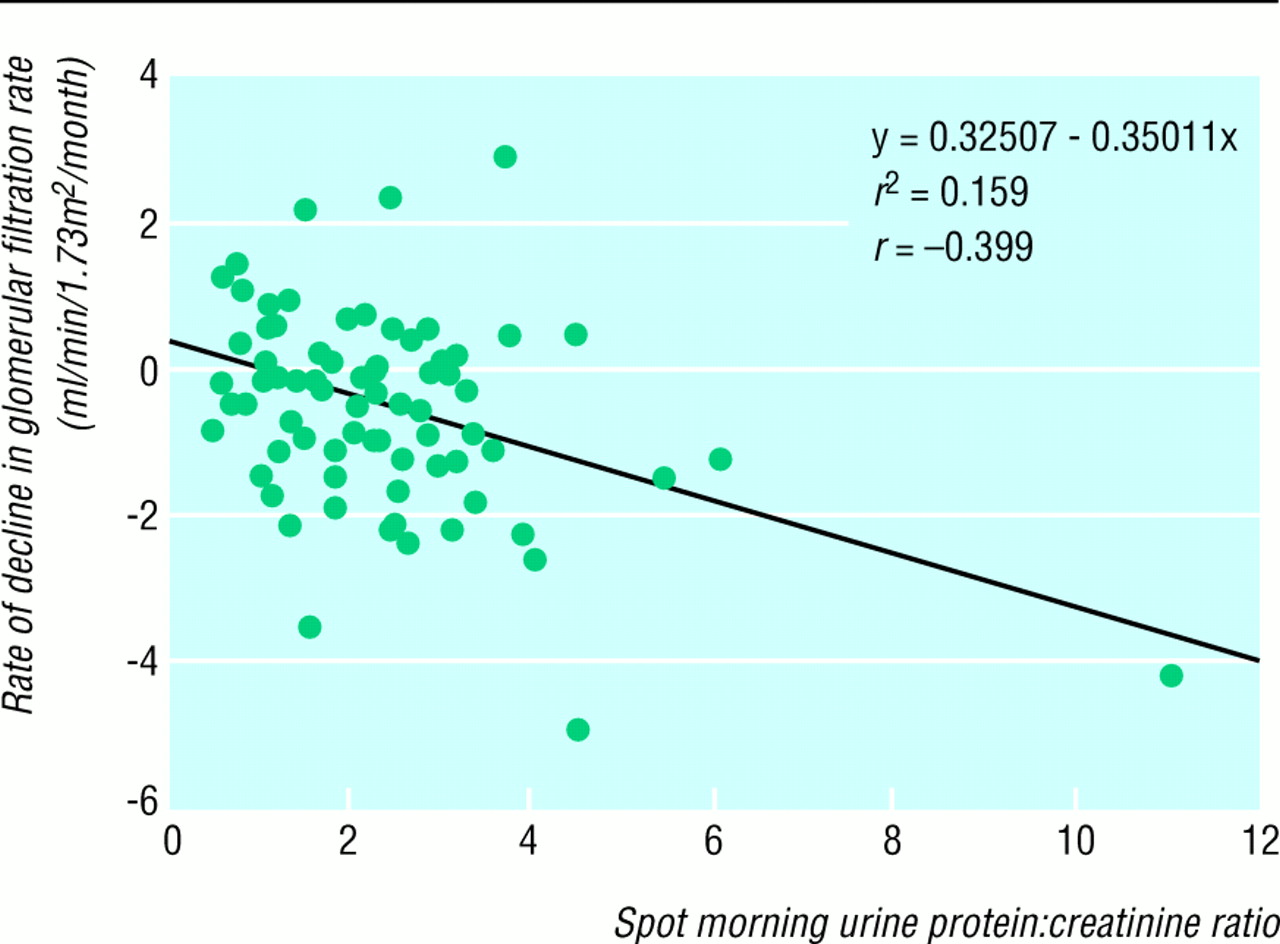
Correlation between baseline protein:creatinine ratios and rate of decline in glomerular filtration rate in 98 non-diabetic patients with chronic nephropathies, urine protein excretion rate persistently >1 g/24 hours, and creatinine clearance 20–70 ml/min/1.73 m2/month, showing regression equation and line. r2=determination coefficient and r=correlation coefficient
Univariate correlation analyses between baseline variables listed in table 1 and rate of decline of glomerular filtration rate showed that blood pressure, protein:creatinine ratio, and 24 hour urinary protein were significantly associated with a faster decline, with the ratio being the strongest predictor (table 2). On multivariate analysis the ratio was the only variable significantly predictive of a faster decline.
Results of univariate and multivariate analyses of correlation between baseline variables and rate of decline of glomerular filtration rate
As for the rate of decline of the glomerular filtration rate, when kidney survival was analysed according to thirds of baseline protein:creatinine ratio it emerged that the ratio segregated three different populations of patients with predictably different risk of progression to end stage renal failure (fig 3). Thus overall kidney survival was greater in patients in the lowest third (97.0%) compared with those in the middle (87.5%) and highest (78.8%; P<0.05 v lowest). On univariate correlation analyses between baseline variables listed in table 1 and kidney outcome, lower baseline glomerular filtration rate and creatinine clearance and higher serum creatinine concentration, protein:creatinine ratio, and 24 hour urinary protein excretion rate were associated with a higher rate of progression to end stage renal failure (table 3). On multivariate analysis higher protein:creatinine ratio and serum cholesterol concentration were the only variables significantly predictive of a lower kidney survival.
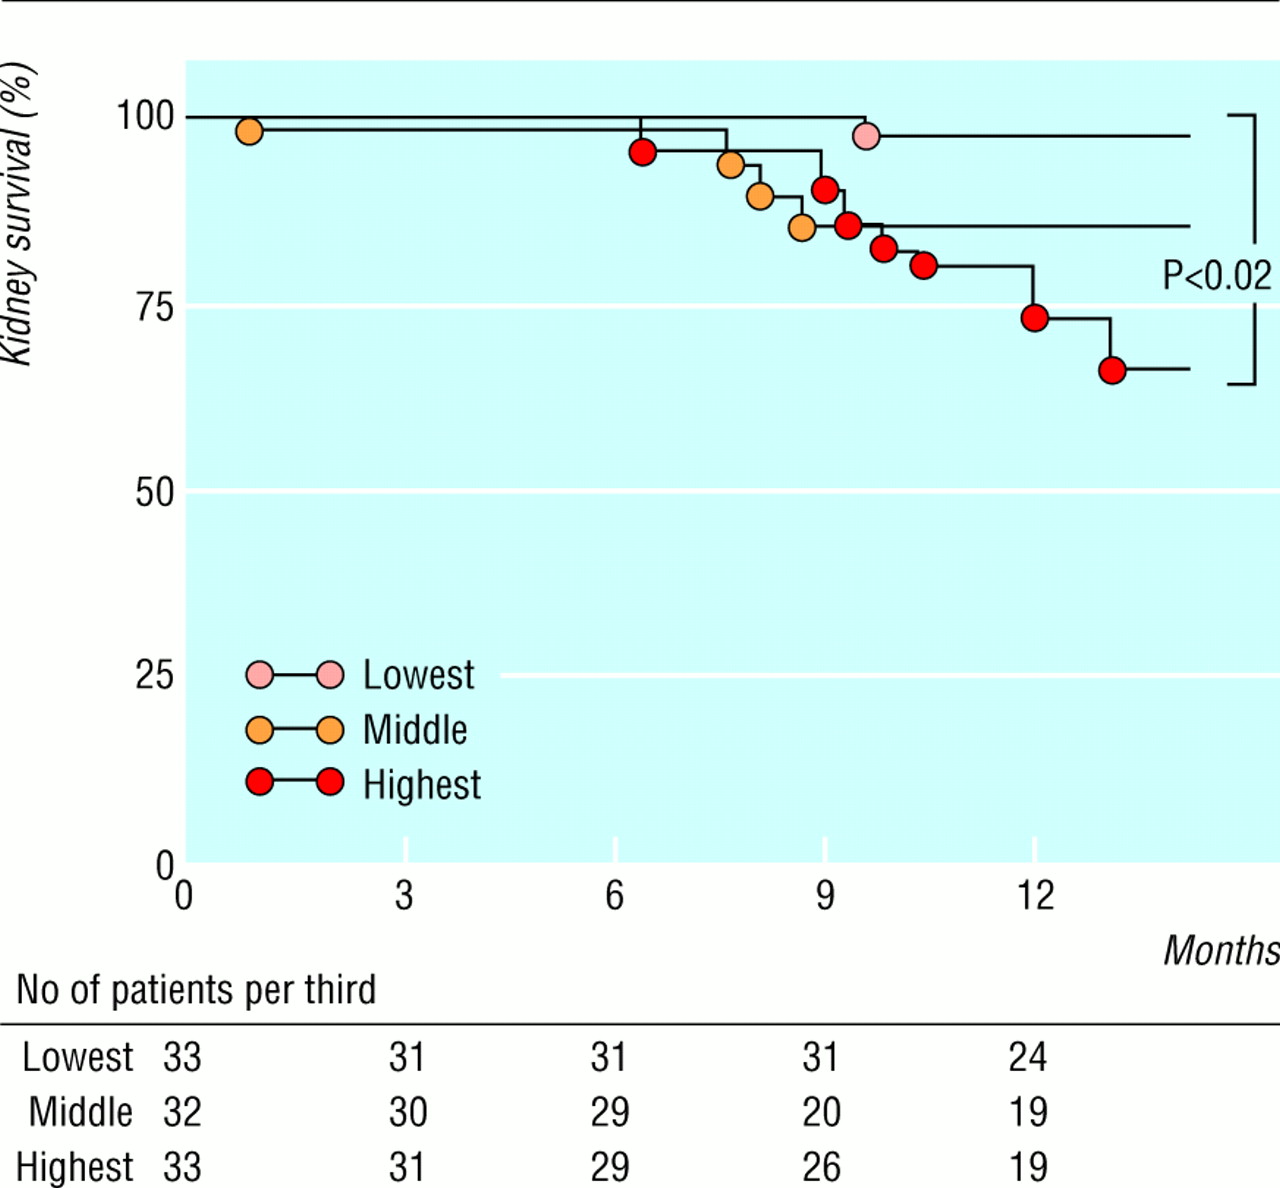
Kidney survival per third of baseline spot morning urine protein:creatinine ratio in 98 non-diabetic patients with chronic nephropathies, urine protein excretion rate persistently >1 g/24 hours, and creatinine clearance 20–70 ml/min/1.73 m2
Results of univariate and multivariate logistic regression analysis of risk of end stage renal failure for different baseline variables
Discussion
To our knowledge, this is the first study to show that the protein:creatinine ratio measured in spot morning urine specimens tightly correlates with 24 urinary protein excretion rate and accurately predicts rate of decline of glomerular filtration rate and risk of progression to end stage renal failure in non-diabetic patients with proteinuria and chronic renal disease. On univariate analysis the protein:creatinine ratio was even more predictive than 24 hour proteinuria and, on multivariate analysis, was the only baseline variable which predicted progression of disease and kidney survival. The higher the ratio the faster the decline in glomerular filtration rate (carefully determined by repeated measures of the true rate) and, even more important, the risk of progression to end stage renal failure. Thus, patients with a ratio <1.7 had the lowest rate of glomerular decline and kidney survival >95% over 12 month follow up. On the other hand, patients with a ratio >2.7 lost more than 10 ml/min/1.73 m2 of filtration rate per year and had a 12 month kidney survival <80%. These findings cannot be accounted for by specific effects of treatment because before randomisation in the ramipril study11 patients were stratified for baseline urinary protein excretion rate, which allowed for a well balanced allocation to the two study treatments within each third of proteinuria. In addition, evidence that all the patients in the three groups had comparable blood pressures (that is, diastolic blood pressure consistently below 90 mm Hg during the whole follow up period) provided consistent evidence that proteinuria in itself has a strong predictive value of progression of renal disease, which is not dependent on degree of control of blood pressure.
Therefore, neither biases in randomisation of patients or in control of blood pressure accounted for the remarkable differences in progression of renal disease shown for different levels of baseline spot morning urine protein:creatinine ratio. In addition, glomerular and non-glomerular diseases were similarly represented in the three groups, which makes it extremely unlikely that different renal outcomes were actually dependent on different underlying renal diseases rather than on degree of proteinuria. Consistent with the above considerations is that multivariate analysis of baseline protein:creatinine ratio but not the underlying renal disease predicted the risk of progression during the subsequent follow up.
Today, the results of many studies1 11 18 19 indicate that proteins filtered through the glomerular capillary may have intrinsic renal toxicity which, together with other independent risk factors such as hypertension, can have a contributory role in the progression of renal damage.20 21 In the present series, evidence of an highly significant correlation between baseline 24 hour urinary protein excretion rate and the rate of decline of the glomerular filtration rate during follow up corroborates this hypothesis. On the other hand, evidence that the protein:creatinine ratio even more accurately than 24 hour urinary protein excretion predicted the rate of decline suggests that the ratio as compared with 24 hour urinary protein is a more precise indicator of the kidney traffic of plasma proteins. This is probably because the ratio value in spot morning urine is independent of errors in urine collections and is minimally affected by the wide daily variations in urinary protein excretion rate associated with changes in posture, physical activity, protein intake, and haemodynamic factors.3 These variations may depend also on severity of proteinuria and may explain why 24 hour urinary protein excretion less precisely correlates with protein:creatinine ratio values in patients with more severe proteinuria.
Thus, in summary, the spot morning protein:creatinine ratio measurement is at least as reliable as 24 hour urinary protein collection in predicting progression of renal disease and, in addition, is easier to perform, inexpensive, and less time consuming for the patient. This may be of major relevance when large populations must be screened for urinary proteins or when patients are expected to provide urine samples imprecisely collected, or both.
Acknowledgments
We thank Rita Colombo, Silvia Ferrari, Mirko Rottoli, and Federica Arnoldi for their invaluable contribution, in particular for performing careful measurements of iohexol plasma clearances and urine protein and creatinine concentrations.
Funding: Hoechst Marion Roussel supported the ramipril efficacy in nephropathy (REIN) trial.
Conflict of interest: None.
Notes
Contributors: PR had the original idea for the study, designed the protocol, and participated in data analysis and writing the paper. FG participated in sample collection and data analysis. FP set up the database and analysed data. GR is one of the promoters of the original idea of protein toxicity in nephropathies and has worked on this topic for 10 years. He discussed core ideas, interpreted findings, and contributed to the paper. PR and GR are guarantors for the study.