


Abstract
Relative risk is usually the parameter of interest in epidemiologic and medical studies. In this paper, the author proposes a modified Poisson regression approach (i.e., Poisson regression with a robust error variance) to estimate this effect measure directly. A simple 2-by-2 table is used to justify the validity of this approach. Results from a limited simulation study indicate that this approach is very reliable even with total sample sizes as small as 100. The method is illustrated with two data sets.
Received for publication August 7, 2003; accepted for publication September 25, 2003.
Epidemiologic and clinical research is largely grounded on the assessment of risk. When the outcome variable of interest is dichotomous, a tool popular in assessing the risk of exposure or the benefit of a treatment is a logistic regression model, which directly yields an estimated odds ratio adjusted for the effect of covariates. When the probability of the outcome is low and the baseline risks for subgroups are relatively constant, the difference between the odds ratio and relative risk are negligible (1). Given the fact that 1) the relative risk cannot be directly estimated in case-control studies and 2) the odds ratios are identical in both cohort and case-control studies (2), logistic regression seems to be the natural choice when it is necessary to control for covariates, especially continuous covariates.
Despite repeated emphasis on the importance of the rare event rate assumption, consumers of medical reports often interpret the odds ratio as a relative risk, leading to its potential exaggeration. For example, several major US news media recently dramatically overstated the effects of race and sex on physicians’ referrals for cardiac catheterization: a 7 percent reduction in the referral rate for Black women was mistakenly reported as 40 percent (3).
Extensive discussion in much of the literature has reached a consensus that the relative risk is preferred over the odds ratio for most prospective investigations (1, 4, 5). Nevertheless, the recent medical literature has frequently included uncritical application of logistic regression to prospective studies. Coupled with the perception that easily accessible alternatives are unavailable, naive conversion of an adjusted odds ratio to a relative risk has compounded the difficulties (6, 7). Not only will this conversion method provide invalid confidence limits (7), but, most importantly, it will also produce inconsistent estimates for the relative risk; that is, the bias will not decrease as the sample size increases. Suppose, for example, in a study with two strata, each having 200 subjects, the estimated risks are 0.8 for the exposed group (140 subjects) and 0.4 for the unexposed group (60 subjects) in stratum 1, while the corresponding risks are 0.1 (60 subjects) and 0.05 (140 subjects) in stratum 2. It is obvious that the standard Mantel-Haenszel estimate for the relative risk is 2.0, but converting the odds ratio as obtained from logistic regression results in an estimated value of 2.98. Moreover, increasing each cell size 10-fold will result in a 95 percent confidence interval of 2.68, 3.25.
To estimate the relative risk directly, binomial regression (8) and Poisson regression (7) are usually recommended. However, as is commonly known, neither is very satisfactory. Convergence problems may arise with binomial regression models; in this case, they may fail to provide an estimate of the relative risk (7–10). On the other hand, use of Poisson regression tends to provide conservative results (7, 11, 12).
The purpose of this paper is to demonstrate how to estimate relative risk by using the Poisson regression model with a robust error variance. Since this procedure coexists with logistic regression analysis as implemented in standard statistical packages, there is no justification for relying on logistic regression when the relative risk is the parameter of primary interest.
MODIFIED POISSON REGRESSION
Poisson regression is usually regarded as an appropriate approach for analyzing rare events when subjects are followed for a variable length of time. When Poisson regression is applied to binomial data, the error for the estimated relative risk will be overestimated (11). However, this problem may be rectified by using a robust error variance procedure known as sandwich estimation (13), thus leading to a technique that I refer to as modified Poisson regression.
Consider the case in which xi (i = 1,2, … , n) is a binary exposure with a value of 1 if exposed and 0 if unexposed. Then, the data can be summarized in a 2-by-2 table (table 1).
Assume that subject i has an underlying risk that is a function of xi, say π(xi). Because π(xi) must be positive, the logarithm link function is a natural choice for modeling π(xi), giving
log[π(xi)] = α + βxi.
The relative risk (RR) is then given by exp(β). If a Poisson distribution is assumed for yi, the log-likelihood is given by
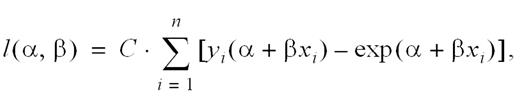
where C is a constant. Application of standard likelihood theory yields
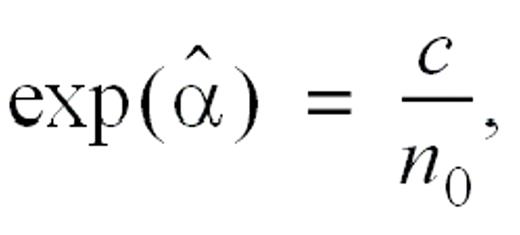
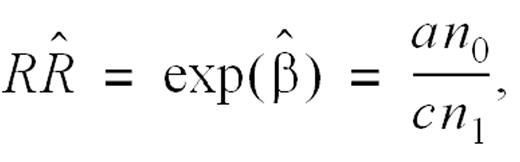
with the estimated variance of  given by
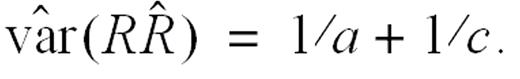
Now, since the error term is misspecified when the underlying data are binomially distributed, the sandwich estimator is used to make the appropriate correction. The corrected variance can be easily shown to be given by
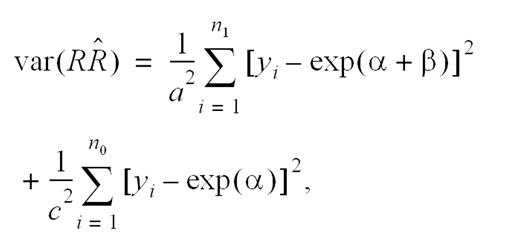
which is consistently estimated by
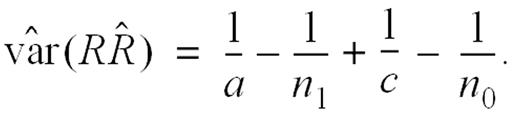
Note that this estimator is identical to the traditional variance estimator derived by using the delta method (14, p. 455). An extension of this result that incorporates covariates adjustment can be obtained by using the steps outlined elsewhere (Lachin, section A.9 (14)).
Sandwich error estimation can be implemented by using the SAS PROC GENMOD procedure (15) with the REPEATED statement. It is commonly known that this approach can be used to analyze clustered data, such as repeated measures obtained on the same subject (16) or observations arising from cluster randomization trials (17). It is less well known that the same statement with PROC GENMOD can also be used to obtain a robust error estimator when only one observation is available from each cluster. In the present context, this approach can be used to correctly estimate the standard error for the estimated relative risk.
To validate this procedure numerically, I evaluated the performance of the modified Poisson regression approach in terms of relative bias for point estimation and percentage of confidence interval coverage. For comparison, I also included binomial regression and the standard Mantel-Haenszel procedure (18). Total sample sizes considered were 100, 200, and 500, with relative risk values of 1.0, 2.0, and 3.0. Sample sizes of less than 100 may provide confidence intervals that are too wide and thus were not considered here. In each of 1,000 simulated data sets, n subjects were randomly assigned to the exposure group with a probability of 0.5. Subjects in the exposure group were randomly assigned to the first stratum with a probability of 0.6, whereas those in the nonexposed group were assigned with a probability of 0.4 to this stratum. Regression analysis was performed by using the PROC GENMOD procedure for both binomial regression and Poisson regression and the PROC FREQ procedure for the Mantel-Haenszel method. The SAS macro used for the simulation is available from the author on request.
Simulation results shown in table 2 indicate that the relative bias of all point estimators decreases with increasing sample size. The results also demonstrate, by any reasonable standard, that the coverage percentage obtained by using the modified Poisson regression approach can be regarded as very reliable in terms of both relative bias and percentage of confidence interval coverage, even with sample sizes as small as 100. As expected, the Poisson regression produces very conservative confidence intervals for the relative risk, and the Mantel-Haenszel procedure also shows good performance. The binomial regression provides very satisfactory results, which is in agreement with findings reported by Skov et al. (10). However, they disagree with those reported by McNutt et al. (7), who found that confidence intervals obtained from this model and from the Mantel-Haenszel procedure have less-than-nominal coverage levels.
ILLUSTRATIVE EXAMPLES
As a first example, consider a data set involving 172 diabetic patients presented by Lachin (14, p. 261). This is a subset of a large clinical trial known as the DCCT trial (Diabetes Control and Complications Trial) (19), where it is of interest to determine the relative risk of standard therapy versus intensive treatments in terms of the prevalence of microalbuminuria at 6 years of follow-up. Covariates requiring adjustment are the percentage of total hemoglobin that has become glycosylated at baseline, the prior duration of diabetes in months, the level of systolic blood pressure (mmHg), and gender (female) (1 if female, 0 if male).
Applying the modified Poisson regression procedure results in an estimated risk of microalbuminuria that is 2.95 times higher in the control group than in the treatment group. Had the estimated odds ratio been interpreted as a relative risk, the risk would have been overestimated by 65 percent (4.87 vs. 2.95). The relative bias of the converted relative risk as obtained from the logistic regression model is 13 percent compared with the result obtained from using Poisson regression. The confidence interval provided by the ordinary Poisson regression approach is 31 percent wider than that obtained by using the sandwich error approach. Interestingly, the binomial regression procedure failed to converge until a variety of starting values were provided, when it finally converged with a starting value of –1.1 for the intercept. The estimated relative risk for patients treated with standard therapy is given by 2.85 (95 percent confidence interval (CI): 1.56, 5.23), which is fairly compatible with that obtained from the modified Poisson regression procedure.
Now let us consider data from a randomized clinical trial conducted in 1997–1998 at 18 US trauma centers (20, 21). The primary objective of this trial was to determine whether additional infusion of 500–1,000 ml of diaspirin cross-linked hemoglobin during the initial hospital resuscitation period could reduce 28-day mortality in patients suffering from traumatic hemorrhagic shock. Ninety-eight patients were randomly assigned to diaspirin cross-linked hemoglobin or to a control (saline) treatment. Three risk subgroups were then defined according to the baseline trauma-related injury severity score, which was available for 93 patients, producing the data summarized in table 3. My aim was to estimate the risk of death for patients treated with diaspirin cross-linked hemoglobin relative to that for patients treated with saline. Application of the modified Poisson regression procedure results in an estimated relative risk of 2.30 (95 percent CI: 1.27, 4.15), very close to the results obtained by using the Mantel-Haenszel procedure and given by 2.28 (95 percent CI: 1.27, 4.09). Use of logistic regression analysis, on the other hand, results in an estimated odds ratio of 6.823 (95 percent CI: 1.776, 26.214). Thus, the estimated relative risk obtained from the converting odds ratio is given by 3.31 (95 percent CI: 1.55, 4.69), over 40 percent higher than the result obtained by using the standard Mantel-Haenszel procedure. The estimated relative risk from binomial regression is given as 1.94 (95 percent CI: 1.05, 3.59), somewhat smaller than that from using the Mantel-Haenszel method.
DISCUSSION
This paper has proposed use of Poisson regression with a sandwich error term to estimate relative risk consistently and efficiently. To implement the method, no extra programming effort is necessary. Compared with application of binomial regression, the modified Poisson regression procedure has no difficulty with converging, and it provides results very similar to those obtained by using the Mantel-Haenszel procedure when the covariate of interest is categorical. Although the binomial regression procedure is also satisfactory, special care is required when choosing starting values.
Although it is possible to obtain the adjusted relative risk from logistic regression analysis, the required computations are fairly tedious (22, 23). Naively converting the odds ratio may not produce a consistent estimate, a minimum statistical requirement. Interestingly, a similar problem has previously been pointed out when dealing with converting an adjusted odds ratio to a risk difference (24); this pitfall continues to be seen in calculating the “number needed to be exposed” (25), a variant of the number needed to be treated (26). Therefore, it may still be very relevant to revisit a statement made by Greenland more than 20 years ago: “… there is a danger that the ease of application of the [logistic] model will lead to the inadvertent exclusion from consideration of other, possibly more appropriate models for disease risk” (27, p. 693). Many alternative models allow the relative risk to be estimated directly. As one such alternative, I have introduced a modified Poisson regression procedure at least as flexible and powerful as binomial regression. The additional advantage of estimating relative risk by using a logarithm link is that the estimates are relatively robust to omitted covariates (28, 29), in contrast to logistic regression.
The robust error estimate is commonly used to deal with variance underestimation in correlated data analysis. I have applied this approach here to deal with variance overestimation when Poisson regression is applied to binary data. It is thus interesting to investigate the performance of this approach with correlated binary data that arise from longitudinal studies or a cluster randomization trial. This research is in progress.
ACKNOWLEDGMENTS
This work was supported in part by the Natural Sciences and Engineering Research Council of Canada.
The author is indebted to Dr. Allan Donner for reviewing drafts of the paper.
Correspondence to Dr. Guangyong Zou, Robarts Clinical Trials, Robarts Research Institute, P.O. Box 5015, 100 Perth Drive, London, Ontario, Canada N6A 5K8 (e-mail: gzou@robarts.ca).
Notation for entries in a 2-by-2 table
| y = 1 (event) | y = 0 (no event) | Total | |
| x = 1 (exposed) | a | b | n1 = a + b |
| x = 0 (unexposed) | c | d | n0 = c + d |
| n = n1 + n0 |
| y = 1 (event) | y = 0 (no event) | Total | |
| x = 1 (exposed) | a | b | n1 = a + b |
| x = 0 (unexposed) | c | d | n0 = c + d |
| n = n1 + n0 |
Empirical coverage percentage based on 1,000 runs for four methods of constructing a 95% two-sided confidence interval for relative risk
| Relative risk | Stratum-specific risk (exposed/unexposed) | Sample size (no.) | Method | ||||||
| 1 | 2 | Poisson regression | Modified Poisson regression* | Binomial regression | Mantel-Haenszel procedure | ||||
| 1 | 0.4/0.4 | 0.2/0.2 | 100 | 99.3 (7.35)† | 96.5 | 95.7 (7.28) | 96.9 (7.25) | ||
| 200 | 99.0 (2.67) | 95.8 | 95.8 (2.74) | 95.8 (2.63) | |||||
| 500 | 98.4 (1.09) | 94.7 | 95.6 (1.14) | 94.9 (1.06) | |||||
| 0.6/0.6 | 0.2/0.2 | 100 | 99.2 (4.22) | 94.7 | 93.4 (3.66) | 94.7 (3.97) | |||
| 200 | 99.1 (1.50) | 95.3 | 94.8 (1.43) | 95.2 (1.42) | |||||
| 500 | 98.9 (0.32) | 94.6 | 94.9 (0.31) | 94.8 (0.28) | |||||
| 2 | 0.8/0.4 | 0.4/0.2 | 100 | 99.2 (6.35) | 95.5 | 94.7 (6.07) | 95.7 (6.31) | ||
| 200 | 99.3 (2.48) | 95.5 | 94.6 (2.44) | 95.5 (2.45) | |||||
| 500 | 99.3 (0.96) | 95.3 | 95.3 (1.02) | 95.2 (0.95) | |||||
| 0.6/0.3 | 0.4/0.2 | 100 | 98.2 (9.16) | 94.9 | 95.4 (9.11) | 96.2 (9.19) | |||
| 200 | 98.9 (3.27) | 95.2 | 95.5 (3.24) | 95.6 (3.36) | |||||
| 500 | 98.1 (1.19) | 94.9 | 95.1 (1.23) | 95.2 (1.21) | |||||
| 3 | 0.9/0.3 | 0.6/0.2 | 100 | 98.9 (8.60) | 95.1 | 95.2 (7.23) | 95.1 (8.70) | ||
| 200 | 98.5 (3.48) | 94.6 | 94.8 (3.45) | 95.0 (3.55) | |||||
| 500 | 98.9 (1.59) | 94.8 | 94.8 (1.59) | 94.9 (1.60) | |||||
| 0.75/0.25 | 0.6/0.2 | 100 | 98.5 (10.24) | 94.4 | 94.2 (10.23) | 94.8 (10.56) | |||
| 200 | 98.5 (4.14) | 94.6 | 94.5 (4.17) | 95.0 (4.30) | |||||
| 500 | 98.5 (1.74) | 94.6 | 94.3 (1.73) | 94.8 (1.79) | |||||
* The relative bias from modified Poisson regression is the same as that from Poisson regression.
† Values in parentheses, percentage of relative bias of the estimated relative risk calculated as the average of 1,000 estimates minus the true relative risk divided by the true relative risk.
Twenty-eight day mortality (no. of deaths/total) in the Diaspirin Cross-linked Hemoglobin Study,* as stratified by survival predicted by baseline trauma-related injury severity score, United States, 1997–1998
| Treatment | Baseline risk | ||
| High | Medium | Low | |
| Diaspirin cross-linked hemoglobin | 12/13 | 5/13 | 5/23 |
| Control | 6/10 | 1/12 | 1/22 |
| Relative risk | 1.54 | 4.62 | 4/78 |
| Treatment | Baseline risk | ||
| High | Medium | Low | |
| Diaspirin cross-linked hemoglobin | 12/13 | 5/13 | 5/23 |
| Control | 6/10 | 1/12 | 1/22 |
| Relative risk | 1.54 | 4.62 | 4/78 |
* Refer to Sloan et al. (20) and Cook (21).
References
Greenland S. Interpretation and choice of effect measures in epidemiologic analyses.
Cornfield J. A method of estimating comparative rates from clinical data: application to cancer of the lung, breast, and cervix.
Schwartz LM, Woloshin S, Welch HG. Misunderstandings about the effects of race and sex on physicians’ referrals for cardiac catheterization.
Sinclair JC, Bracken MB. Clinically useful measures of effect in binary analyses of randomised trials.
Nurminen M. To use or not to use the odds ratio in epidemiologic analyses.
Zhang J, Yu KF. What’s the relative risk? A method of correcting the odds ratio in cohort studies of common outcomes.
McNutt LA, Wu C, Xue X, et al. Estimating the relative risk in cohort studies and clinical trials of common outcomes.
Wacholder S. Binomial regression in GLIM: estimating risk ratios and risk differences.
Wallenstein S, Bodian C. Inferences on odds ratios, relative risks, and risk differences based on standard regression programs.
Skov T, Deddens J, Petersen MR, et al. Prevalence proportion ratios: estimation and hypothesis testing.
Zocchetti C, Consonni D, Bertazzi PA. Estimation of prevalence rate ratios from cross-sectional data.
Thompson ML, Myers JE, Kriebel D. Prevalence odds ratio or prevalence ratio in the analysis of cross sectional data: what is to be done?
Royall RM. Model robust confidence intervals using maximum likelihood estimators.
Lachin JM. Biostatistical methods: the assessment of relative risks. New York, NY: Wiley-Interscience, 2000.
Liang KY, Zeger SL. Longitudinal data analysis using generalized linear models.
Donner A, Klar N. Design and analysis of cluster randomization trials in health research. London, United Kingdom: Arnold, 2000.
Greenland S, Robins JM. Estimation of a common effect parameter from sparse follow-up data.
The effect of intensive treatment of diabetes on the development and progression of long-term complications in insulin-dependent diabetes mellitus. The Diabetes Control and Complications Trial Research Group.
Sloan EP, Koenigsberg M, Gens D, et al. Diaspirin cross-linked hemoglobin (DCLHb) in the treatment of severe traumatic hemorrhagic shock, a randomized controlled efficacy trial.
Cook TD. Up with odds ratios! A case for odds ratios when outcomes are common.
Flanders WD, Rhodes PH. Large sample confidence intervals for regression standardized risks, risk ratios, and risk differences.
Jeffe MM, Greenland S. Standardized estimates from categorical regression models.
Greenland S, Holland P. Estimating standard risk differences from odds ratios.
Bender R, Blettner M. Calculating the ‘number needed to be exposed’ with adjustment for confounding variables in epidemiological studies.
Laupacis A, Sackett DL, Roborts RS. An assessment of clinically useful measures of the consequences of treatment.
Greenland S. Limitations of the logistic analysis of epidemiologic data.
Gail MH, Wieand S, Piantadosi S. Biased estimates of treatment effect in randomized experiments with non-linear regressions and omitted covariates.

