


Food insecurity is defined as ‘the inability to acquire or consume an adequate diet quality or sufficient quantity of food in socially acceptable ways, or the uncertainty that one will be able to do so’( Reference Davis and Tarasuk 1 ). Food-insecure households exhibit poor diet quality( Reference Ricciuto, Tarasuk and Yatchew 2 , Reference Ricciuto and Tarasuk 3 ) and are at risk for poor physical and mental health outcomes, likely associated with lack of healthy eating and overall stress( Reference Tarasuk 4 ).
The strongest predictor of food insecurity is family poverty status, with households in the lowest income brackets found to be the most vulnerable( Reference Che and Chen 5 , Reference McIntyre, Walsh and Walsh 6 ). In Canada, households that receive social assistance report the highest rates of food insecurity( Reference McIntyre, Connor and Warren 7 ). In 2004, for example, the Canadian Community Health Survey (CCHS) found that 59·7 % of households whose main source of income was social assistance were food insecure( 8 ). Provincial and federal governments in Canada have sought to improve poverty outcomes such as food insecurity by reducing the number of households dependent on income transfers such as social assistance. Using approaches such as training opportunities and wage subsidies, members of lower-income households have been encouraged to rely much more on employment earnings than on social assistance( Reference Coe and Emery 9 , Reference Milligan and Stabile 10 ). However, for many households, the result has been that members shift their rank from the ‘welfare poor’ to the ‘working poor’( Reference Fleury and Fortin 11 ). In 2007, 31 % of all families with a household income below the low income cut-off had worked over 910 h (i.e. a standard measure of annual labour force engagement)( 12 ), representing 5·9 % of all workers in Canada. Of these, 76 % reported having full-time, full-year work, indicating a strong attachment to the labour market( 12 ). In addition, 52 % of individuals whose household income was below the low income cut-off earned wages higher than the minimum wage( Reference Fleury and Fortin 11 ), indicating that they were remunerated at a variety of pay scales beyond a legislated minimum.
The working poor, defined as those whose household incomes are below the low income cut-off, are also counted among the food insecure. Food banks report a substantial number of users from among the working poor; in 2011, 17·9 % of clients reported current employment as their primary source of income( 13 ). In the 2004 CCHS survey, food insecurity was reported in 7·3 % of households whose main source of income was salary and wages( 8 ). Indeed, in terms of absolute numbers, food insecurity among the working poor exceeds that among social assistance and other income transfer recipients. Beyond this evidence of food insecurity among poor working households, to date there has been no thorough characterization of food insecurity within Canadian households dependent on working for their source of income. In addition to identifying characteristics of vulnerable workers in such households, an examination of food insecurity in food-insecure working households could suggest working conditions that predispose or protect against food insecurity and reveal coping strategies used by food-insecure workers. For example, if workers in some industries are associated with higher risk of household food insecurity, then we would have some understanding of how cyclical and trend changes in labour market conditions are impacting vulnerable households. In addition, by understanding which industries are associated with a higher risk of food insecurity, we can investigate labour market policies and regulations that might be suitable for improving employment conditions and earnings characteristics (levels and volatility). The objective of the present study, therefore, was to broadly examine the correlates of food insecurity among households reliant on employment income.
Methods
Data
Data were drawn from CCHS Cycle 4·1, spanning the calendar years of 2007 and 2008. Using a sampling strategy designed to achieve representativeness of the Canadian population, total respondent numbers for CCHS 4·1 were 132 080 individuals. For the present analysis, individuals with missing responses to data for food insecurity questions were dropped, and data were further restricted to working ages (greater than 18 and less than 65 years of age). Furthermore, only respondents reporting wages/salary and/or self-employment as the main source of household income were included. Respondents were excluded if any household income was derived from social assistance or welfare. These exclusions ensured that the data represented households reliant upon participation in the labour force. Final respondent numbers appear in Table 1. The study received ethical approval from the Conjoint Health Research Ethics Board at the University of Calgary.
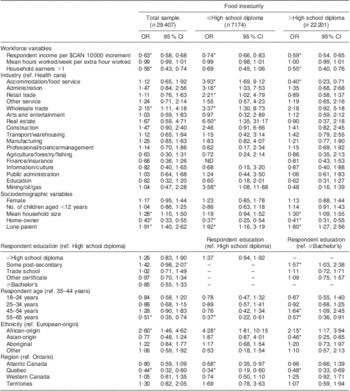
Table 1 Sociodemographic and workforce characteristics of food-secure and food-insecure working households (n 41 802), Canadian Community Health Survey (CCHS) Cycle 4·1 (2007–2008)

NB: Not all rows and columns total 100 % due to rounding.
*Significantly different from food secure, P < 0·05.
Food insecurity was ascertained through administration of the US Department of Agriculture's Household Food Security Survey Module. The Household Food Security Survey Module contains eighteen questions about the food security situation in the household (related to lack of money or ability to afford food) over the previous 12 months: ten questions are specific to the experiences of adults in the household, and eight questions are specific to children. The US Department of Agriculture's scoring system was used in this analysis, i.e. households were considered food insecure if respondents answered two or more of both the adult and child (if applicable) questions in the affirmative (‘yes’; ‘often’; ‘sometimes’; ‘almost every month’; ‘some months but not every month’)( Reference Bickel, Nord and Price 14 ). Food insecurity was considered present or not and encompassed both compromises in diet quality as well as inadequate consumption.
Covariates
Covariates used in our analyses reflected households known to be vulnerable to food insecurity in Canada, such as those related to household composition, e.g. lone parent-led households, higher numbers of children and Aboriginal members( Reference Ledrou and Gervais 15 , Reference McIntyre and Rondeau 16 ). Because food insecurity is measured as a household characteristic, where possible we used household measures such as home ownership, region of residence, marital status and household income. Given that personal information was not available for all household members, we used sex, age group, race and education of respondents as representative of household characteristics for general descriptive purposes.
For analyses aimed at characterizing the food-insecure worker rather than the household, we included only the primary earner in the household on the basis that their personal income exceeded 50 % of household income. Note that we cannot know for certain if these individuals were personally food insecure, just that they lived in households reporting food insecurity. As primary earners, we considered their personal income, hours of work per week, whether or not they worked at multiple jobs and their reported job stress as measured by a five-point Likert scale, with ratings of 4 = ‘quite a bit stressful’ and 5 = ‘extremely stressful’ deemed high work stress. Hours per week was based on respondents’ report of hours worked in a typical week.
Previous research has identified that working in the sales and service sector increases the probability of being poor( Reference Fleury and Fortin 11 ). The CCHS obtained information on respondents’ industry of employment (North American classification), allowing for analysis of food insecurity in specific industrial sectors. We examined the primary earner's attachment to specific industry sectors of the labour market and its correlation with household food insecurity. To be certain that the industry sector was that of the primary earner in the household, again only respondents with a personal income greater than or equal to 50 % of the household income were included in these analyses.
Finally, because skilled and unskilled workers are not interchangeable for employers( Reference Coe and Emery 9 , Reference Coe and Emery 17 – Reference Sattinger 21 ), it may be that labour market conditions and outcomes differ across skill groups, which in turn affects the risk of a household being food insecure( 8 ). Using education level as a proxy measure for skill level in the context of the workplace, for an examination of educational attainment and food insecurity by industrial sector, we stratified our sample according to the primary earner's educational attainment.
Analyses
Descriptive statistics were conducted using population weights provided by Statistics Canada. Cell sizes less than 15 are not disclosed according to Statistics Canada protocol. Statistical comparisons between the distribution of these sociodemographic factors among food-insecure and food-secure working households were performed using t tests (P < 0·05 considered significant). In addition, simple bivariate analysis was employed to investigate the odds of food insecurity in households where primary earners reported working multiple jobs as well as high work stress. We also examined if there were multiple earners in the household to consider the buffering capacity of other earners to withstand household food insecurity if the primary earner's work situation changes.
To determine if primary earners in specific industry sectors were at higher odds of living in food-insecure households, multivariate logistic regression with bootstrapping was used for the dichotomous outcome of food insecurity, adjusting for workforce and sociodemographic characteristics as a whole (including education as an effect modifier), and stratified by high school education or less v. greater. Education stratification in this case served to denote skill level (low for high school education or less v. higher for other educational attainment).
Results
Sociodemographic characteristics of food-insecure working households
Food insecurity among households reliant on employment earnings for income was 4 % in 2007–2008. In comparison, food insecurity in the general population for that time period using the US Department of Agriculture scoring was 7·1 %( 22 ). A majority of food-insecure working households were female-led, typically younger and with slightly more children under the age of 12 years than food-secure working households (Table 1). A larger percentage of food-insecure working households were lone parent-led and a significantly lower percentage owned their own home compared with food-secure working households. Although European-origin households represented the highest proportion of working households in our sample, they were under-represented in food-insecure working households, whereas African-origin and Aboriginal working households were significantly over-represented (Table 1).
Despite working an average of 40 h/week, both personal and household incomes were significantly lower for members of food-insecure working households compared with their working food-secure counterparts. Median annual household income in 2007–2008 for working food-secure households was $CAN 70 000, while household income for food-insecure working households was $CAN 34 000 (Table 1).
Work characteristics, industry and educational attainment of primary earners in food-insecure households
Turning next to the examination of primary earners in working food-secure and food-insecure households, bivariate analysis demonstrated that primary earners in food-insecure households were significantly more likely to report working multiple jobs (OR = 1·48; 95 % CI 1·20, 1·82) and to report higher job stress (OR = 1·21; 95 % CI 1·04, 1·42) than workers in food-secure households.
The prevalence of food insecurity varied considerably across industrial sectors (Table 2). The highest percentage of food insecurity was observed among the accommodation/food service and administration sectors. Low percentages of food insecurity were observed for public administration and education.
Table 2 Household food insecurity by primary earner's industry sector and educational attainment (n 31 619), Canadian Community Health Survey (CCHS) Cycle 4·1 (2007–2008)

ND, not disclosed.
Workers with education beyond high school typically demonstrated lower percentages of household food insecurity across industry sectors; the lowest rate was observed among workers who had obtained at least a bachelor's degree (Table 2). However, food insecurity percentages demonstrated some variation among education groups below the bachelor's level, indicating that the impact of education level may be sector-specific. Overall, industries with higher rates of food insecurity demonstrated greater percentages of workers with a high school diploma or less. In contrast, industries with lower percentages of food insecurity typically had a greater density of workers with a bachelor's education (Table 2).
Multivariate logistic regression revealed that increasing income independently decreased the odds of food insecurity in Canadian working households, as did having multiple earners in the household (Table 3). With the exception of wholesale trade, there was no association between industry sector and household food insecurity. However, when the sample was stratified by education (workers with and without attainment beyond high school), differences were observed, particularly among industry sectors. In the mining/oil/gas industry, wholesale and retail trade, administration and accommodation/food service sectors, workers with only a high school diploma or less were significantly more likely to live in food-insecure households compared with workers with this level of education in the health-care industry. In contrast, industry variables were not significant for workers with education beyond high school, except for the accommodation/food service industry which demonstrated lower odds of food insecurity compared with health-care workers with this higher level of education. Therefore, the likelihood of living in a food-insecure household for workers with only a high school education or less was associated not only with household and income variables but also with the industry sector in which they worked.
Table 3 Multivariate regression analysis of odds for household food insecurity of primary earners as a whole and stratified by high school education, Canadian Community Health Survey (CCHS) Cycle 4·1 (2007–2008)
ref., reference category; ND, not disclosed.
*Significant, P < 0·05.
Of note, workers residing in Quebec had significantly reduced odds of being food insecure by almost 60 % compared with workers in Ontario. This decreased likelihood was observed regardless of educational attainment and was more pronounced for workers with only high school education (Table 3).
Discussion
The present study describes household food insecurity among Canadian working households, i.e. those reliant on employment income. We found that income is a significant factor affecting the odds of being food insecure, as incomes in food-insecure households were considerably lower than those in food-secure households. By implication, policies that encourage full employment may not mitigate poverty if the wages earned by the most vulnerable workers are insufficient to eliminate their susceptibility to food insecurity.
The lower earnings of workers in food-insecure households despite full-time hours of work in a typical week, combined with a higher report of multiple jobs, suggests that food-insecure workers are attempting to make ends meet through work but have inadequate income to meet their budgetary needs. From our multivariate regression analysis we found that less educated workers demonstrated greater odds of reporting food insecurity in certain industry sectors such as accommodation and food services, independent of income. While we cannot exclude the possibility that the inherent characteristics of workers may vary between industry sectors, other explanations for differing food insecurity rates in various industry sections, despite similar annual incomes, merit consideration. It is possible that employment dimensions other than lower hourly wages contribute to food insecurity risk for workers. Possible employment characteristics that could increase food insecurity risk among workers include seasonal work, shift work, irregular hours, lack of union protection from lay-offs during cyclical slowdowns and lack of job mobility. These work characteristics could lead to fewer weeks worked and overall lower earnings, and/or income volatility. Volatile earnings can result in negative household income shocks that have been observed to be just as harmful to household material well-being as living in persistent low income( Reference Leete and Bania 23 ).
Seasonal employment represented 12·9 % of the Canadian workforce in 2007( 24 ), while 30 % of employed Canadians worked non-standard hours( Reference Shields 25 ). From our regression, industry sectors with the highest percentage of seasonal employment (construction, forestry/fishing, public administration)( Reference Guillemette, L'Italien and Grey 26 ) did not show increased odds of food insecurity among workers with only a high school education. In contrast, industry sectors with significantly higher odds of food insecurity for this category of worker (accommodation/food service, administration, trade, mining/oil/gas) were among those with the highest number and percentage of shift workers in Canada( 27 ). The accommodation/food service sector, for example, includes the largest percentage of shift workers (40 %)( 27 ). Workers with low education in this industry may be particularly vulnerable to food insecurity due to income variation associated with shift work.
Jobs in different industries can also differ in terms of the variability of income due to sensitivity to the business cycle and due to differing rates of unionization, which provides more stable jobs and wages to unionized workers. Administration – a high food insecurity sector, for example, has one of the lowest rates of unionization in Canada (6·3 %)( 28 ). In contrast, public administration and education, two sectors with very high rates of unionization (67·3 % and 68·3 %, respectively), had low rates of food insecurity.
Where skills are transferable and hence workers are mobile across industries, we would not expect to see industry as an important determinant of food insecurity, because workers would migrate from ‘bad jobs’ to ‘good jobs’( Reference Beaulieu 19 , Reference Beaulieu 20 ). We should see in this case that food insecurity prevalence is determined by a worker's skill level but not industry of employment. To find that industry of employment determines food insecurity risk after accounting for skill level suggests that workers are not mobile across industries. This lack of inter-industry mobility has been identified in studies examining the impact of Canada–USA free trade on Canadian workers( Reference Beaulieu 19 , Reference Beaulieu 20 ).
We also found an over-representation of Aboriginal and visible minority groups among the working food insecure, consistent with their over-representation in the food-insecure population as a whole( 8 ). Still, the finding that ethnicity, independent of education, was predictive of food insecurity raises concern about racialization within the labour force. Food insecurity among racialized groups is especially concerning as the proportion of visible minority groups in the Canadian labour force is expected to increase substantially in the future( 29 , Reference Martel, Malenfant and Morency 30 ).
As previously mentioned, food insecurity is linked to poor health outcomes, the association of which is complex as poor health may limit employment opportunities and contribute to low income and food insecurity which in turn exacerbates poor health. Besides the risk for nutrition-related diseases such as allergies, diabetes mellitus, hypertension and cardiac disease( Reference Vozoris and Tarasuk 31 , Reference Gucciardi, Vogt and DeMelo 32 ), individuals experiencing food insecurity have poorer self-rated health( Reference Vozoris and Tarasuk 31 ) as well as poorer oral health( Reference Muirhead, Quiñonez and Figueiredo 33 ); food insecurity has also been linked to mental health disorders( Reference Vozoris and Tarasuk 31 , Reference Whitaker, Phillips and Orzol 34 ). Physical and mental health have important impacts on the labour market, affecting the capacity to work, labour force participation, wages and job security, and job choice( Reference Currie and Madrian 35 ). Furthermore, poor health may deepen disparities in labour force participation among disadvantaged groups, such as members of visible minorities, lone parent-led households and workers of lower socio-economic status( Reference Bound, Schoenbaum and Waidmann 36 , Reference Wolfe and Hill 37 ). Therefore, the disadvantages associated with food insecurity may affect worker health and productivity due to increases in worker absenteeism, stress and social exclusion( Reference Hamelin, Habicht and Beaudry 38 ).
From our current analysis, workers in food-insecure households are more likely to work multiple jobs, likely contributing to extended or irregular hours, and to report higher job stress compared with workers in food-secure households. Non-standard work hours (i.e. shift work) are thought to lead to poor health due to disruption in circadian rhythms and changes in lifestyles( Reference Knutsson 39 , Reference Härmä, Tenkanen and Sjöblom 40 ), and have been associated with CVD( Reference Bøggild and Knutsson 41 , Reference Knutsson, Akerstedt and Jonsson 42 ), hypertension( Reference Morikawa, Nakagawa and Miura 43 ), gastrointestinal disorders( Reference Tüchsen, Jeppesen and Bach 44 ) and cancer( Reference Megdal, Kroenke and Laden 45 ). Work-related stress is also a significant concern in the labour force, and considerable research has focused on the link between work stress and poor health/well-being. It has also been associated with CVD( Reference Backé, Seidler and Latza 46 ), migraines and mental disorders( Reference Clark, Pike and McManus 47 ), as well as poor health behaviors such as smoking and sleep disruption( Reference Shirom 48 ). Work stress can be defined as a combination of different elements such as job strain, physical demands, job security, co-worker and supervisor support( Reference Wilkins and Beaudet 49 ). Our measure of work stress is self-reported; therefore, we cannot attribute our results to any or all of these individual elements. However, because stress itself can lead to poor health, the increased work stress reported by workers experiencing food insecurity is concerning. Given the association with work stress and multiple jobs, workers living in food-insecure households may be a group particularly vulnerable to poor health outcomes.
In the current study, workers residing in Quebec were less likely to report food insecurity relative to other provinces, a result observed independent of education level. Quebec is considered to be a more socially progressive province than the rest of the country with policies that buttress a social economy( Reference Neamtan 50 , Reference Mendell 51 ); this is likely reflected in Quebec having one of the lowest provincial rates of food insecurity in Canada( 8 ). In addition, Quebec has the lowest percentage of food insecurity among many of the vulnerable groups highlighted in the present study( 52 ). In 2004, the province of Quebec enacted its Government Action Plan to Combat Poverty and Social Exclusion( 53 ). Under this Action Plan, wage subsidization for low-waged workers was substantial. For example, from 2004 to 2007, a lone parent with a child under the age of 3 years working full time at minimum wage would have had a 23·3 % increase in disposable income( 53 ). Because low-income families are constrained by a limited budget and devote a substantial portion of their monthly budget to food( Reference Kirkpatrick and Tarasuk 54 ), changes in disposable income such as those realized by lone mothers in Quebec likely impacted food expenditures and reduced food insecurity( Reference Tarasuk 55 , Reference Vozoris, Davis and Tarasuk 56 ).
To our knowledge, the present study is the first in-depth one to describe food insecurity within Canadian working households. The CCHS questionnaire has a limited set of labour force questions. It would have been helpful to have more information about work conditions, regularity of hours and income volatility. Despite these limitations, our results do show that the sociodemographic characteristics of working households experiencing food insecurity are similar to those of the general population, indicating that food insecurity is a systemic problem within Canada that is not fully resolved by encouraging persons to leave social assistance for paid employment. Less educated workers are particularly vulnerable, likely due to both low income and earnings volatility. Consequently, if the federal and provincial governments continue their agenda of addressing poverty through labour market initiatives, governments need to also address the employment conditions, earnings levels and variability, particularly for workers with lower education levels. Given the lower risk of food insecurity for households reliant on employment earnings in Quebec, the social, labour and economic policies of this province may provide a guide for other governments.
Acknowledgements
Source of funding: The study was supported by the Canadian Institutes of Health Research (operating grant number: MOP-89731). Conflicts of interest: No conflicts of interest declared. Authors’ contributions: L.M. was responsible for overall design and execution of the study. A.C.B. led manuscript drafting and provided advice on analyses. J.C.H.E. suggested the analytic direction, interpretation of results and provided substantive contributions to the manuscript. Acknowledgements: The authors thank Olayemi Olabiyi, Jesse Matheson and Chantal Hansen for their technical assistance.


