


Abstract
Background: Vitamin D fortification of non–cow’s milk beverages is voluntary in North America. The effect of consuming non–cow’s milk beverages on serum 25-hydroxyvitamin D levels in children is unclear. We studied the association between non–cow’s milk consumption and 25-hydroxyvitamin D levels in healthy preschool-aged children. We also explored whether cow’s milk consumption modified this association and analyzed the association between daily non–cow’s milk and cow’s milk consumption.
Methods: In this cross-sectional study, we recruited children 1–6 years of age attending routinely scheduled well-child visits. Survey responses, and anthropometric and laboratory measurements were collected. The association between non–cow’s milk consumption and 25-hydroxyvitamin D levels was tested using multiple linear regression and logistic regression. Cow’s milk consumption was explored as an effect modifier using an interaction term. The association between daily intake of non–cow’s milk and cow’s milk was explored using multiple linear regression.
Results: A total of 2831 children were included. The interaction between non–cow’s milk and cow’s milk consumption was statistically significant (p = 0.03). Drinking non–cow’s milk beverages was associated with a 4.2-nmol/L decrease in 25-hydroxyvitamin D level per 250-mL cup consumed among children who also drank cow’s milk (p = 0.008). Children who drank only non–cow’s milk were at higher risk of having a 25-hydroxyvitamin D level below 50 nmol/L than children who drank only cow’s milk (odds ratio 2.7, 95% confidence interval 1.6 to 4.7).
Interpretation: Consumption of non–cow’s milk beverages was associated with decreased serum 25-hydroxyvitamin D levels in early childhood. This association was modified by cow’s milk consumption, which suggests a trade-off between consumption of cow’s milk fortified with higher levels of vitamin D and non–cow’s milk with lower vitamin D content.
See related commentary on page 1277 and at www.cmaj.ca/lookup/doi/10.1503/cmaj.141197
Goat’s milk and plant-based milk alternatives made from soy, rice, almonds, coconut, hemp, flax or oats (herein called “non–cow’s milk”) are increasingly available on supermarket shelves. Many consumers may be switching from cow’s milk to these beverages.1–3 Parents may choose non–cow’s milk beverages for their children because of perceived health benefits. However, it is unclear whether they offer health advantages over cow’s milk or, alternatively, whether they increase the risk of nutritional inadequacy.
In the United States and Canada, cow’s milk products are required to contain about 40 IU of vitamin D per 100 mL, making it the major dietary source of vitamin D for children.4–8 The only other food source with mandatory vitamin D fortification in Canada is margarine, which is required to contain 53 IU per 10 mL (10 g).5 Fortification of non–cow’s milk beverages with vitamin D is also possible, but it is voluntary in both countries. Furthermore, there is little regulation on the vitamin D content even if such beverages are fortified.5,6,9
We conducted a study to test the association between total daily consumption of non–cow’s milk and serum 25-hydroxyvitamin D levels in a population of healthy urban preschool-aged children attending routinely scheduled well-child visits. We hypothesized that vitamin D stores would be lower in children who consume non–cow’s milk. The secondary objectives were to explore how consumption of cow’s milk might modify this association and to study the association between daily intake of non–cow’s milk and cow’s milk.
Methods
Study design and participants
We conducted a cross-sectional observational study through the TARGet Kids! (The Applied Research Group for Kids) practice-based research network in Toronto (latitude 43.4°N). TARGet Kids! is a collaboration between child health researchers in the Faculty of Medicine at the University of Toronto and primary care physicians in the university’s Department of Paediatrics and Department of Family and Community Medicine.10
Children 1–6 years of age were recruited from 7 pediatric or family medicine primary care practices during routinely scheduled well-child visits between December 2008 and September 2013. We excluded children who had a condition affecting growth (e.g., failure to thrive, cystic fibrosis), a chronic illness (excluding asthma) or severe developmental delay.
Data collection
Data were collected from parents by a trained research assistant at each participating practice using a standardized data-collection form adapted from the Canadian Community Health Survey.11 The research assistants also obtained physical measurements of the children. Venous blood sampling was performed by a trained phlebotomist, and daily samples were sent to the Clinical Biochemistry Laboratory at Mount Sinai Hospital in Toronto.
The total serum 25-hydroxyvitamin D level, the primary outcome measure, was determined with the use of a 2-step competitive chemiluminescence assay (LIAISON 25 OH Vitamin D TOTAL Assay; DiaSorin). This machine has been extensively tested and validated to show an intra-assay imprecision of 7.2% at a concentration of 213 nmol/L, and an interassay imprecision of 4.9% at 32 nmol/L, 8.9% at 77 nmol/L and 17.4% at 213 nmol/L, values that are well within acceptable limits for biochemical measurements.12,13 Our primary exposure variable was the total consumption of non–cow’s milk per day. The amount was determined from the response to the following standardized question on the data-collection form: “How many 250-mL cups of non–cow’s milk (soy, rice, goat, etc.) does your child have currently in a typical day?”
The research assistants collected data on the following prespecified covariates hypothesized to influence the association between total consumption of non–cow’s milk and 25-hydroxyvitamin D levels: age, sex, body mass index (BMI) z score, daily vitamin D supplementation, consumption of cow’s milk, consumption of margarine, skin pigmentation, outdoor play time and date of laboratory testing. Weight was measured with a baby scale for children under the age of 2 years and a precision digital scale (Seca model 703, measurement accuracy ± 0.025%; Seca) for older children. The length of children under the age of 2 was measured with a calibrated length board; the height of older children was measured with a calibrated stadiometer (Seca). BMI was calculated using the standard formula (weight/height2, where weight is measured in kilograms, and height is measured in metres).14,15 The BMI z score was calculated with the use of the World Health Organization growth curves.16 These curves are recommended for use in this age group in Canada because they reflect optimal growth in children.17,18 Daily vitamin D supplementation was determined from the data-collection form as the daily use of a vitamin D supplement or multivitamin; all children’s over-the-counter multivitamins in Canada contain a dose of 400 IU.19 The amount of cow’s milk consumed daily was determined from the response to the following question on the form: “How many 250-mL cups of cow’s milk does your child have currently in a typical day?” Margarine consumption (Yes or No) was determined according to whether the child ate margarine in the 3 days before the well-child visit. The research assistants used the Fitzpatrick scale, a skin pigmentation classification system used commonly in dermatologic research, to measure skin pigmentation.20 Outdoor playtime was the number of hours per week spent outside playing, as reported on the form.
Statistical analysis
Descriptive statistics were performed for the primary exposure and outcome variables and the covariates with the use of t tests for continuous variables and χ2 tests for categorical variables. A univariable linear regression model was used to determine the unadjusted association between the primary exposure (total consumption of non–cow’s milk) and the primary outcome (serum 25-hydroxyvitamin D level).
For our primary analysis, we developed a multiple linear regression model to test the association between total consumption of non–cow’s milk and 25-hydroxyvitamin D levels, adjusted for prespecified and clinically relevant covariates (listed in the preceding section). To account for the seasonal effect on 25-hydroxyvitamin D levels, a sinusoidal function was applied to the date of laboratory testing. All covariates were included in the final model regardless of statistical significance to avoid biased regression coefficients and standard errors and to avoid artificially inflated R2 values.21 To explore whether consumption of cow’s milk modified the association between the primary exposure and outcome, we tested the interaction between total consumption of non–cow’s milk and any cow’s milk consumption at a significance level of α = 0.05. We also explored the risk of having a low 25-hydroxyvitamin D level (< 50 nmol/L) using an adjusted logistic regression model.22,23
For our secondary analysis, we developed a multiple linear regression model to explore the association between non–cow’s milk consumption and cow’s milk consumption (measured in 250-mL cups per day), adjusted for age and sex. To ensure the variables in the models produced independent effects, we assessed multicolinearity for all covariates using the variance inflation factor. This factor is a measure of the degree of inflation in the standard errors of regression coefficients when multicolinearity exists (i.e., variance inflation factor > 5).24,25 All variance inflation factors were below 5.
Residual plots of serum 25-hydroxyvitamin D levels against total consumption of non–cow’s milk were used to assess linearity of the association between the primary exposure and the primary outcome. The outcome variable, 25-hydroxyvitamin D level, was positively skewed and was log-transformed, which resulted in a normal distribution. Model checking with the use of residual analysis on the transformed outcome indicated a good fit. No variable had more than 12% missing data. However, to overcome biases that can result from missing data, multiple imputation was performed.21 Models were run on 50 imputed datasets, and the results of the individual analyses were combined to obtain valid statistical inferences in the final analysis.21 Because the outcome variable, 25-hydroxyvitamin D level, had minimal missing data (6%), we did not impute missing data for it.21
All statistical analyses were conducted with the use of SAS 9.3 for Windows and R Studio version 0.95.
Ethics approval
The study was approved by the Hospital for Sick Children and St. Michael’s Hospital Research Ethics Boards. Consent was obtained from the parents of all children participating in the study.
Results
Of the 4523 children who met the inclusion criteria and for whom consent was obtained, 2831 were included in the study because they had undergone laboratory testing (Figure 1). Baseline characteristics of the participants and nonparticipants are shown in Table 1. The participants appeared to have lighter skin pigmentation and higher vitamin D supplementation than the children not included in the analysis. Otherwise, the 2 groups appeared clinically similar. The mean age of the participants was 2.9 years (standard deviation 1.5), and 52.6% were male. Vitamin D supplementation was noted for 52.4% of the children, and the median 25-hydroxyvitamin D level was 80 (interquartile range 66–99) nmol/L. Among the participants whose milk consumption was known, 85.4% drank cow’s milk daily and 12.3% drank non–cow’s milk daily. The 25-hydroxyvitamin D level was below 50 nmol/L in 11.0% of the children who drank only non–cow’s milk and in 4.7% of those who drank only cow’s milk.

Selection of patients for the study.
Baseline characteristics of children who participated in the study and nonparticipants
In the univariable analysis, each 250-mL cup of non–cow’s milk consumed was associated with a 3.1% (p = 0.005) decrease in 25-hydroxyvitamin D level (Figure 2). For example, an increase in non–cow’s milk consumption from 0 to 1 cup was associated with a decrease in the 25-hydroxyvitamin D level of 2.5 nmol/L (95% confidence interval [CI] 0.9 to 5.2 nmol/L).
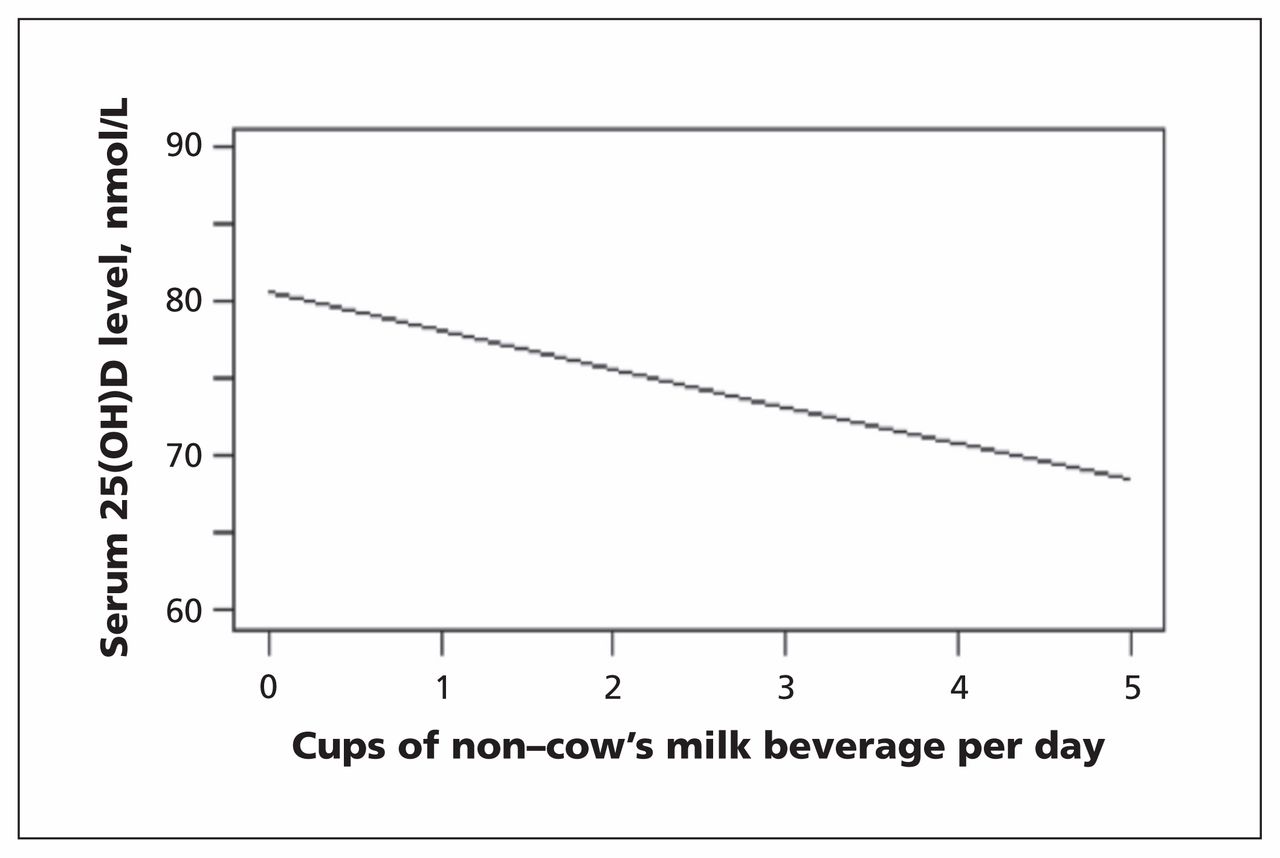
Unadjusted association between consumption of non–cow’s milk beverages and serum 25-hydroxyvitamin D (25[OH]D) levels among children 1 to 6 years of age.
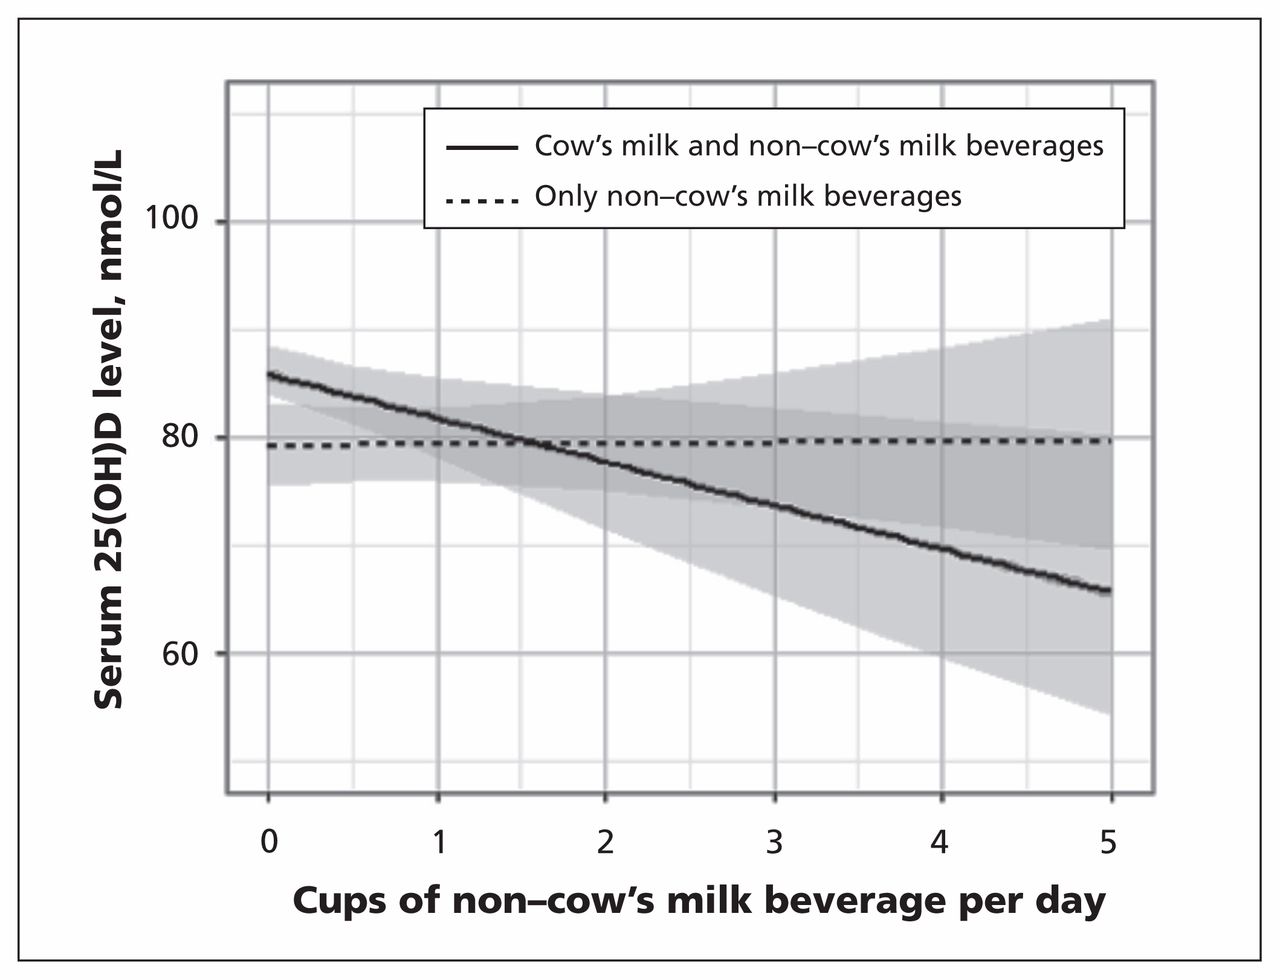
Results for our primary analysis using multiple linear regression are shown in Table 2. The interaction between total consumption of non–cow’s milk beverages and consumption of any cow’s milk was statistically significant (p = 0.03), which suggested that drinking cow’s milk was an effect modifier of the association between total non–cow’s milk consumption and 25-hydroxyvitamin D levels (Figure 3). After adjusting for clinically relevant covariates, we found that each additional 250-mL cup of non–cow’s milk beverage consumed by children who also drank cow’s milk was associated with a 5.1% (p = 0.008) decrease in the 25-hydroxyvitamin D level and a drop in the median 25-hydroxyvitamin D level of 4.2 nmol/L (95% CI 1.1 to 7.1 nmol/L) (Table 2). Statistically significant covariates (p < 0.001) included vitamin D supplementation, which was associated with increased 25-hydroxyvitamin D levels, and not drinking cow’s milk and having dark skin pigmentation, which were associated with decreased serum levels. These covariates did not change the parameter estimate for 25-hydroxyvitamin D by more than 15% when individually removed from the model, which suggested that they were not confounders of the association between total non–cow’s milk consumption and 25-hydroxyvitamin D levels.
Association between consumption of non–cow’s milk and 25-hydroxyvitamin D levels

Adjusted* association between total consumption of non–cow’s milk beverages and serum 25(OH)D (25-hydroxyvitamin D) levels among children drinking only non–cow’s milk and among those drinking both non–cow’s milk and cow’s milk products. *Adjusted for age, sex, body mass index z score, vitamin D supplementation, margarine consumption, level of skin pigmentation, outdoor play time, season, and cow’s milk consumption as an effect modifier. Screened areas = 95% confidence intervals.
In the logistic regression model, children who drank only non–cow’s milk beverages were at higher risk of having a 25-hydroxyvitamin D level below 50 nmol/L than children who drank only cow’s milk (odds ratio 2.7, 95% CI 1.6 to 4.7).
In our secondary analysis, the age- and sex-adjusted multiple linear regression showed an inverse association between total daily intake of non–cow’s milk beverages and cow’s milk (Figure 4). Each additional 250-mL cup of non–cow’s milk consumed was associated with a 0.5-cup decrease in consumption of cow’s milk in both the unadjusted and adjusted regression analyses (95% CI 0.4 to 0.6 cups in the adjusted analysis).

Adjusted* association between daily consumption of non–cow’s milk beverages and daily consumption of cow’s milk. *Adjusted for age and sex.
Interpretation
More than 10% of the children in our study drank non–cow’s milk beverages on a regular basis. We identified an independent association between non–cow’s milk consumption and decreased serum 25-hydroxyvitamin D levels in early childhood, and the association appeared to be modified by cow’s milk consumption. Children who drank only non–cow’s milk were more than twice as likely as children who drank only cow’s milk to have a 25-hydroxyvitamin D level below 50 nmol/L. Among children who drank both types of milk, each additional cup of non–cow’s milk beverage consumed was associated with a 5% decrease in 25-hydroxyvitamin D level. This association was consistent with our finding of an inverse association between non–cow’s milk and cow’s milk consumption and suggests a trade-off between consumption of cow’s milk fortified with higher levels of vitamin D and non–cow’s milk with lower vitamin D content.
Fortified cow’s milk has been identified as the main dietary source of vitamin D in early childhood,7,8,26–29 with about a 5-nmol/L increase in 25-hydroxyvitamin D level per 250-mL cup of cow’s milk consumed.30–32 Substitution of cow’s milk with non–cow’s milk beverages that have a lower vitamin D content could put children at unnecessary risk of complications from low dietary intake of vitamin D. Several case studies have identified severe rickets from vitamin D deficiency in children who did not drink cow’s milk and had not been taking vitamin D supplements.33–39
One strategy to increase vitamin D intake is targeted vitamin D supplementation. Alternatively, standardized, legislated vitamin D content for all milk products, including non–cow’s milk beverages, could level the vitamin D gradient between children who drink cow’s milk and those who drink non–cow’s milk products.40 According to the Food and Drug Regulations of Canada, the term “milk” can be used only on products obtained from a cow and fortified with vitamin D.6 Thus, non–cow’s milk products are commonly labelled as “beverages” without the inclusion of the term milk and therefore fall outside the scope of legislation for vitamin D content and monitoring.
Strengths and limitations
Strengths of our study include its relatively large sample from an ethnically diverse population of healthy young urban children with rich clinical and laboratory data, which allowed us to take into account a range of clinically important potential confounders.
Limitations of our study include its cross-sectional design, from which causality cannot be determined. Parent-reported measurements of survey data may have been susceptible to recall bias. Children included in the study had lighter skin pigmentation and higher vitamin D supplementation than the nonparticipants had; thus, our findings may not be generalizable to children from other urban areas or from nonurban areas who may be at higher risk of vitamin D deficiency. However, the median serum 25-hydroxyvitamin D level was similar to the median levels in other population-based studies of this age group.26,41
Conclusion
We identified a dose-dependent association between consumption of non–cow’s milk beverages in early childhood and decreased serum levels of 25-hydroxyvitamin D. This association was modified by cow’s milk consumption, which suggests a trade-off between the consumption of cow’s milk fortified with higher levels of vitamin D and non–cow’s milk beverages with lower vitamin D content. Our findings may be helpful for health care providers caring for children who drink non–cow’s milk beverages because of an allergy to cow’s milk, lactose intolerance or a dietary preference. Improved education regarding nutrition labels is important to ensure that non–cow’s milk products fortified with vitamin D are being chosen by parents and caregivers, and improved package labelling may help parents make informed decisions about healthy beverages for their children. Standardization of vitamin D content of both cow’s milk and non–cow’s milk products would make decisions simpler. Future research on the type and brand of non–cow’s milk products is needed to understand better the association between consumption of specific types of non–cow’s milk beverages and serum 25-hydroxyvitamin D levels in childhood.
Acknowledgements
The authors thank all of the participating families and practitioners, and the pediatric and family medicine practices that are currently involved in the TARGet Kids! research network. They also thank the TARGet Kids! Collaboration Steering Committee (Tony Barozzino, Brian Chisamore, Mark Feldman and Moshe Ipp); the research team (Matthew D’Ascanio, Diviya Elango, Nadia Kabir, Kanthi Kavikondala, Tarandeep Malhi, Laurie Thompson and Mandy Tran); Magda Melo and Patricia Nguyen at the Applied Health Research Centre; and Azar Azad at the Mount Sinai Services Central Laboratory.
Footnotes
↵* Members of the TARGet Kids! Collaboration: Scientific Committee: Kawsari Abdullah, Laura N. Anderson, Catherine S. Birken, Cornelia M. Borkhoff, Sarah Carsley, Yang Chen, Matthew D’Ascanio, Mikael Katz-Lavigne, Kanthi Kavikondala, Grace Jieun Lee, Jonathon L. Maguire, Jessica Omand, Patricia C. Parkin, Navindra Persaud, Meta van den Heuvel, Weeda Zabih. Site investigators: Jillian Baker, Tony Barozzino, Joey Bonifacio, Douglas Campbell, Sohail Cheema, Brian Chisamore, Karoon Danayan, Paul Das, Mary Beth Derocher, Anh Do, Michael Dorey, Sloane Freeman, Keewai Fung, Charlie Guiang, Curtis Handford, Hailey Hatch, Sheila Jacobson, Tara Kiran, Holly Knowles, Bruce Kwok, Sheila Lakhoo, Margarita Lam-Antoniades, Eddy Lau, Fok-Han Leung, Jennifer Loo, Sarah Mahmoud, Rosemary Moodie, Julia Morinis, Sharon Naymark, Patricia Neelands, James Owen, Michael Peer, Marty Perlmutar, Navindra Persaud, Andrew Pinto, Michelle Porepa, Nasreen Ramji, Noor Ramji, Alana Rosenthal, Janet Saunderson, Rahul Saxena, Michael Sgro, Susan Shepherd, Barbara Smiltnieks, Carolyn Taylor, Thea Weisdors, Sheila Wijayasinghe, Peter Wong, Ethel Ying, Elizabeth Young.
Competing interests: None declared.
This article has been peer reviewed.
Contributors: Grace Lee and Jonathon Maguire conceptualized and designed the research study. Catherine Birken, Patricia Parkin, Jonathon Maguire, Yang Chen, Grace Lee and Mary L’Abbé assisted in refining the study design. Grace Lee, Jonathon Maguire and Grace Lee contributed to the analysis and interpretation of the data. Grace Lee and Jonathon Maguire drafted the manuscript. All of the authors contributed to the revision of the manuscript, approved the final version submitted for publication and agreed to act as guarantors of the work.
Funding: Funding of the TARGet Kids! research network was provided by the Canadian Institutes of Health Research (CIHR) Institute of Human Development, Child and Youth Health, the CIHR Institute of Nutrition, Metabolism and Diabetes, and the St. Michael’s Hospital Foundation. The Paediatric Outcomes Research Team is supported by a grant from The Hospital for Sick Children Foundation. The funding agencies had no role in the design and conduct of the study, the collection, management, analysis and interpretation of the data, or the preparation, review and approval of the manuscript.
References
In this issue
Article tools


Jump to section
Related Articles
Cited By...
More in this TOC Section
Similar Articles
Collections

