


Article Figures & Tables
Figures
- Figure 1:
Number of people entering the study cohort each year from 1985 to 2013, stratified by the WHO-estimated TB incidence in the country of birth (n = 1 080 908). Note: TB = tuberculosis, WHO = World Health Organization.
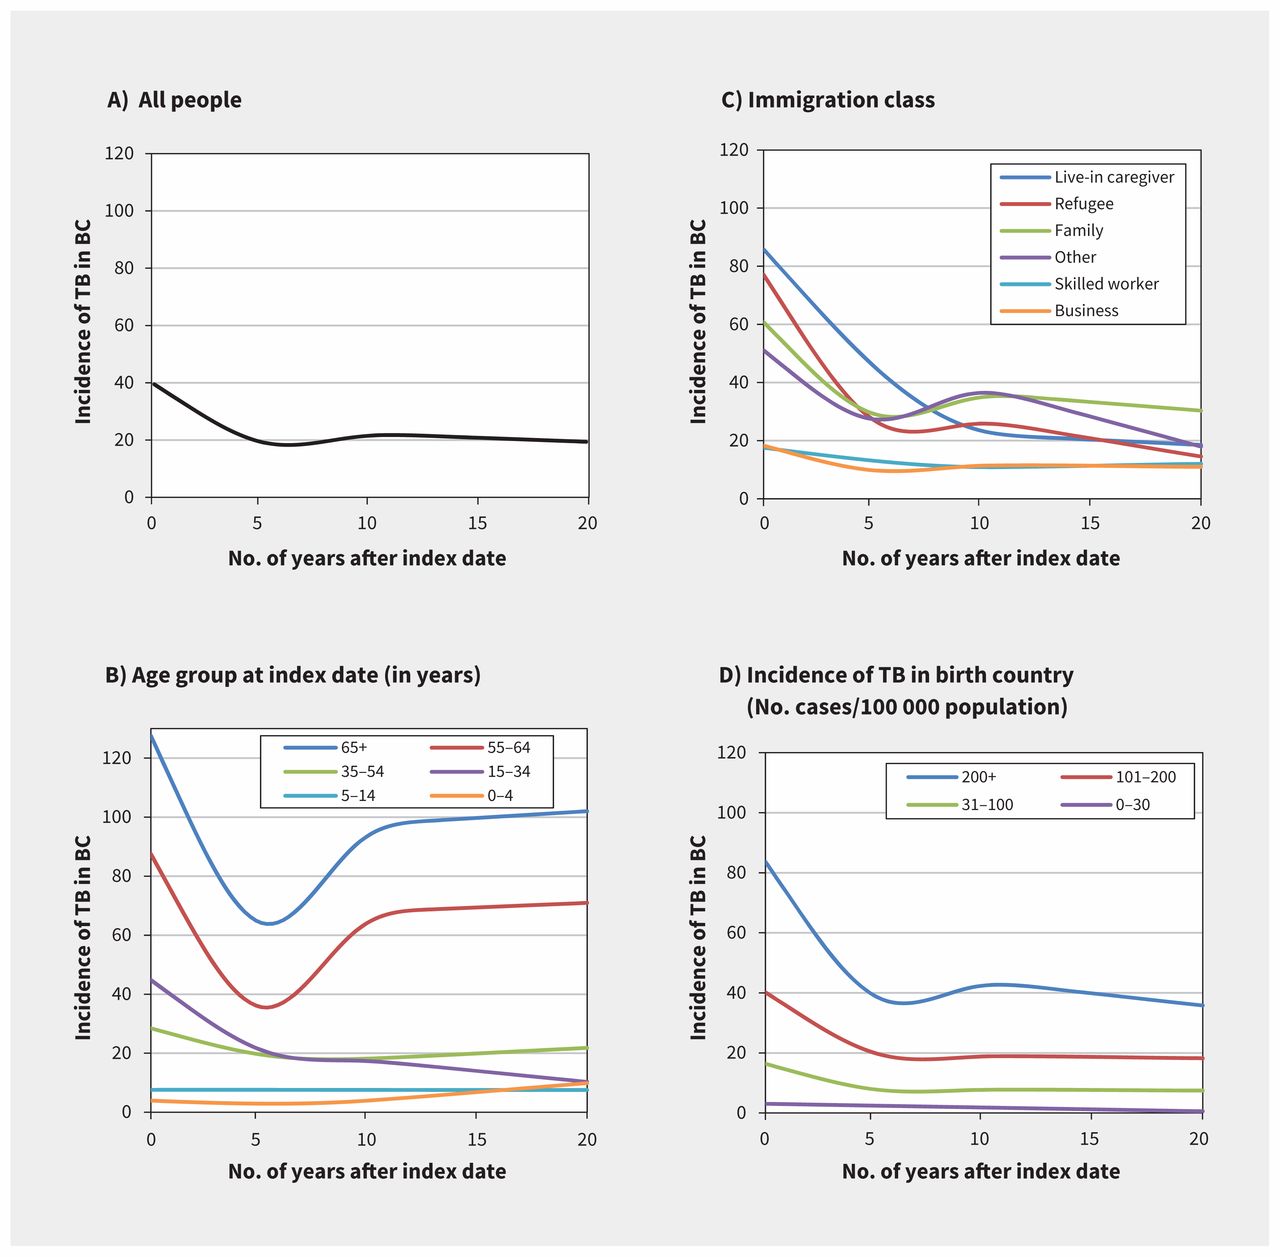
- Figure 2:
Incidence of TB among migrants in BC (no. of cases/100 000 person-years at risk), stratified by the number of years since index date and demographic characteristics. (A) All participants, (B) age group, (C) immigration class and (D) incidence of TB in the country of birth. Rates of TB incidence (no. of TB cases/100 000 person-years) modelled as a smooth function of the number of years since index date using generalized additive models, with time represented as a cubic regression spline (degrees of freedom = 4) with knots set to the 30th, 50th, 70th and 90th percentiles of time (in accumulated person-years). Note: BC = British Columbia, TB = tuberculosis.
- Figure 3:
Kaplan–Meier curves of 10-year TB outcomes within population subgroups identified by recursive partitioning models (plot shows the groups with highest TB yield). Analysis included participants with index years from 1985 to 2003 and aged less than 65 years at index date (n = 676 294). Note: inc = World Health Organization estimate for TB incidence in country of birth in index year (no. of TB cases [all forms]/100 000 population), TB = tuberculosis.


Tables
- Table 1:
Characteristics of people in the study cohort at index date, and incidence rates of tuberculosis during study follow-up
Characteristic No. of people in the cohort (%)
n = 1 080 908No. of person-years (1000s)
n = 11 640No. of cases of TB in BC*
n = 2814No. of cases of TB/100 000 person-years (95% CI) All 24.2 (23.3–25.1) Age group, yr 0–4 45 998 (4.3) 520 22 4.2 (2.7–6.4) 5–14 152 560 (14.1) 1756 129 7.3 (6.1–8.7) 15–34 453 538 (42.0) 4858 1132 23.3 (22.0–24.7) 35–54 327 781 (30.3) 3434 743 21.6 (20.1–23.2) 55–64 59 256 (5.5) 669 419 62.6 (56.8–68.9) ≥ 65 41 775 (3.9) 403 369 91.6 (82.5–101.4) Sex Female 553 976 (51.3) 6071 1391 22.9 (21.7–24.1) Male 526 932 (48.8) 5569 1423 25.6 (24.2–26.9) Immigration class Business† 168 357 (15.6) 1915 240 12.5 (11.0–14.2) Skilled worker† 440 778 (40.8) 4295 573 13.3 (12.3–14.5) Live-in caregiver† 28 640 (2.7) 278 129 46.4 (38.7–55.1) Refugee‡ 86 803 (8.0) 1069 362 33.9 (30.5–37.5) Family 326 106 (30.2) 3723 1387 37.3 (35.3–39.3) Other§ 30 224 (2.8) 359 123 34.3 (28.5–40.9) WHO Region of birth¶ Southeast Asia 153 061 (14.2) 1631 698 42.8 (39.7–46.1) Africa 31 161 (2.9) 320 101 31.6 (25.7–38.4) Western Pacific 586 669 (54.3) 6476 1773 27.4 (26.1–28.7) Eastern Mediterranean 84 057 (7.8) 778 134 17.2 (14.4–20.4) The Americas 80 297 (7.4) 839 49 5.8 (4.3–7.7) Europe 145 661 (13.5) 1595 59 3.7 (2.8–4.8) TB rate in country of birth** 0–30 cases/100 000 population 186 165 (17.2) 1733 37 2.1 (1.5–2.9) 31–100 cases/100 000 population 278 081 (25.7) 2582 249 9.6 (8.5–10.9) 101–200 cases/100 000 population 340 901 (31.5) 4067 952 23.4 (21.9–24.9) > 200 cases/100 000 population 275 759 (25.5) 3257 1576 48.4 (46.0–50.8) Index year 1985–1994 299 501 (27.7) 5051 1386 27.4 (26.0–28.9) 1995–2004 443 941 (41.1) 5032 1084 21.5 (20.3–22.9) 2005–2013 337 466 (31.2) 1556 344 22.1 (19.8–24.6) Note: BC = British Columbia, CI = confidence interval, TB = tuberculosis. Missing data: country of birth (n = 2).
↵* Includes respiratory (70%) and nonrespiratory (30%) TB sites.
↵† Economic immigration classes include both principal applicants and their dependents.
↵‡ Includes government-assisted (46%), privately sponsored (26%), asylum (22%) and dependents abroad (6%).
↵§ Includes retirees (57%), deferred removal orders and postdetermination refugee claimants in Canada (7%), permit holders applying for permanent residence (3%), and humanitarian and compassionate cases (36%).
↵¶ Countries/territories in each WHO Health Region (based on most person-time spent in BC): Southeast Asia (India, Sri Lanka, Indonesia), Africa (South Africa, Kenya, Ethiopia), Western Pacific (China, Hong Kong, Philippines), Eastern Mediterranean (Iran, Pakistan, Afghanistan), Americas (United States, El Salvador, Mexico), Europe (United Kingdom and colonies, Poland, Germany) (Appendix 1, supplemental Table 1 [available at www.cmaj.ca/lookup/suppl/doi:10.1503/cmaj.170817/-/DC1] provides a more extensive list).
↵** Values are World Health Organization estimates for an individual’s year of index = number of TB cases (all forms)/100 000 population.
In this issue
Article extras
Article tools


Jump to section
Related Articles
Cited By...
More in this TOC Section
Similar Articles
Collections

