


Article Figures & Tables
Figures
- Figure 1:
Study cohorts. For the psychiatrist cohort, the n values refer to unique psychiatrists. Note: ED = emergency department.
- Figure 2:
Mean monthly number of eligible psychiatrist visits: 30 days after discharge from psychiatric hospital admission (top) and 180 days after a suicide attempt (bottom).
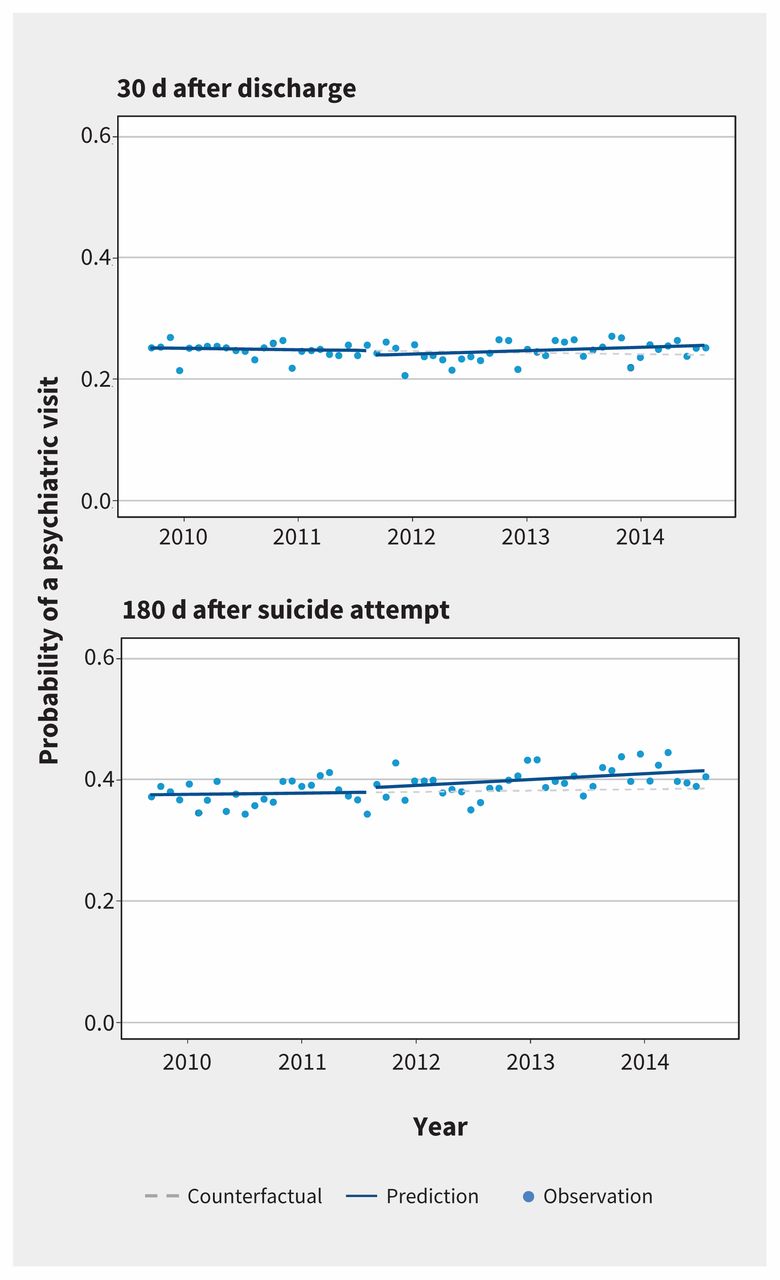
- Figure 3:
Probability of a psychiatric visit: 30 days after discharge from a psychiatric hospital admission (top) and 180 days after a suicide attempt (bottom).


Tables
- Table 1:
Descriptive statistics for psychiatrist cohort before and after implementation of incentives*
Covariable Before incentive† After incentive‡ Full sample Lowest quintile§ Highest quintile§ Full sample Lowest quintile§ Highest quintile§ No. of observations 45 024 9360 9000 66 900 13 356 13 680 Sex, female, % 38.7 (38.2 to 39.1) 47.1 (46.0 to 48.1) 28.7 (27.7 to 29.6) 38.9 (38.5 to 39.3) 47.8 (47.0 to 48.6) 28.5 (27.8 to 29.3) Age, yr, mean 54.7 (54.6 to 54.8) 58.3 (58.0 to 58.5) 51.7 (51.5 to 51.9) 56.7 (56.6 to 56.8) 59.8 (59.6 to 60.0) 53.8 (53.7 to 54.0) Rural practice, % 21.9 (21.5 to 22.3) 13.3 (12.6 to 14.0) 38.5 (37.5 to 39.5) 22.3 (21.9 to 22.6) 13.5 (12.9 to 14.1) 38.9 (38.0 to 39.7) Canadian medical graduate, % 61.9 (61.4 to 62.3) 70.0 (69.1 to 70.9) 51.7 (50.7 to 52.7) 62.1 (61.7 to 62.5) 71.7 (70.9 to 72.5) 51.2 (50.4 to 52.1) Full-time practice, % 72.2 (71.8 to 72.6) 48.6 (47.6 to 49.6) 94.1 (93.6 to 94.6) 71.8 (71.4 to 72.1) 49.0 (48.1 to 49.8) 94.1 (93.7 to 94.5) No. of outpatients seen/yr 187.7 (185.6 to 189.8) 53.8 (52.5 to 55.0) 336.8 (330.9 to 342.6) 202.0 (200.2 to 203.8) 57.2 (56.0 to 58.4) 372.4 (367.5 to 377.3) No. of outpatient visits/mo 94.5 (93.7 to 95.3) 56.4 (54.9 to 57.8) 152.4 (150.1 to 154.6) 90.5 (89.8 to 91.2) 53.9 (52.8 to 55.0) 148.1 (145.9 to 150.2) No. of patients seen/yr with psychiatric hospital admission in previous year 33.2 (32.7 to 33.8) 2.3 (2.1 to 2.4) 99.7 (97.8 to 101.6) 36.3 (35.9 to 36.8) 3.6 (3.4 to 3.9) 106.0 (104.4 to 107.5) Outcome Postdischarge visits/mo per psychiatrist* Post–suicide attempt visits/mo per psychiatrist* Full sample Q1–Q3 providers Q4 and Q5 providers Full sample Q1–Q3 providers Q4 and Q5 providers Mean eligible visits/mo Before introduction of incentives 1.50 (1.47 to 1.53) 0.30 (0.29 to 0.31) 3.33 (3.23 to 3.43) 1.35 (1.32 to 1.38) 0.26 (0.25 to 0.27) 3.03 (2.93 to 3.12) After introduction of incentives 1.43 (1.41 to 1.46) 0.42 (0.40 to 0.44) 2.94 (2.85 to 3.03) 1.23 (1.21 to 1.26) 0.40 (0.38 to 0.43) 2.47 (2.40 to 2.54) Model estimates† Pre-incentive trend‡ −0.0045 (−0.0102 to 0.0011) −0.0008 (−0.0028 to 0.0011) −0.0100 (−0.0230 to 0.0029) −0.0071 (−0.0117 to −0.0023) −0.0010 (−0.0035 to 0.0004) −0.0171 (−0.0267 to −0.0057) Change in level after introduction of incentives§ 0.0099 (−0.0989 to 0.1206) 0.0862 (0.0506 to 0.1209) −0.0952 (−0.3211 to 0.1440) −0.0910 (−0.1885 to 0.0026) 0.0697 (0.0391 to 0.1244) −0.3075 (−0.5212 to −0.1210) Change in trend after introduction of incentives¶ 0.0032 (−0.0035 to 0.0095) 0.0030 (0.0006 to 0.0054) 0.00008 (−0.0152 to 0.0147) 0.0102 (0.0045 to 0.0159) 0.0056 (0.0027 to 0.0086) 0.0143 (0.0015 to 0.0259) Post-incentive trend** −0.0013 (−0.0050 to 0.0020) 0.0022 (0.0008 to 0.0035) −0.0098 (−0.0172 to −0.0032) 0.0030 (−0.0003 to 0.0062) 0.0046 (0.0021 to 0.0064) −0.0029 (−0.0091 to 0.0031) Note: Q1 to Q5 represent quintiles, where Q1 = lowest quintile and Q5 = highest quintile for the quantity of incentive-eligible services provided in the pre-incentive period.
↵* All estimates are presented with 95% confidence intervals.
↵† Confidence intervals on model estimates were calculated with bootstrap standard errors (using 1000 replications). All estimates are conditional on other model covariables (not reported).
↵‡ The monthly change in the mean number of visits before introduction of the incentives.
↵§ The level change in the mean monthly number of visits after introduction of the incentives.
↵¶ The change in the trend for mean monthly number of visits after introduction of the incentives, compared with the monthly trend before introduction of the incentives.
↵** The monthly change in the mean number of visits after introduction of the incentives.
Model estimate Probability of visiting psychiatrist (95% CI)* 30 d after psychiatric hospitalization discharge 180 d after suicide attempt Pre-incentive trend† −0.0002 (−0.0010 to 0.0006) 0.0002 (−0.0013 to 0.0012) Change in level after introduction of incentives‡ −0.0079 (−0.0223 to 0.0061) 0.0074 (−0.0094 to 0.0366) Change in trend after introduction of incentives§ 0.0007 (−0.0003 to 0.0016) 0.0006 (−0.0007 to 0.0022) Post-incentive trend¶ 0.0005 (0.0000 to 0.0009) 0.0009 (0.0001 to 0.0015) Note: CI = confidence interval.
↵* CIs on model estimates were calculated with bootstrap standard errors (using 1000 replications).
↵† The monthly change in the probability of a visit before introduction of the incentives.
↵‡ The level change in the probability of a visit after introduction of the incentives.
↵§ The change in the trend for probability of a visit after introduction of the incentives, compared with the monthly trend before introduction of the incentives.
↵¶ The monthly change in the probability of a visit after introduction of the incentives.
- Table 4:
Number of psychiatrists who billed incentives and proportion of eligible visits with incentive code
Incentive code No. (%) of psychiatrists who billed code n = 1921 Group; % of eligible visits billed (95% CI) All psychiatrists Psychiatrists billing ≥ 1 incentive code K187 456 (23.7) 5.50 (5.33 to 5.67) 97.62 (97.31 to 97.94) K188 336 (17.5) 2.93 (2.80 to 3.06) 95.77 (95.20 to 96.34) K189 163 (8.5) 1.35 (1.26 to 1.44) 99.96 (99.91 to 100.00) Note: CI = confidence interval, K187 = incentive code for “acute post-discharge community psychiatric care,” K188 = incentive code for “high risk community psychiatric care,” K189 = incentive code for “urgent community psychiatric follow-up.”
In this issue

Article tools


Jump to section
Related Articles
Cited By...
- Pan-Canadian study of psychiatric care (PCPC): protocol for a mixed-methods study
- Association of physician financial incentives with primary care enrolment of adults with serious mental illnesses in Ontario: a retrospective observational population-based study
- Physician-based availability of psychotherapy in Ontario: a population-based retrospective cohort study
- Aligning innovations in health funding with innovations in care
- Financial incentives for physicians to improve health care
More in this TOC Section
Similar Articles

