


Article Figures & Tables
Figures
- Figure 1:
RISMA flow diagram. NNS = nonnutritive sweetener, RCT = randomized controlled trial. *Companion studies included abstracts, trial registrations and earlier reports from included studies.
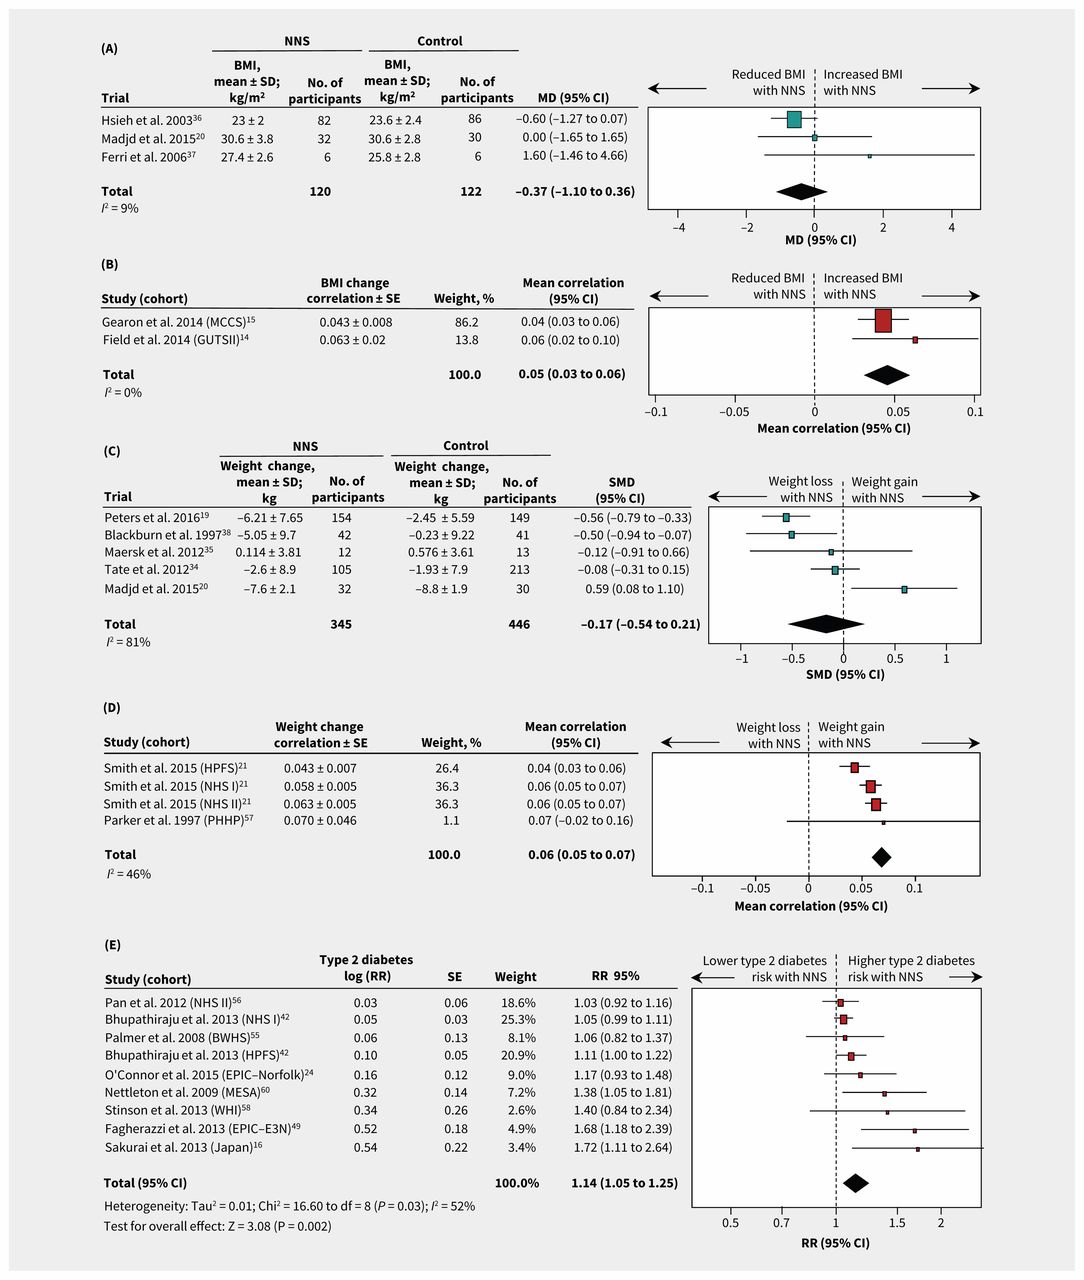
- Figure 2:
Forest plots of consumption of NNS and selected cardiometabolic health outcomes. (A) Differences in mean BMI between NNS consumption and control groups for RCTs. A value less than 0 represents reduced BMI with NNS consumption. (B) Correlaton of BMI change per unit of NNS intake for cohort studies. A value less than 0 represents a reduced BMI. (C) Standard mean differences in weight between NNS consumption and control groups for RCTs. A value less than 0.0 represents weight loss. (D) Correlation of weight change per unit NNS intake for cohort studies. A value less than 0 favours weight loss. (E) Incidence of type 2 diabetes for highest versus lowest quantiles of NNS intake in cohort studies. A value less than 1.0 represents a lower risk of type 2 diabetes. Additional outcomes are shown in Table 3, and Appendix 1, Figures S1–4. Squares represent effect estimates within each study, with 95% CIs represented by horizontal lines. Square size is proportional to the weight of each study. Diamonds represent the weighted mean effect estimates. Cohort acronyms are defined in Table 2. Note: BMI = body mass index, CI = confidence interval, MD = mean difference, NNS = nonnutritive sweetener, RCT = randomized controlled trial, RR = risk ratio, SD = standard deviation, SE = standard error, SMD = standardized mean difference.

Tables
- Table 1:
Randomized controlled trials that evaluated nonnutritive sweetener interventions and long-term cardiometabolic health
Study,* country No. of participants randomly assigned (%completed) Sex Population Age, mean ± SD; yr BMI, mean ± SD; kg/m2 Duration, mo Type and source of NNS Daily dose of NNS Comparator(s) Outcomes Risk of bias† BMI Weight Waist Body fat HOMA-IR Blackburn et al. 1997, (38) USA 163 (53) F Obese, on weight-loss program 44 ± 10 37 ± 5 16 Aspartame ASB, packets, foodstuffs Participants’ discretion Aspartame avoidance • High Hsieh et al. 2003, (36) China 174 (97) M, F Mild hypertension 52 ± 7 23 ± 3 24 Stevioside capsules 1500 mg Placebo • Low Ferri et al. 2006, (37) Brazil 14 (86) M, F Mild hypertension 45 ± 7 27 ± 3 6 Stevioside capsules 3 phases: 3.8, 7.5, 15.0 mg/kg Placebo • • Unclear Tate et al. 2012, (34) USA 213 (86) M, F Overweight, on weight-loss program 42 ± 11 36 ± 6 6 Unspecified ASB Recommended ≥ 2 servings Water, attention control‡ • • High Maersk et al. 2012, (35) Denmark 33 (76) M, F Overweight 39 ± 8 33 ± 4 6 Aspartame ASB 1 L of diet cola Water • • • High Peters et al. 2016, (19) USA 308 (72) M, F Overweight, on weight-loss program 48 ± 11 34 ± 4 12 Unspecified ASB At least 710 mL Water with ASB avoidance • • High Madjd et al. 2015, (20) Iran 71 (87) F Overweight, on weight-loss program 32 ± 7 34 ± 3 6 Unspecified ASB 250 mL Water • • • • High Note: ASB = artificially sweetened beverage, BMI = body mass index, F = female, HOMA-IR = homeostatic model assessment for insulin resistance, M = male, NNS = nonnutritive sweetener, SD = standard deviation.
↵* Sorted by year of publication.
↵† Risk of bias was assessed using the Cochrane Risk of Bias tool. (30) See Appendix 1, Table S3 for detailed risk of bias results for quality assessment.
↵‡ Data from multiple comparator groups were combined.
- Table 2:
Prospective cohort studies evaluating intake of nonnutritive sweetener and long-term cardiometabolic health
Study* Cohort Country, year of baseline NNS intake No. of participants Sex Age at baseline, mean ± SD, or range; yr BMI at baseline, mean ± SD, or % OW; kg/m2 Follow-up, yr Type or source of NNS Extreme NNS intake categories, servings† Measure of continuous NNS intake Outcome BMI Weight Overweight/obesity Metabolic syndrome Type 2 diabetes Hypertension Other Quality score‡ Lutsey et al. 2008 (54) ARIC USA, 1987 9154 M, F 54 ± 6 – 9 AS soda Extreme tertiles – • 8 Bomback et al. 2010 (43) ARIC USA, 1987 14 002 M, F 54 ± 6 28 ± 5 9 AS soda > 1/d v. < 1/d – CKD 9 Palmer et al. 2008 (55) BWHS USA, 2001 43 960 F 38 ± 10 28 ± 7 4 AS soda ≥ 1/d v. < 1/mo – • 6 Duffey et al. 2012 (48) CARDIA USA, 1986 3728 M, F 25 ± 26 25 ± 5 20 ASB None v. any – • • IGT 8 Haines et al. 2007 (59) EAT USA, 1998 2516 M, F 15 ± 2 11% OW 5 AS soda – serving/d • 7 Lana et al. 2015§ (22) ENRICA Spain, 2008 2030 M, F 18–60 26 ± 5 4 AS soda ≥ 1/d v. < 1/wk – • 9 Fagherazzi et al. 2013¶ (49) EPIC-E3N France, 1993 66 118 F 53 ± 7 19% OW 17 ASB > 603 mL/wk v. never – • 8 O’Connor et al. 2015¶ (24) EPIC-Norfolk UK, 1993 24 653 M, F 58 ± 9 26 ± 4 11 ASB ≥ 169 mL/d v. none serving/d • 8 Dhingra et al. 2007 (47) FOS USA, 1992 1864 M, F 55 ± 10 27 ± 5 4 AS soda 1/d v. < 1/wk – • 9 Field et al. 2014 (14) GUTS II USA, 2004 7559 M, F 13 ± 2 20 ± 3 3 AS soda – serving/d • 6 Bernstein et al. 2012 (40) HPFS USA, 1986 43 371 M 62 ± 11 26 ± 3 22 AS soda ≥ 1/d v. none serving/d Stroke 8 Bhupathiraju et al. 2013** (42) HPFS USA, 1986 39 059 M 53 ± 10 25 ± 5 22 AS soda ≥ 1/d v. < 1/mo serving/d • 7 Cohen et al. 2012 (45) HPFS USA, 1986 37 360 M 40–75 25 ± 3 22 ASB ≥ 1/d v. < 1/mo – • 8 de Koning et al. 2012 (46) HPFS USA, 1986 42 883 M 40–75 26 ± 3 22 ASB > 4/wk v. none serving/d CHD 8 Smith et al. 2015 (21) HPFS USA, 1986 21 472 M 47 ± 6 25 ± 1 24 AS soda – serving/d • 6 Gearon et al. 2014§ (15) MCCS Australia, 1990 13 697 M, F 55 ± 9 26 ± 4 13 AS soda – serving/wk • 8 Nettleton et al. 2009 (60) MESA USA, 2000 5011 M, F 62 ± 11 28 ± 6 5 AS soda ≥ 1/d v. rare or never – • • • Waist 6 Fung et al. 2009 (51) NHS I USA, 1980 88 520 F 34–59 24 ± 2 24 AS soda ≥ 2/d v. < 1/mo – CHD 8 Bernstein et al. 2012 (40) NHS I USA, 1980 84 085 F 58 ± 10 26 ± 5 28 AS soda ≥ 1/d v. none serving/d Stroke 8 Bhupathiraju et al. 2013 (42) NHS I USA, 1984 74 749 F 50 ± 7 25 ± 5 24 AS soda ≥ 1/d v. < 1/mo serving/d • 7 Cohen et al. 2012†† (45) NHS I USA, 1980 88 540 F 34–59 23 ± 3 38 ASB ≥ 1/d v. < 1/mo – • 8 Smith et al. 2015‡‡ (21) NHS I USA, 1986 48 449 F 49 ± 6 24 ± 1 24 AS soda – serving/d • 6 Pan et al. 2012§§ (56) NHS II USA, 1991 82 902 F 36 ± 5 24 ± 5 18 ASB ≥ 4/d v. ≤ 1/wk serving/d • 7 Chen et al. 2009 (44) NHS II USA, 1991 13 475 F 32 ± 3 23 ± 4 10 ASB ≥ 5/wk v. ≤ 3/mo serving/d GDM 8 Cohen et al. 2012†† (45) NHS II USA, 1991 97 991 F 27–42 23 ± 4 16 ASB ≥ 1/d v. < 1/mo – • 8 Smith et al. 2015 (21) NHS II USA, 1991 48 071 F 38 ± 4 23 ± 2 16 AS soda – serving/d • 6 Gardener et al. 2012 (52) NOMAS USA, 1993 2564 M, F 69 ± 10 28 ± 6 10 AS soda ≥ 1/d v. < 1/mo serving/wk CVD 7 Parker et al. 1997 (57) PHHP USA, 1986 465 M, F 47 ± 14 27 ± 5 4 Saccharin – log g/d • 9 Fowler et al. 2008 (50) SAHS USA, 1979 3371 M, F 44 ± 11 27 ± 6 8 ASB ≥ 22/wk v. none – • • 7 Fowler et al. 2015¶¶ (18) SALSA USA, 1992 384 M, F 70 ± 3 28 ± 5 9 AS soda ≥ 1/d v. none – Waist 5 Sakurai et al. 2013 (16) – Japan, 2003 2037 M 46 ± 6 23 ± 3 7 AS soda ≥ 1/wk v. none – • 8 Barrio-Lopez et al. 2013§ (39) SUN Spain, 1999 8157 M, F 36 ± 11 23 ± 3 6 AS soda Extreme quintiles – • 7 Bes-Rastrollo et al. 2006§ (41) SUN Spain, 1999 7194 M, F 37 ± 12 – 2 AS soda Extreme quintiles – Gain > 1 kg 8 Renault et al. 2015 (23) TOP Denmark, 2009 347 F 31 ± 4 34 ± 4 0.8 AS soda ≥ 1/d v. none – GWG 7 Vyas et al. 2015 (17) WHI USA, 1993 59 614 F 63 ± 7 59% OW 9 ASB ≥ 2/d v. ≤ 3/mo – CVD 6 Stinson et al. 2013 (58) WHI USA, 1996 62 082 F 50–9 – 9–14 ASB > 3/d v. < 3/mo – • 6 Note: ARIC = Atherosclerosis Risk in Communities, AS soda = artificially sweetened soda (soft drinks), ASB = artificially sweetened beverages (including sodas and other beverages such as coffee or tea), BMI = body mass index, BWHS = Black Women’s Health Study, CARDIA = Coronary Artery Risk Development in Young Adults, CHD = coronary heart disease, CKD = chronic kidney disease, CVD = cardiovascular disease, E3N = Etude Epidemiologique aupres des femmes de la mutuelle generale de l’Education Nationale, EAT = Eating Among Teens, ENRICA = Study on Nutrition and Cardiovascular Risk in Spain, EPIC = European Prospective Investigation into Cancer and Nutrition, FOS = Framingham Offspring Study, F = female, GDM = gestational diabetes mellitus, GWG = gestational weight gain, GUTS II = Growing Up Today Study II, HPFS = Health Professionals Follow-Up Study, HOMA-IR = homeostatic model assessment for insulin resistance, IGT = impaired glucose tolerance, IQR = interquartile range, M = male, MCCS = Melbourne Collaborative Cohort Study, MESA = Multi-Ethnic Study of Atherosclerosis, NHS = Nurses’ Health Study, NOMAS = Northern Manhattan Study, NNS = nonnutritive sweetener, OW = overweight, PHHP = Pawtucket Heart Health Program, SAHS = San Antonio Heart Study, SALSA = San Antonio Longitudinal Study of Aging, SD = standard deviation, SUN = Seguimiento Universidad de Navarra, TOP = Treatment of Obese Pregnant Women, WHI = Women’s Health Initiative.
↵* Sorted by cohort name. In some cases, different outcomes from a single cohort are reported in separate studies. Where multiple cohorts are reported in a single study, characteristics are reported per cohort rather than per study.
↵† Unless otherwise specified.
↵‡ Study quality was assessed using the Newcastle–Ottawa Scale; (31) maximum score = 9. See Appendix 1, Table S5 for detailed quality assessment results.
↵§ Unpublished data provided by study authors.
↵¶ Excluded study InterAct 2013 (53) reports overlapping data from the international EPIC study.
↵** Excluded study de Koning et al. 2011 (61) reports earlier type 2 diabetes data from this cohort.
↵†† Excluded study Winkelmayer et al. 2005 (62) reports earlier hypertension data from this cohort.
↵‡‡ Excluded study Colditz et al. 1990 (63) reports earlier weight data from this cohort.
↵§§ Excluded study Schulze et al. 2004 (64) reports earlier type 2 diabetes data from this cohort.
↵¶¶ Body mass index data from this study were not reviewed because the SALSA cohort was recruited from the SAHS cohort, reported in Fowler et al. 2008. (50)
- Table 3:
Results from meta-analyses (where possible) or individual studies for intake of nonnutritive sweeteners and long-term cardiometabolic health outcomes in randomized controlled trials and cohort studies
Outcome: change or incidence No. of studies* (participants) Comparison Estimate of NNS effect (95% CI) from meta-analysis or individual studies Assoc. Citation(s)* Figure Randomized controlled trials BMI 3 (242) NNS v. control MD −0.37 kg/m2 (−1.10 to 0.36), I2 9% NS (20), (36), (37) 2 Weight 5 (791) NNS v. control SMD −0.17 (−0.54 to 0.21), I2 81% NS (19), (20), (34), (35), (38) 2 Percentage of fat mass 1 (25) NNS v. control MD −1.01% (−3.01 to 0.99) NS (35) – Waist circumference 3 (683) NNS v. control SMD −0.16 (−0.56 to 0.25), I2 83% NS (19), (20), (34) S1‡ Insulin resistance: HOMA-IR 3 (99) NNS v. control SMD +0.10 (−0.57 to 0.76), I2 55% NS (20), (35), (37) S3‡ HbA1c 1 (62) NNS v. control MD +0.07% (−0.00 to 0.14) NS (20) – Cohort studies BMI 2 (21 256) Continuous correlation WMC +0.05 (0.03 to 0.06), I2 0% ↑ Gain (14), (15) 2 1 (3371) Highest NNS intake quantile v. none MD +0.77 kg/m2 (0.47 to 1.07) ↑ Gain (50) – Weight 4 (32 405) Continuous correlation WMC +0.06 (0.05 to 0.07), I2 46% ↑ Gain (21), (57) 2 Gestational weight gain 1 (347) Highest v. lowest NNS intake quantile MD +2.5 kg (0.5 to 4.5) ↑ Gain (23) – Weight gain > 1 kg 1 (7,194) Highest v. lowest NNS intake quantile OR 1.05 (0.93 to 1.19) NS (41) – Waist circumference 1 (384) Daily v. no NNS consumption MD +2.27 cm (0.96 to 3.58) ↑ Gain (18) – Incident abdominal obesity 1 (5011) Highest v. lowest NNS intake quantile HR 1.59 (1.23 to 2.07) ↑ Gain (60) Incident overweight/obesity 3 (7917) Highest v. lowest NNS intake quantile OR 1.84 (1.28 to 2.66), I2 0% ↑ Risk (22), (50), (59) S1‡ Metabolic syndrome 5 (27 914) Highest v. lowest NNS intake quantile RR 1.31 (1.23 to 1.40), I2 0% ↑ Risk (39), (47), (48), (54), (60) S2‡ Type 2 diabetes 4 (221 363) Per daily serving of NNS RR 1.03 (1.01 to 1.05), I2 0% ↑ Risk (24), (42), (56) S2‡ 9 (400 571) Highest v. lowest NNS intake quantile RR 1.14 (1.05 to 1.25), I2 52% ↑ Risk (16), (24), (42), (49), (55), (56), (58), (60) 2 Gestational diabetes 1 (13 475) Highest v. lowest NNS intake quantile RR 0.87 (0.71 to 1.02) NS (44) – Impaired glucose tolerance 1 (3728) No v. any NNS consumption HR 1.07 (0.91 to 1.26) NS (48) – Hypertension 5 (232 630) Highest v. lowest NNS intake quantile HR 1.12 (1.08 to 1.13), I2 53% ↑ Risk (45), (48), (60) S4‡ Stroke 2 (128 176) Highest v. lowest NNS intake quantile RR 1.14 (1.04 to 1.26), I2 0% ↑ Risk (40) S4‡ Cardiovascular events† 2 (62 178) Highest v. lowest NNS intake quantile RR 1.32 (1.15 to 1.52), I2 0% ↑ Risk (17), (52) S4‡ Coronary heart disease 2 (131 403) Highest v. lowest NNS intake quantile RR 0.98 (0.90 to 1.07), I2 0% NS (46), (51) S4‡ Chronic kidney disease 1 (14 002) Highest v. lowest NNS intake quantile OR 0.80 (0.64 to 1.00) NS (43) – Note: BMI = body mass index, CI = confidence interval, HbA1c = glycosylated hemoglobin, HOMA-IR = homeostatic model assessment for insulin resistance, HR = hazard ratio, MD = mean difference, NNS = nonnutrititve sweetener, NS = not significant, OR = odds ratio, RR = risk ratio, SMD = standardized mean difference, WMC = weighted mean group correlation (unitless).
↵* Number of studies does not always equal the number of citations, because some citations report results from multiple studies.
↵† Defined by the study authors as coronary heart disease, heart failure, myocardial infarction, coronary revascularization procedure, ischemic stroke, peripheral arterial disease and cardiovascular death; (17) or stroke, myocardial infarction and vascular death. (52)
↵‡ Appendix 1, available at www.cmaj.ca/lookup/suppl/doi:10.1503/cmaj.161390/-/DC1.
In this issue

Article tools


Jump to section
Related Articles
Cited By...
- Association of coffee consumption in metabolic syndrome: a cross-sectional and Mendelian randomization study in UK Biobank
- Suppression of insulin stimulated muscle glucose uptake by non-caloric sweetener sucralose and its reversal by an antidiabetic nutraceutical supplement
- Artificial sweeteners and risk of cardiovascular diseases: results from the prospective NutriNet-Sante cohort
- Low-energy sweeteners and body weight: a citation network analysis
- Practical Strategies to Help Reduce Added Sugars Consumption to Support Glycemic and Weight Management Goals
- 5. Facilitating Behavior Change and Well-being to Improve Health Outcomes: Standards of Medical Care in Diabetes--2021
- Maternal low-dose aspartame and stevia consumption with an obesogenic diet alters metabolism, gut microbiota and mesolimbic reward system in rat dams and their offspring
- 5. Facilitating Behavior Change and Well-being to Improve Health Outcomes: Standards of Medical Care in Diabetes--2020
- Non-nutritive sweetener consumption during pregnancy affects adiposity in mouse and human offspring
- Association between intake of non-sugar sweeteners and health outcomes: systematic review and meta-analyses of randomised and non-randomised controlled trials and observational studies
- 5. Lifestyle Management: Standards of Medical Care in Diabetes--2019
- Non-sugar sweeteners and health
- 4. Lifestyle Management: Standards of Medical Care in Diabetes--2018
- Response to "The importance of study design in the assessment of nonnutritive sweeteners and cardiometabolic health"
- The importance of study design in the assessment of nonnutritive sweeteners and cardiometabolic health
- The timing of ingestion may influence the effect of nonnutritive sweeteners on cardiometabolic health: a potentially overlooked factor
More in this TOC Section
Similar Articles

