


Article Figures & Tables
Figures
- Figure 1:
Selection of hospital admissions for the study.
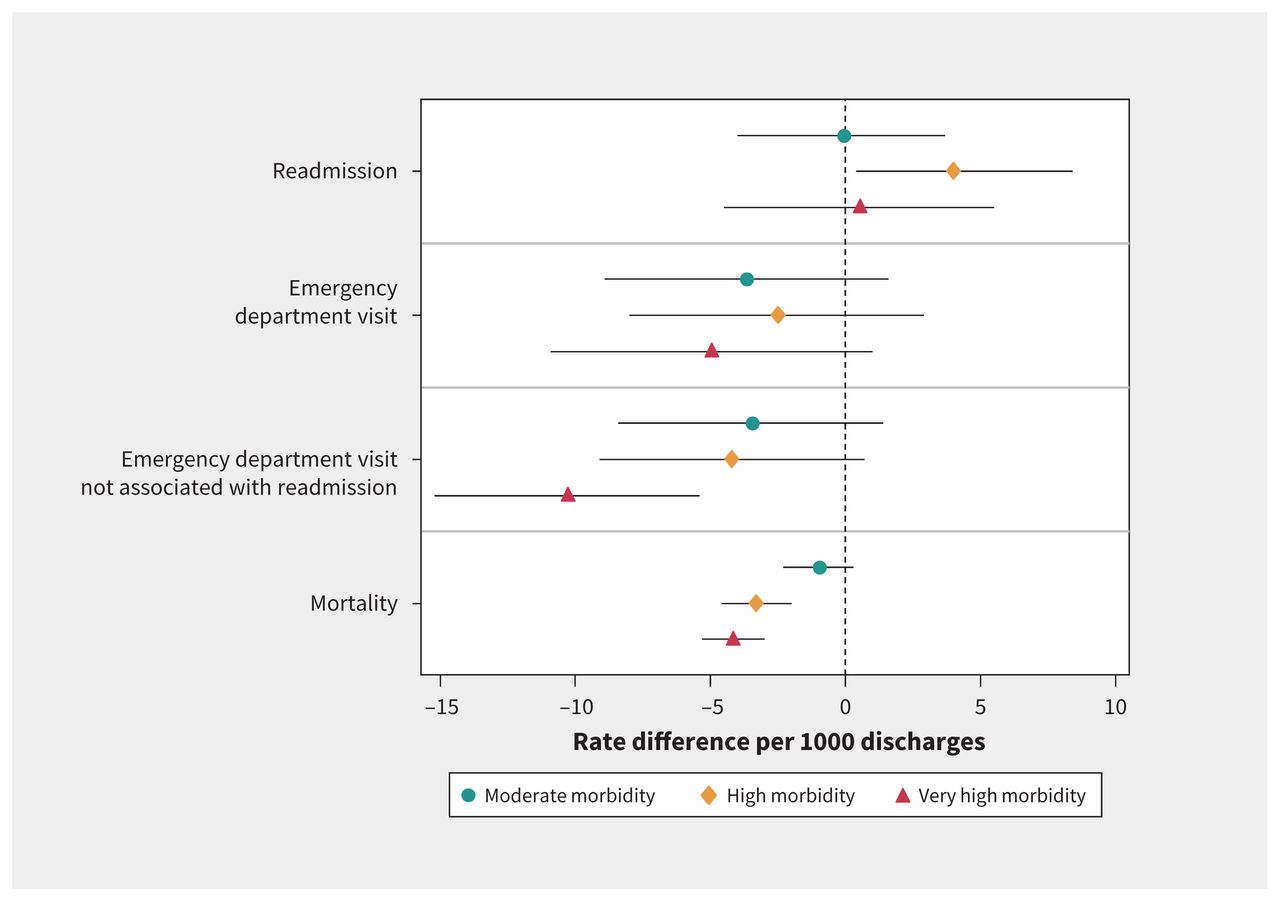
- Figure 2:
Adjusted differences in 30-day cumulative incidence of postdischarge outcomes between team-based and traditional primary care practices, by morbidity level. Error bars represent clustered 95% confidence intervals. Values less than zero indicate a decreased likelihood of the outcome. Exact numbers associated with this figure are provided in Appendix 3. Covariates and 2-way interactions adjusted for are listed in Appendix 1. (Appendices are available at www.cmaj.ca/lookup/suppl/doi:10.1503/160427/-/DC1.)

Tables
- Table 1:
Characteristics at index admission of older or chronically ill patients admitted to hospital for any cause, by primary care model, 2002–2009*
Characteristic Primary care model Absolute standardized difference, % Team-based
n = 107 345Traditional
n = 513 311Before weighting After weighting Patient characteristics Female sex, no. (%) 56 568 (52.7) 270 672 (52.7) 0.1 1.3 Age, yr, mean 73.3 73.3 3.8 3.2 Morbidity level, no. (%) Moderate 19 136 (17.8) 86 812 (16.9) 2.4 0.0 High 30 677 (28.6) 143 285 (27.9) 1.5 0.2 Very high 57 532 (53.6) 283 214 (55.2) 3.2 0.2 Admission cost, Can$,† mean 5656 5656 1.3 0.1 Length of hospital stay, d, mean 7.2 7.2 4.8 0.1 Time since last admission, d, mean 400 409 1.9 4.7 Major diagnostic group, no. (%) Infectious and parasitic diseases 2184 (2.0) 10 764 (2.1) 0.4 0.0 Tumours 10 618 (9.9) 54 298 (10.6) 2.3 0.7 Endocrine, nutritional and metabolic diseases 2015 (1.9) 10 620 (2.1) 1.4 0.1 Diseases of the blood and blood-forming organs 1971 (1.8) 9341 (1.8) 0.1 0.6 Diseases of the nervous system 2968 (2.8) 13 614 (2.7) 0.7 0.1 Diseases of the circulatory system 14 392 (13.4) 81 220 (15.8) 6.8 1.4 Diseases of the respiratory system 7542 (7.0) 42 433 (8.3) 4.7 0.3 Diseases of the digestive system 20 799 (19.4) 90 639 (17.7) 4.4 0.4 Diseases of the respiratory system 11 226 (10.5) 48 033 (9.4) 3.7 0.2 Diseases of the skin and subcutaneous tissue 1449 (1.3) 7465 (1.5) 0.9 0.3 Diseases of musculoskeletal system and connective tissue 7105 (6.6) 32 451 (6.3) 1.2 0.0 Diseases of the genitourinary tract 3312 (3.1) 13 196 (2.6) 3.1 0.5 Symptoms, signs and ill-defined conditions 4240 (3.9) 23 044 (4.5) 2.7 0.7 Congenital anomalies or birth defect 3797 (3.5) 22 848 (4.5) 4.7 0.4 Extraneous causes of morbidity/mortality, abnormal findings 7014 (6.5) 27 338 (5.3) 5.1 0.4 Injuries and poisoning 5107 (4.8) 19 749 (3.8) 4.5 0.6 Factors influencing health and contact with health services 1606 (1.5) 6258 (1.2) 2.4 0.4 Time since enrolment with primary care physician, yr, mean 2.5 2.5 16.2 0.3 Year of index admission, no. (%) 2002/03‡ 9524 (8.9) 81 184 (15.8) 21.2 1.1 2004 19 088 (17.8) 103 224 (20.1) 5.9 2.2 2005 21 317 (19.9) 105 660 (20.6) 1.8 1.3 2006 19 210 (17.9) 95 528 (18.6) 1.9 0.8 2007 18 556 (17.3) 94 428 (18.4) 2.9 2.8 2008/09‡ 19 650 (18.3) 33 287 (6.5) 31.0 0.4 Material deprivation quintile, % 1 (low) 11 166 (10.4) 71 791 (14.0) 11.0 0.1 2 17 142 (16.0) 83 240 (16.2) 0.7 0.2 3 22 266 (20.7) 99 303 (19.3) 3.5 1.1 4 25 249 (23.5) 107 648 (21.0) 6.1 0.1 5 (high) 23 418 (21.8) 116 428 (22.7) 2.1 2.1 Missing 8104 (7.5) 34 901 (6.8) 2.9 1.7 Geographic region, no. (%) Urban/university§ 24 461 (22.8) 184 971 (36.0) 29.4 1.8 Suburban 45 359 (42.3) 197 775 (38.5) 7.6 0.5 Intermediate 30 301 (28.2) 100 593 (19.6) 20.3 0.4 Rural 7014 (6.5) 28 277 (5.5) 4.3 1.8 Missing 210 (0.2) 1695 (0.3) 2.6 0.3 Enrolling primary care physician characteristics Female sex, no. (%) 25 339 (23.6) 121 211 (23.6) 7.1 2.0 Time since graduation, yr, mean 23.8 24.7 11.9 5.1 No. of patients per year, mean 2104 1857 23.4 0.6 % of physicians with proportion of income from acute care establishment ≥ 80% 2.0 0.0 15.7 1.1 ↵* Covariate specifications listed here may not reflect the specifications used in statistical models. Refer to Appendix 3 (available at www.cmaj.ca/lookup/suppl/doi:10.1503/160427/-/DC1) for a full list of covariates, specifications and 2-way interactions.
↵† Costs in current Canadian dollars are based on resource intensity weights for an admission multiplied by its unit cost per fiscal year.
↵‡ These years were grouped because a small number of patients were enrolled in late 2002 (December), and a small number were followed up until early in 2009.
↵§ University regions are regions where there are academic health centres (e.g., Québec, Montréal and Sherbrooke).
- Table 2:
Unadjusted and adjusted* differences in cumulative incidence of postdischarge outcomes among older or chronically ill patients admitted to hospital, by primary care model
Postdischarge outcome Primary care model; unadjusted rate per 1000 discharges Difference in rate (95% CI†) Team-based Traditional Unadjusted Adjusted Within 30 d Readmission 136.3 140.6 −4.3 (−6.6 to −1.9) 1.2 (−2.1 to 4.5) Emergency department visit 201.3 210.0 −8.8 (−13.1 to −5.7) −4.2 (−8.2 to −0.2) Emergency department visit not associated with readmission 159.4 170.1 −10.7 (−14.0 to −8.2) −7.5 (−10.8 to −4.2) Death 13.1 16.8 −3.7 (−4.4 to −2.9) −3.8 (−5.9 to −1.7) Within 90 d Readmission 253.0 256.7 −3.5 (−7.5 to 0.1) 5.5 (0.8 to 10.3) Emergency department visit 321.4 331.4 −10.0 (−14.3 to −7.1) −5.3 (−10.1 to −0.4) Emergency department visit not associated with readmission 255.7 269.4 −13.7 (−17.3 to −11.0) −10.7 (−14.9 to −6.5) Death 22.6 27.0 −4.4 (−4.4 to −3.4) −5.0 (−7.9 to −2.2) Note: CI = confidence interval.
↵* All index admissions (n = 620 656) were included in the analysis. Covariates and 2-way interactions adjusted for are listed in Appendix 1 (available at www.cmaj.ca/lookup/suppl/doi:10.1503/160427/-/DC1).
↵† Cluster bootstrapping was used to obtain 95% CIs.
- Table 3:
Unadjusted and adjusted* cause-specific hazard ratios (HRs) for the association between enrolment in team-based primary care practice at index admission and postdischarge outcomes
Postdischarge outcome Unadjusted HR (95% CI†) Adjusted HR (95% CI†) Within 30 d Readmission 0.98 (0.95 to 1.01) 1.01 (0.96 to 1.04) Emergency department visit 0.95 (0.93 to 0.97) 0.97 (0.93 to 1.00) Emergency department visit not associated with readmission 0.92 (0.90 to 0.95) 0.95 (0.91 to 0.98) Death 0.88 (0.82 to 0.95) 0.95 (0.92 to 0.98) Within 90 d Readmission 1.01 (0.98 to 1.04) 1.04 (1.00 to 1.07) Emergency department visit 1.00 (0.97 to 1.03) 0.99 (0.95 to 1.02) Emergency department visit not associated with readmission 0.97 (0.94 to 1.00) 0.97 (0.92 to 1.00) Death 0.93 (0.84 to 1.04) 0.97 (0.93 to 1.00)
In this issue

Article tools


Jump to section
Related Articles
Cited By...
- Impact of Team-Based Care on Emergency Department Use
- Evaluating the implementation of collaborative teams in community family practice using the Primary Care Assessment Tool
- Alternative Payment Models and Team-Based Care
- The effect of provider affiliation with a primary care network on emergency department visits and hospital admissions
More in this TOC Section
Similar Articles

