


Article Figures & Tables
Figures
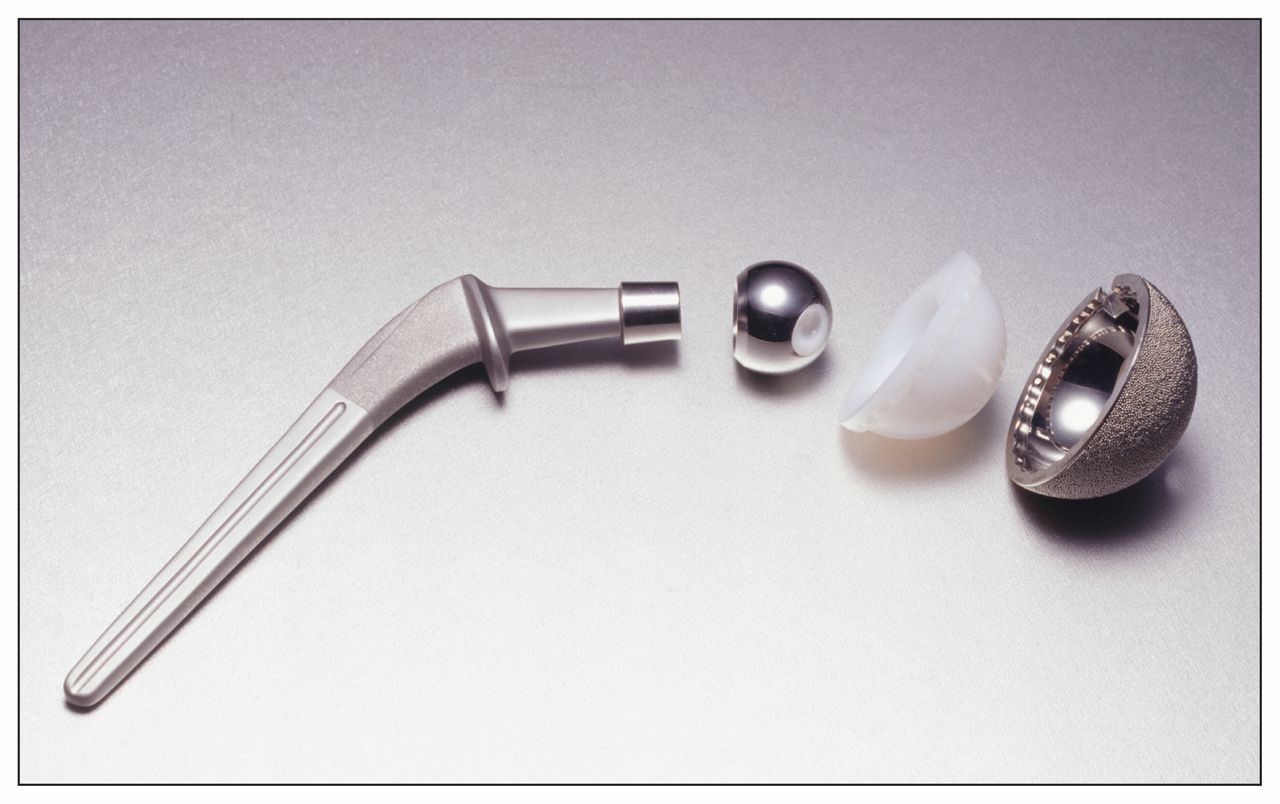
- Figure 1:
Components of traditional hip replacement.
Image courtesy of Photodisc/Thinkstock

Tables
Study Design Duration Patients Comparisons/evaluations Outcomes Fortin et al. (8) Observational; longitudinal Preoperative to 6 mo after hip replacement n = 116, undergoing total hip replacement for osteoarthritis Compared 6-mo outcomes between those with “high” (better) and “low” (worse) function preoperatively SF-36 physical function score,* WOMAC pain score,† WOMAC functional limitation score,‡ hip range of motion: mean difference (high–low) (95% CI) 16.4 (7.3 to 25.5), −1.9 (−3.0 to −0.7), −5.9 (−9.7 to −2.1), 12.8°, respectively (i.e., worse 6-mo status among those with worse function preoperatively). Garbuz et al. (9) Observational; longitudinal From placement on waiting list to 1 yr after hip replacement n = 147, undergoing total hip replacement for osteoarthritis Examined probability of achieving better than expected outcome at 1 yr based on “long” (> 6 mo) v. “short” (≤ 6 mo) wait and by count of months on waiting list from decision to proceed with surgery to operation Better than expected v. not better than expected WOMAC outcomes. 43% of patients with short waits v. 31% of those with long waits achieved better than expected functional outcome. Those with long waits had 50% decreased odds for achieving a better than expected outcome compared with those with short waits. Each additional month spent waiting was associated with an 8% decreased odds (adjusted OR 0.92, p = 0.05) of better than expected functional outcome. No evidence of negative effect of wait time found for WOMAC pain and stiffness domains. Vergara et al. (10) Observational; longitudinal Preoperative to 6 mo after hip replacement n = 527, undergoing total hip replacement for osteoarthritis Examined predictors of change in WOMAC domains over 6 mo, and predictors of achieving minimal clinically important difference on WOMAC domains, including presurgery status and wait time WOMAC pain score, WOMAC functional limitation score, WOMAC stiffness score.§ Change in function was poorer (p = 0.025) among those who waited > 6 mo for surgery. Progressive reduction in % of patients surpassing minimal clinically important difference with increasing wait time; 74% v. 68% v. 52% for those waiting < 3 mo, 3–6 mo and > 6 mo, respectively (p < 0.001). Likelihood of perceiving a gain greater than minimal clinically important difference was lower (OR 0.47, p = 0.006) with > 6 mo wait compared with < 3 mo wait. No effects on other WOMAC domains observed. Hajat et al. (11) Observational; longitudinal Preoperative to 12 mo after hip replacement n = 3600 at 12 mo, undergoing total hip replacement (87.8% had osteoarthritis as primary diagnosis) Examined predictors of 12-mo Oxford Hip Score status, including presurgery status and wait time Oxford Hip Score¶ (measure of severity of hip problems: pain, disability, loss of physical function). Trend of worse 12-mo status with worse presurgery status (p < 0.001), longer wait to first outpatient appointment (p < 0.001) and longer time on wait list (p < 0.001). Fortin et al. (12) Observational; longitudinal Preoperative to 2 yr after hip replacement n = 84, undergoing total hip replacement for osteoarthritis (subset of sample from Fortin et al. (8) who completed 2-yr survey) Compared 6-mo outcomes between those with “high” (better) and “low” (worse) function preoperatively SF-36 physical function score,* WOMAC pain score,† WOMAC functional limitation score‡: mean difference (high–low) (95% CI) 14.7 (2.6 to 26.8), −1.5 (−3.1 to 0.1), −6.6 (−11.8 to −1.4), respectively (i.e., worse 2-yr status among those with worse function preoperatively). Note: CI = confidence interval, OR = odds ratio, SF-36 = 36-Item Short-Form Health Survey, WOMAC = Western Ontario and McMaster Universities Arthritis Index.
↵* The SF-36 physical function score ranges from 0 to 100: higher scores indicate better physical health, and a minimal clinically important difference is 20 points.
↵† The WOMAC pain score ranges from 0 to 20 and is standardized to a range of 0 to 100: 0 represents the best health status and 100 the worst health status, and the minimal clinically important difference is 29 points.
↵‡ The WOMAC functional limitation score ranges from 0 to 68 and is standardized to a range of 0 to 100: 0 represents the best health status and 100 the worst health status, and the minimal clinically important difference is 26 points.
↵§ The WOMAC stiffness score ranges from 0 to 8 and is standardized to a range of 0 to 100: 0 represents the best health status and 100 the worst health status, and the minimal clinically important difference is 25 points.
↵¶ The Oxford Hip Score ranges from 0 to 48: 0 represents maximum disability and 48 no disability, and the minimal clinically important difference is between 4 and 6 points.
- Table 2:
Patient-specific factors as predictors of patient-reported outcomes following total hip replacement
Study; variable Outcomes (generally assessed between 3 and 24 mo after surgery) Ethgen et al. (16) Age Age was not a factor in pain outcomes.
Results were mixed for physical function: either no effect or older age associated with somewhat worse scores.
Reported change in pain and function were similar across age groups, but status was generally worse with older age.
Sex Results were mixed: either no difference in change in pain and function, or men trended toward greater improvement in function and/or pain.
Status at follow-up trended toward better among men.
Ethnicity Black patients had less change in pain and function than white patients.
Obesity Higher BMI was generally associated with greater change in pain and function, but worse status.
Education Range of health-related quality-of-life outcomes: higher educational attainment was generally associated with greater improvement.
Comorbidity Greater levels of comorbidity were generally associated with less improvement in pain and function.
The influence appeared to be greater among older age groups.
Jones et al. (17) Age Older age at surgery was associated with greater satisfaction.
Obesity Results were inconsistent for health-related quality-of-life outcomes.
Generally, no influence was identified; some patients reported worse postoperative pain and functional status.
Mental well-being Preoperative psychological status explained some variation in postoperative pain and function.
High levels of anxiety or depression were associated with worse outcomes.
Comorbidity A greater number of comorbid conditions were associated with worse short- term pain and functional outcomes.
The overall impact appeared to be relatively small.
The influence of older age was believed to be mediated through number of conditions.
Santaguida et al. (18) Age Results were inconsistent for revision surgery; younger patients were at somewhat greater risk at 2–20 yr.
Older age was associated with greatest risk of death at 30–90 d.
Older age was associated with poorer function, though not when assessed using WOMAC.
Age was not associated with postoperative satisfaction, but older age was associated with less satisfaction after revision surgery.
Sex Results were inconsistent for revision surgery; men were at somewhat greater risk, particularly younger men.
Men were generally at greater risk of death at 30–90 d.
Women generally had poorer function, showed less functional improvement and showed less postoperative pain.
Sex was not associated with satisfaction following the primary procedure, but women reported less satisfaction following revision surgery.
Obesity Higher BMI was associated with poorer postoperative function.
Obesity status was not associated with postoperative satisfaction.
Note: BMI = body mass index, WOMAC = Western Ontario and McMaster Universities Arthritis Index.
Study Design Final follow-up, yr Sample size Outcome Findings at follow-up (total hip replacement v. hip resurfacing) Garbuz et al. (70) RCT Mean 1.1 (range 0.8– 2.2) 107 WOMAC score, mean 90.1 v. 90.4, p = 0.950 SF-36 physical function score, mean 51.2 v. 51.2, p = 0.979 Lavigne et al. (71) RCT 1 48 Gait speed, m/s 1.46 ± 0.18 v. 1.44 ± 0.19, p > 0.05 Step length, m 0.68 ± 0.07 v. 0.67 ± 0.07, p > 0.05 Pollard et al. (56) Retrospective, matched cohort 5–7 108 UCLA activity score 6.8 v. 8.4, p < 0.001 EQ-5D score 0.78 v. 0.9, p = 0.003 Smith et al. (48) UK registry 5 > 400 000 Implant failure Total hip replacement: 2.8% (95% CI 2.7% to 2.9%) Hip resurfacing:
Men: 3.6% (95% CI 3.3% to 3.9%)
Women: 8.5% (95% CI 7.8% to 9.2%)Corten and MacDonald (72) Australian registry 5 > 135 000 Implant failure Total hip replacement: 2.7% Hip resurfacing: 3.7%, p < 0.001 Johanson et al. (73) Norwegian registry 2 > 170 000 Implant failure, cumulative revision rate Total hip replacement: 1.2% (95% CI% 1.2 to 1.3%) Hip resurfacing: 3.3% (95% CI 2.2% to 4.3%), p < 0.001 Note: CI = confidence interval, EQ-5D = Euro-Qol 5-dimension, RCT = randomized controlled trial, SF-36 = 36-Item Short-Form Health Survey, UCLA = University of California Los Angeles, WOMAC = Western Ontario and McMaster Universities Arthritis Index.
- Table 4:
Selected studies comparing outcomes of minimally invasive and standard-incision total hip replacement
Study Design Final follow-up Sample size Primary outcome Findings at follow-up (mini-incision v. standard incision) Dorr et al. (80) RCT 6 mo 60 Total blood loss, mL, mean 352.3 ± 145.5 v. 408.3 ± 158.3, p = 0.12 Length of stay, h, mean 63.2 ± 13.3 v. 73.6 ± 23.5, p = 0.04 Ogonda et al. (77) RCT 6 wk 219 10-m walk time, s, mean 54.4 ± 29.8 v. 54.5 ± 32.7, p = 0.97 Stair climbing, s, mean 19.31 ± 8.78 v. 19.58 ± 9.38, p = 0.83 Hematocrit level on discharge, mean 0.275 ± 0.04 v. 0.276 ± 0.04, p = 0.75 36-h VAS pain score, mean 16.8 ± 20.3 v. 19.8 ± 21.2, p = 0.29 Chimento et al. (79) Retrospective, matched cohort 1 60 Total blood loss, mL, mean 378 ± 151 v. 504 ± 205, p < 0.009 6-wk limp 21.4% v. 46.8%, p = 0.04 1-yr limp None Hospital length of stay, d, mean (range) 5.8 (4–13) v. 5.5 (3–15), p = 0.6 Note: RCT= randomized controlled trial, VAS = visual analogue scale.
- Table 5:
Selected studies comparing outcomes of metal-on-metal and metal-on-polyethylene hip replacement
Study Design Final follow-up, yr Sample size Outcome Mean difference (95% CI) (metal-on-metal v. metal-on-polyethylene) Dahlstrand et al. (84) RCT 2 54 Harris Hip score 3.1 (−2.0 to 8.2) Engh et al. (85) RCT 2 59 Harris Hip score 4.0 (−0.4 to 8.4) Lombardi et al. (86) RCT 5.7 99 Harris Hip score 1.2 (−1.9 to 4.3) MacDonald et al. (87) RCT 3.2 41 Harris Hip score 0.4 (−7.0 to 7.8) Zijlstra et al. (88) RCT 10 200 Harris Hip score 1.0 (−2.9 to 4.9) Note: CI = confidence interval, RCT = randomized controlled trial.
In this issue

Article tools


Jump to section
- Article
- When should patients be referred for surgical assessment?
- What surgical options are there?
- Is hip replacement or is hip resurfacing the best approach?
- Is mini-incision hip surgery preferable to conventional hip surgery?
- What are the comparative benefits and risks of metal-on-metal versus other bearing surfaces?
- What management options exist when patients require revision?
- Future directions
- Footnotes
- References
- Figures & Tables
- Related Content
- Responses
- Metrics
Related Articles
Cited By...
More in this TOC Section
Similar Articles
Collections

