


Article Figures & Tables
Figures
- Figure 1:
(A) Mean values of Frailty Index at each study cycle as a function of age (n = 14 127, population-weighted). (B) Proportion of participants with each health status at baseline, as a function of age (n = 14 127, population-weighted). Definitions of fitness categories: relatively fit, Frailty Index ≤ 0.03; less fit, 0.03 < Frailty Index ≤ 0.10; least fit, 0.10 < Frailty Index ≤ 0.21; and frail, Frailty Index > 0.21.
- Figure 2:
Transition of health state and mortality over 2, 4 and 12 years in people who were relatively fit (A, n = 7183) or frail (B, n = 1019) at baseline. Data are population-weighted.
- Figure 3:
Kaplan–Meier probability of survival over 12 years, according to baseline health status, for all respondents at least 15 years of age (A) and for three age groups: 15–39 years (B), 40–69 years (C) and 70 years or older (D). The numbers of respondents for various levels of mortality risk over time are presented in Table 2. In keeping with Statistics Canada’s privacy policy, data are not shown where samples sizes were less than six (e.g., for the “most frail” category in Figure 3B and for some points in the “most frail” category in Figure 3C).


Tables
- Table 1:
Baseline characteristics of the study sample, by health status*

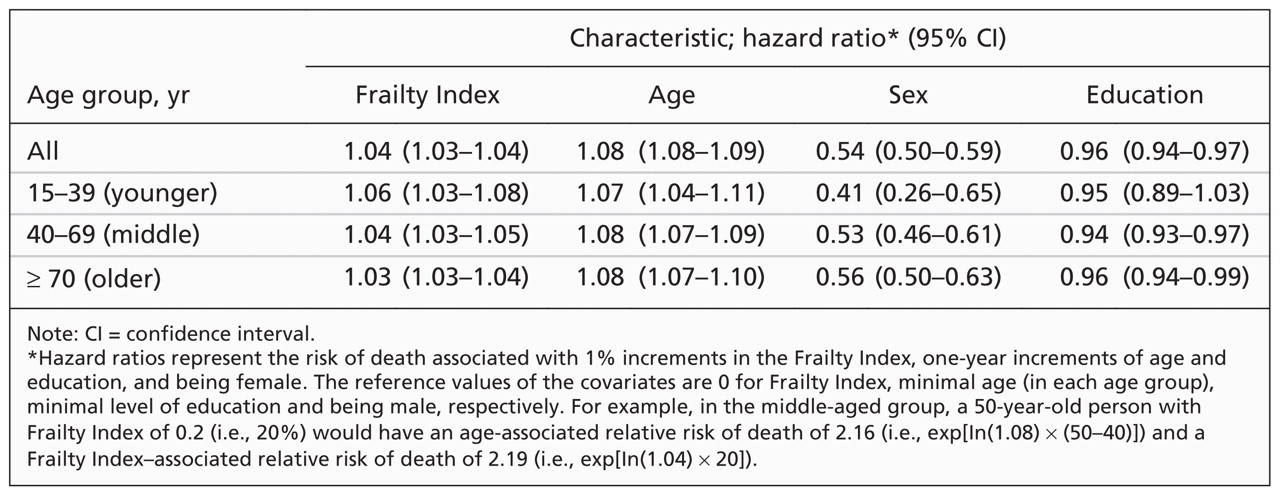
- Table 3:
Hazard ratios for 12-year survival, based on multivariable Cox regression models for different age groups


In this issue

Article tools


Jump to section
Related Articles
Cited By...
- Frailty among middle-aged and older women and men in India: findings from wave 1 of the longitudinal Ageing study in India
- Measuring the Frailty Phenotype and its Association with Cognition in Mid-Life and Older Age
- Frailty assessment for COVID-19 follow-up: a prospective cohort study
- Elements devaluation des adultes ages fragiles qui demandent laide medicale a mourir
- Considerations for assessing frail older adults requesting medical assistance in dying
- Impact of Frailty on Treatment Outcome in Patients With Locally Advanced Esophageal Cancer Undergoing Concurrent Chemoradiotherapy
- Frailty differences across population characteristics associated with health inequality: a cross-sectional analysis of baseline data from the Canadian Longitudinal Study on Aging (CLSA)
- Swiss Frailty Network and Repository: protocol of a Swiss Personalized Health Networks driver project observational study
- Gut Microbiota predicts Healthy Late-life Aging in Male Mice
- Measuring frailty in younger populations: a rapid review of evidence
- Sex differences in genetic and environmental influences on frailty and its relation to body mass index and education
- A comparison of 3 frailty measures and adverse outcomes in the intake home care population: a retrospective cohort study
- Frailty and comorbidity in predicting community COVID-19 mortality in the UK Biobank: the effect of sampling
- Patient-reported outcome measures after COVID-19: a prospective cohort study
- Functional ageing in fibrotic interstitial lung disease: the impact of frailty on adverse health outcomes
- Construction of a Frailty Index as a Novel Health Measure in Systemic Lupus Erythematosus
- The frailty index is a predictor of cause-specific mortality independent of familial effects from midlife onwards
- Prevalence of frailty in older adults in outpatient physiotherapy in an urban region in the western part of Germany: a cross-sectional study
- A frailty index for UK Biobank participants
- Frailty in the context of rehabilitation interventions for adults: protocol for a scoping review
- Frailty in Critical Care: Examining Implications for Clinical Practices
- Assessing the measurement properties of a Frailty Index across the age spectrum in the Canadian Longitudinal Study on Aging
- Changes in Frailty Predict Changes in Cognition in Older Men: The Honolulu-Asia Aging Study
- The impact of frailty on outcomes and healthcare resource usage after total joint arthroplasty: a population-based cohort study
- Social and behavioural factors associated with frailty trajectories in a population-based cohort of older adults
- Frailty Index to Measure Health Status in People with Systemic Sclerosis
- Association between frailty and short- and long-term outcomes among critically ill patients: a multicentre prospective cohort study
- Evaluative Frailty Index for Physical Activity (EFIP): A Reliable and Valid Instrument to Measure Changes in Level of Frailty
- The Importance of Cardiorespiratory Fitness in the United States: The Need for a National Registry: A Policy Statement From the American Heart Association
- Frailty: joining the giants
More in this TOC Section
Similar Articles
Collections

