


Abstract
Methods: We analyzed the rates of death and graft failure among the 11 482 Canadians with end-stage renal disease who received a kidney transplant in 1981–98. Patients were followed from the date of transplantation to the date of graft failure, the date of death or the end of the observation period, namely, Dec. 31, 1998, depending on which was the earliest. Rate ratios for mortality and graft failure — ratios of the rate for each calendar period to the rate for the arbitrarily chosen reference period, 1981–85 — were estimated with a piece-wise exponential model that adjusted for age, sex, ethnicity, primary renal diagnosis, follow-up time and donor-organ source.
Results: The rates and adjusted rate ratios for death and graft failure decreased significantly and steadily over time. Relative to 1981–85, the adjusted mortality rate ratios were 0.70 (95% confidence interval [CI] 0.54–0.89), 0.65 (95% CI 0.52–0.82) and 0.53 (95% CI 0.41–0.67) for 1986–89, 1990–94 and 1995–98 respectively, and the adjusted graft failure rate ratios were 0.68 (95% CI 0.60–0.78), 0.62 (95% CI 0.54–0.70) and 0.51 (95% CI 0.44–0.58) respectively. The decrease was mostly among the cadaveric-organ recipients. Calendar period was as important a predictor of outcome as well-known prognostic factors such as age and primary renal diagnosis.
Interpretation: Decreases in mortality rates are probably related to refinements in patient management. Decreases in graft failure rates are probably the result of a combination of improved immunotherapy and better management of nonimmunologic conditions such as hypertension and hyperlipidemia.
Renal transplantation is the preferred method of renal replacement therapy for patients with end-stage renal disease in terms of patient survival,1 quality of life2,3 and health care cost.2,4 Several important advances in the general medical management of the patient, both before and after transplantation, have occurred over the last 5–15 years.5,6 However, few studies have formally examined trends in outcomes over time.
Registry data are often a suitable basis for examination of outcome trends. Although it may be of limited detail, a registry that is population-based and of national scope can provide an accurate description of trends. More detailed, patient-specific information may be collected in centre-specific studies, but the data may vary markedly across centres, such that they do not represent the nation. We sought an accurate, national description of the degree to which advances in transplantation have resulted in improved outcomes. Using data from the Canadian Organ Replacement Register (CORR), a population-based, nationwide organ-failure registry, we analyzed mortality and graft failure rates among Canadians who received a kidney transplant in 1981–98, adjusting for patient characteristics that could be associated with patient and graft survival: age, sex, ethnicity, primary renal diagnosis and donor-organ source.
Methods
Data were obtained from CORR, a registry of the Canadian Institute for Health Information (CIHI).7 Each of the 86 Canadian renal centres collects baseline demographic data from all patients at the start of renal replacement therapy, including date of birth, sex, province of residence, ethnicity (self-reported), conditions that coexisted before the start of dialysis and primary renal diagnosis. Annually, each centre submits clinical history data, including information on dialytic modality assignments and switches, transplantations and graft failures. Mortality information is reported along with the other follow-up information. Data were available for all patients for whom renal replacement therapy was started between Jan. 1, 1981, and Dec. 31, 1998. The study population consisted of the 11 482 patients who received a renal transplant between Jan. 1, 1981, and Dec. 31, 1998. The patients were classified by sex, primary renal diagnosis and ethnicity. Follow-up began on the date of transplantation and finished on the date of graft failure, the date of death or the end of the observation period, namely, Dec. 31, 1998, whichever was the earliest. At the end of follow-up period, the patients were classified into one of 3 mutually exclusive categories: death, graft failure or censored, that is, patients who neither died nor had graft failure. When death occurred within 7 days after graft failure, the classification was death.
Patient-years of follow-up were classified by age (≤ 14, 15–44, 45–64, 65–74 and ≥ 75 years), calendar period (1981–85, 1986–89, 1990–94 and 1995–98) and follow-up time (1-year intervals). Mortality rates were computed as the number of deaths per 1000 person-years. The piecewise exponential model (also referred to as the Poisson regression model8,9) was used to compare mortality rates among the calendar periods while adjusting for age, sex, ethnicity, primary renal diagnosis, follow-up time and donor-organ source. The mortality rate ratio (RR), that is, the ratio of the mortality rate for each calendar period to the rate for the arbitrarily chosen reference period, 1981–85, served as the parameter of interest. Separate models were also fitted by donor-organ source. Parameter estimates based on the piecewise exponential model were used to generate fitted survival curves by calendar period for “reference” transplant patients: white women aged 45–64 years with glomerulonephritis as the primary renal diagnosis and a cadaveric-donor organ. To further assess the trend in mortality rates, a model was fitted that used the RRs for the reference patients and 7 calendar periods: the reference period and each nonreference period split in half. The same methods were used to generate rates, RRs and survival curves for graft failure.
Results
The distribution of patients by age, sex and ethnicity changed very little over time, but the distribution by primary renal diagnosis and donor-organ source showed strong trends (Table 1). Between 1981–85 and 1995–98 the proportion of patients who had diabetes as the primary renal diagnosis increased from 14% to 18%, the proportion with glomerulonephritis as the primary renal diagnosis decreased from 34% to 22%, and the proportion receiving a cadaveric organ decreased from 83% to 72%. During the study period the mean age of the patients at transplantation increased from 36.7 to 43.9 years.
Table 1.
The rates and RRs for death and graft failure decreased during the study period (Table 2). Adjusted for all covariates, the mortality RR was significantly lower in all the later calendar periods than in the reference period (1981–85). The greatest decrease was during 1986–89, when the adjusted mortality rate was 70% of that in 1981–85 (95% confidence interval [CI] 54%–89%). Similarly, the single greatest decrease in the adjusted RR for graft failure was in 1986–89.
Table 2.
To put the effect of calendar period in broader context, we examined the RRs for several covariates by end point (Table 3). Indeed, age, sex, ethnicity (i.e., South Asian v. white), primary renal diagnosis and donor-organ source were all important predictors of both death and graft failure. In particular, patients with living related donors had adjusted RRs for both mortality and graft failure that were about half those of patients with cadaveric donors, a significant difference. Compared with the other covariates, calendar period was at least as strong a predictor of death and graft failure (and sometimes stronger), judging from the RRs.
Table 3.
Covariate-adjusted RRs for both mortality and graft failure are presented by donor-organ source in Table 4. Both rates of mortality and graft failure fell significantly over time among transplant patients with cadaveric donors; the decrease was equally pronounced for mortality and graft failure. No significant trend in mortality was observed in the patients with living related donors, whereas a significant decrease was observed for graft failure rates during 1995–98 only. As a follow-up to these results, we fitted models separately by calendar period in order to assess trends in the strength of donor-organ source as a predictor of death and graft failure. The protective effect of having a living related (versus cadaveric) donor decreased in importance as a predictor of death, the adjusted RRs increasing steadily from 0.42 (95% CI 0.19–0.91) in 1981–85 to 0.67 (95% CI 0.53–0.86) in 1995–98 (data not tabulated). Similar results were observed for graft failure.
Table 4.
The predicted 5-year survival of reference patients and their grafts (Fig. 1) increased between 1981–85 and 1995–98, from 84% to 91% for the patients (top panel) and from 63% to 80% for the grafts (bottom panel). The curves were derived from the RRs in Table 4.

Fig. 1: Fitted 5-year survival probability by calendar period for patients (top panel) and grafts (bottom panel), as predicted for reference Canadian renal transplant patients (women, white, aged 45–64 years, with glomerulonephritis as the primary renal diagnosis and a cadaveric-donor organ).
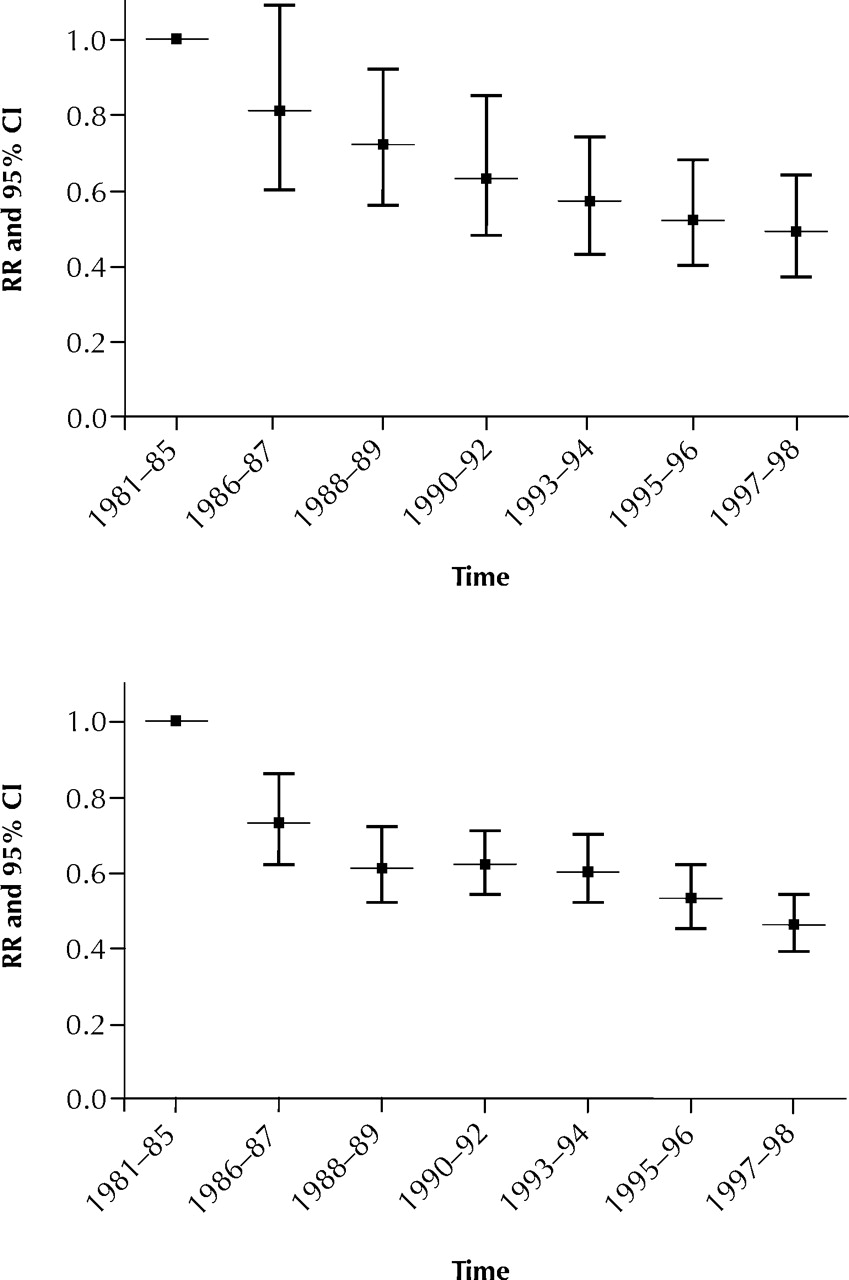
To examine the nature of the decrease in mortality and graft failure in more detail, we divided each post-1985 calendar period in half. The largest decrease in adjusted RR for the reference patients (Fig. 2) occurred during 1986–87. For mortality (top panel), the decrease slowed after 1987 but persisted steadily into 1997–98. For graft failure (bottom panel), the decrease continued into 1988–89, then levelled off until 1995 before decreasing thereafter.

Fig. 2: Covariate-adjusted rate ratio (RR) — the ratio of each calendar period–specific rate to the rate for the reference period, 1981–85 — and 95% confidence interval (CI) by calendar period for mortality (top panel) and graft failure (bottom panel) in the reference patients.
Interpretation
We observed significant reductions over time in adjusted RRs for death and graft failure among Canadian renal transplant patients between 1981 and 1998. The decreasing trend was largely among cadaveric-organ recipients and was equally pronounced for mortality and graft failure. The decrease in mortality continued to the end of 1998 (the end of our observation period), whereas that for graft failure levelled off in the late 1980s before resuming in the mid-1990s.
Several important advances in general medical management both before and after renal transplantation have occurred over the last 5–15 years.5,6 Decreases in mortality rates are likely related to refinements in patient management, whereas decreases in graft failure rates are likely due to more effective immunotherapy and better management of nonimmunologic conditions such as hypertension and hyperlipidemia. The greatest decrement that we observed in both mortality and graft failure rates occurred after 1985, corresponding to the widespread adoption of cyclosporine therapy.
Data with which we could compare our findings are sparse, because few studies have formally examined trends in mortality specific to renal replacement therapy. However, it appears that renal transplant outcomes are improving worldwide.10,11,12,13,14,15,16,17,18 The decreasing rates that we observed appear to be of similar magnitude to those observed in the United States.10,11 The United Network for Organ Sharing (UNOS) reported covariate-adjusted RRs of 1.81 (1987–90) and 1.37 (1991–95) for “GF+death” and 2.02 (1987–90) and 1.40 (1991–95) for graft failure, with 1996–99 serving as the reference period.12 Our results are not directly comparable with those from UNOS owing to important discrepancies in end-point definitions and available covariates. In Norway, the 1-year graft survival rate improved from 78% (1983–91) to 84% (1989–97) and the 5-year rate from 59% (1983–91) to 65% (1989–97).14,15 Similar results were observed in other European countries and in Australia.16,17,18
The trends that we observed for transplantation outcomes parallel but are more extreme than those observed for Canadian dialysis patients.19,20 As with all observational studies, there is the potential for spurious findings due to biased RRs resulting from unmeasured covariates. In our study, as with the analyses of trends in dialysis patients, the condition of the patients in the case mix worsened over the observation period. The unadjusted RRs underestimated the improvement in patient survival. This leads us to believe that if more detailed, patient-specific information were available, the observed decreases in adjusted outcome rates would be greater. Because of our definitions, death and graft failure serve as competing risks.21 As such, the estimated survival curves are useful for comparing calendar periods but could be interpreted in absolute terms only if death and graft failure were independent,22 a clearly false assumption.
The data used in this investigation were supplied by CORR. Advantages of analyses based on registry data include cost efficiency and data volume. Moreover, among registries, CORR has data of exceptional quality, in that the date of initiation of renal replacement therapy and the dates of all modality switches are recorded for each patient.7 Limitations of registry data relate to the detail of the information recorded. These issues were recently explored at length by Ward and Brier.23 Although coverage by CORR is complete in that all 86 Canadian renal centres participate, the data are submitted voluntarily, and the database has never been validated. However, such factors pose no major threat to the validity of our findings, because it is doubtful that incompleteness of the reporting of death or graft failure was frequent, and it is even less likely that the degree of nonreporting varied systematically over time. The greatest limitation of our study is the lack of ability to assess the relative importance of factors responsible for the observed improvement in outcomes. Thus, the function of our investigation was mostly descriptive, generating results to be examined in greater detail by future studies.
We observed significant decreases in covariate-adjusted RRs of death and graft failure over 1981–98. Calendar period was as strong a predictor of death or graft failure as well-known prognostic indicators such as age and underlying disease leading to end-stage renal disease. Although beyond our current scope, an examination of renal centre–specific outcome rates would be valuable, particularly in light of reports that the “centre effect” is also a relatively strong prognostic factor.
Footnotes
-
This article has been peer reviewed.
Contributors: Douglas Schaubel was responsible for study conception and design, data acquisition and data analysis. John Jeffery was responsible for data acquisition. Yang Mao was responsible for study conception and design and data interpretation. Robert Semenciw was responsible for data analysis, data interpretation and review of the statistical literature. Karen Yeates was responsible for data interpretation and review of the substantive literature. Stanley Fenton was responsible for study conception and design, data acquisition and data interpretation. All authors contributed to manuscript preparation.
Acknowledgements: These results were presented in part at Transplant 2000, the first joint meeting of the American Society of Transplant Surgeons and the American Society of Transplantation, May 13–17, 2000, in Chicago. The collection and maintenance of Canadian Organ Replacement Register (CORR) data is made possible by the wholehearted collaboration of the 86 renal programs across Canada. The contribution of the current and past full-time staff assigned to the register at the Canadian Institute for Health Information (formerly the Hospital Medical Records Institute) has also been essential to the success of the register. The Canadian Society of Nephrology, the Canadian Transplant Society and the Canadian Association of Nephrology, and their constituent members, along with nurses and technicians, have also made an essential contribution to the register since its inception in 1981.
This investigation was funded by the Centre for Chronic Disease Prevention and Control (formerly the Laboratory Centre for Disease Control), Health Canada.
Competing interests: None declared.
References
In this issue
Article tools


Jump to section
Related Articles
Cited By...
- No citing articles found.
More in this TOC Section
Similar Articles
Collections

